Arq. Bras. Med. Vet. Zootec., v.69, n.1, p.243-251, 2017
Influence of stocking density on growth performance and welfare of juvenile tilapia (Oreochromis niloticus) in cages
[Influência da densidade de criação sobre o desempenho de crescimento e bem-estar de tilápias (Oreochromis niloticus) juvenis em gaiolas]
Â.A.P. Costa¹, R. Roubach2, B.S.L. Dallago1,4*, G.W. Bueno3,
C. McManus1,4, F.E.M. Bernal1,4
1Faculdade de Agronomia e Medicina Veterinária Universidade de Brasília-UnB Brasília, DF
2Gabinete da Secretaria de Aquicultura e Pesca Ministério da Agricultura, Pecuária e Abastecimento Brasília, DF 3Curso de engenharia de Pesca Universidade Estadual Paulista, Campus de Registro Registro, SP
4Instituto Nacional de Ciência e Tecnologia – Informação Genético-Sanitária da Pecuária Brasileira
(CNPq/INCT/IGSPB) Belo Horizonte, MG
ABSTRACT
Intensification of tilapia production can cause negative implications on performance and welfare of fishes. Thus, it is essential to determine a correct density for optimal production. This study aimed to evaluate performance and animal welfare of juvenile Nile tilapia with an initial weight average of 30g (± 2.70) reared using three different stocking densities in floating net-cages. Fish were fed three times a day with feed containing 32% crude protein during 74 days. The experimental design was completely randomized with 3 treatments (250 fish/m³, 350 fish/m³ and 450 fish/m³) and 4 replicas. The physical - chemical parameters of water were monitored throughout the experiment. Increase in stocking density caused a decrease in the final weight of fish, weight gain, daily weight gain, standard length and survival, as well as an increase in feed conversion. However, higher densities seem to reduce the effect on weight variation. There was no influence of stocking density on final biomass, blood glucose and serum cortisol concentrations. Therefore, the increase of stocking density compromised development and survival of fish, but did not influence the physiological parameters of stress. Thus, treatment with 250 fish/m³ was shown to be the most suitable for fish performance.
Keywords: animal welfare, aquaculture, biomass, cortisol, stress
RESUMO
A intensificação da produção de tilápias pode gerar implicações negativas sobre odesempenho e o bem-estar dos peixes. Assim, é essencial determinar a densidade correta para otimizar a produção. O objetivo deste estudo foi avaliar o desempenho e o bem-estar de tilápias-do-nilo (Oreochromis niloticus) juvenis, com peso inicial médio de 30g (± 2,70), criadas em três diferentes densidades de estocagem, em gaiolas de flutuação. Os peixes foram alimentados três vezes/dia, com ração contendo 32% de proteína bruta, durante 74 dias. O desenho experimental foi completamente ao acaso, com três tratamentos (250 peixes/m³, 350 peixes/m³ e 450 peixes/m³) e quatro réplicas. Os parâmetros físico-químicos da água foram monitorados durante o experimento. A elevação da densidade de criação causou redução no peso final dos peixes, no ganho de peso, no ganho de peso diário, no comprimento padrão e na taxa de sobrevivência, bem como elevou a taxa de conversão alimentar. Entretanto, densidades mais elevadas reduziram o efeito na variação de peso. Não houve influência da densidade de criação nos parâmetros de biomassa final, da concentração de glicose sanguínea e de cortisol sérico. Portanto, o aumento na densidade de criação compromete o desenvolvimento e a taxa de sobrevivência dos peixes, mas não influencia os parâmetros fisiológicos de estresse. Assim, o tratamento com 250 peixes/m³ apresentou resultados mais apropriados ao melhor desempenho dos peixes.
Palavras-chave:bem-estar animal, aquicultura, biomassa, cortisol, estresse
Recebido em 8 de julho de 2016 Aceito em 19 de julho de 2016
INTRODUCTION
Brazil has a great potential for aquaculture as it holds 12% of all available fresh water in the world (Tundisi e Tundisi, 2010). One of the main opportunities of aquaculture in Brazil has been with freshwater fish, especially Nile tilapia (Oreochromis niloticus) in net-cages located in
reservoirs (Bueno et al., 2013). Garcia et al.
(2013) pointed out that in Brazil, producers have opted to cultivate O. niloticus in cages with
densities from 80 to 120kg/m³.
The productivity cycle of Nile tilapia in Brazil is often divided in three phases: nursery (fingerlings weighing from 0.5 g until 30 g reared in ponds or less commonly, directly in pockets within the cages); growth (with juvenile fish weighing 30 to 100 g held, in general, in small net-cages – 4 to 9 m³); and fattening, when heavier fish are reared in small or big (36 to 100 m³) cages until they reach a final average market weight of 0.8 kg. Although all these phase are important for fish development, the growth phase appears to be a key point in fish production, as at that time the stock density will be defined.
Tilapia production in net-cages is characterized by the ability to intensify production, subjecting the fish to high stocking densities (between 25 to 150kg/m³) while in traditional systems with ponds, it rarely exceeds 3 kg/m³. However, stress can affect growth performance in fish subjected to higher densities (Sanches, 2013). Thus, the determination of optimal stocking density becomes essential to optimize both relative production costs to invested capital and to avoid
production losses resulting from stress (Barreto, 2011).
The aim of this study was to evaluate different fish stock densities with juvenile tilapia in net-cages and its influence on the metabolic stress on growth performance and their relationship.
MATERIAL AND METHODS
This study was approved by the Ethics Committee for Animal Use (CEUA/UnB nº 52708/2013). Juvenile Nile tilapia (O. niloticus)
Chitralada strain, males (98%) with 30g (±7.15g) of initial average weight, were reared in net-cages located in Chavantes reservoir at Fortuna, SP, Brazil. Fish (n = 37,800) were distributed in 12 net-cages (3 x 2 x 1.7 m, with 20 cm of free edge) of 9m³ for 74 days in a completely randomized design to test three different stocking densities (250, 350 and 450 fish/m³) with four replicas in each density. Net-cages were covered with a top to avoid bird attacks or fish escape and were made in aluminum with 10 mm mesh, covered by high adherent polyvinyl chloride. The feedbag made in textile material had a 4 mm mesh. The net-cages were aligned in a single line, transverse to the flow of the water in a reservoir with 12 meters of average depth. The fish were fed three times a day with commercial floating feed (chemical composition in Table 1) specific for juvenile tilapia with 2.5 mm pellets size. Fish were fed until fully satisfied and the quantity consumed in each meal was registered. The daily feed regimen was in basis of a percentage of mean biomass in each cage, beginning in 6%/day and ending in 4%/day, and adjusted according to weight of samples.
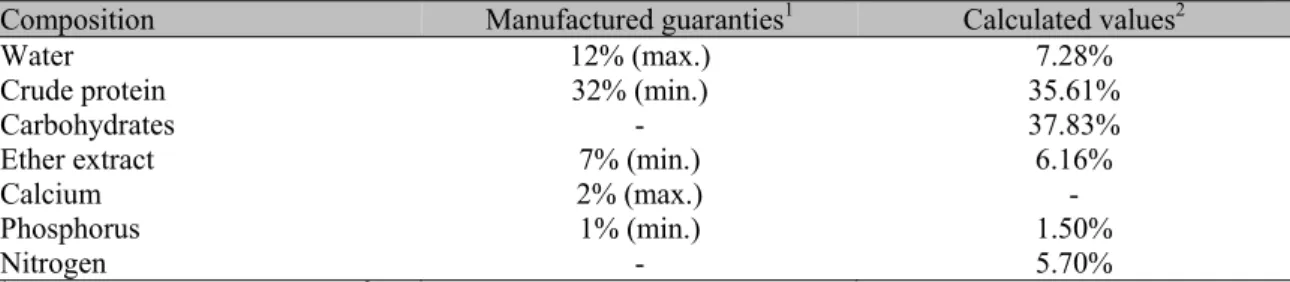
Table 1. Food chemical composition used during the experiment for feed Nile tilapia (Oreochromis niloticus) reared at three stocking densities for 74 days
Composition Manufactured guaranties1 Calculated values2
Water 12% (max.) 7.28%
Crude protein 32% (min.) 35.61%
Carbohydrates - 37.83%
Ether extract 7% (min.) 6.16%
Calcium 2% (max.) -
Phosphorus 1% (min.) 1.50%
Nitrogen - 5.70%
1Values as reported in feed label. 2Feed analysis according to AOAC (2010). Official… (2010).
Fish sample (days 0, 35 and 74) were performed randomly with 4 fishes from each net-cage for weight (± 0.01 g) and standard length (± 0.01
gain (DWG), final biomass per net-cage (FB), yield (kg/m³) and feed conversion ratio (FCR) from each treatment were calculated based on the weight values and the amount of feed in the diet by the following formulas: WG = final weight – initial weight; DWG = WG/74; FB = Final weight x amount of fish; Yield = FB/9; FCR = Quantity of feed/WG.
At each sampling date, four fish from each net-cage were also sampled for blood to measure for serum cortisol and plasma glucose. Fish blood was obtained by puncturing the brachial vein, with a 3 mL syringe and needle soaked in a 25 mm of EDTA 3%. Blood plasma glucose was measured using digital glucose AccuChec Active (ref. 228835, Roche®). For cortisol concentration
measurements, blood was centrifuged at 11,000 rpm for two minutes and the supernatant was removed and stored at -20 ºC until analysis. The serum cortisol concentration was measured by ELISA (Enzyme Linked Immunosorbent Assay) using Direct ELISA kit (ref. CAN-C-270, DBC®).
Water samples (at 50 cm depth) were collected at four points next to the net-cages on the same days for fish sample to assess the physical-chemical water quality. Water temperature (°C) was measured using a digital thermometer and dissolved oxygen (mg/L), un-ionized ammonia (mg/L) and pH were measured by a commercial kit for chemical water analysis (ALFAKIT®;
Alpha Techno Chemistry Company,
Florianópolis/SC, Brazil).
Data analysis was performed using the Statistical Analysis System (Statistical..., 2011). Animal production and blood data were subjected to analysis of variance (ANOVA) with subsequent means comparison by Tukey test at 5% significance. To determine the correlation between blood and animal production results, correlation test was performed using the PROC CORR. For survival test, PROC LIFETEST was performed.
RESULTS AND DISCUSSION
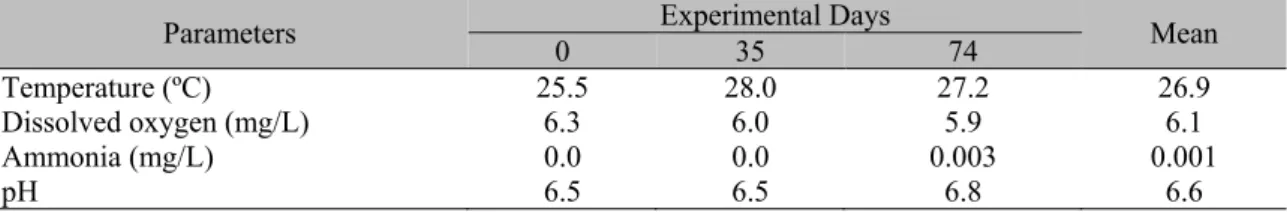
Water quality condition (Tab. 2) were within acceptable ranges for tilapia (Watanabe et al.,
2003).
An increase in stock density from 250 fish/m³ to 350 fish/m³ resulted in a decrease of 68.2% in fish final weight, and 56.0% at the density of 450 fish/m³. Difference (P<0.0001) was observed
between lower density and the other two densities tested, but there was no difference in final weight between 350 fish/m³ and 450 fish/m³ (Table 3). Maeda et al. (2010) also observed a
reduction (33.39%) on the final weight of fish with increasing stocking density from 700 to 1000 fish/m³ of fingerlings of O. niloticus and
Marengoni (2006) found a decrease of 10.92% in the final weight of tilapia when the density increased from 250 to 400 fish/m³ for 135 days. In this context, the lowest growth of fish, grown under high stocking densities may be due to a simple physical limitation in space or due to physiological stress reactions experienced by fish in poor conditions (North et al., 2006).
Table 2. Physical-chemical water composition measured for Nile tilapia (Oreochromis niloticus) reared at
three stocking densities for 74 days
Parameters 0 Experimental Days 35 74 Mean
Temperature (ºC) 25.5 28.0 27.2 26.9
Dissolved oxygen (mg/L) 6.3 6.0 5.9 6.1
Ammonia (mg/L) 0.0 0.0 0.003 0.001
pH 6.5 6.5 6.8 6.6
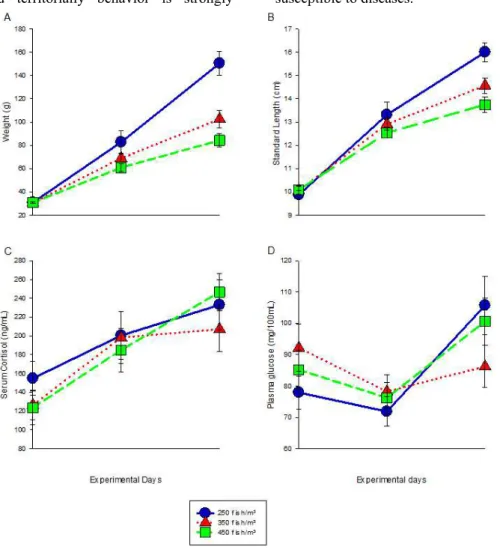
Stock density of 250 fish/m³ achieved a higher weight gain (Figure 1A), 66% more than in the other two treatments, and daily weight gain 67% over the other two treatments (Table 3). Compared to standard length - SL (Figure 1B), treatment with 250 fish/m³ and 350 fish/m³ were higher than treatment with 450 fish/m³ (Table 3).
Marengoni (2006) also observed higher values of weight gain and average daily gain in tilapia subjected to lower stocking densities (250 fish/m³) during 135 days. On the other hand, Carneiro et al. (1999) and Sampaio e Braga
respectively. The standard deviation (SD) of weight increased (P =0.0289) over the trial,
showing that with time, some initial variation in weight becomes more magnified. However, there was no significant difference in SD of weight between treatments and no effect of time or treatment was observed in SD of SL. Yousif (2002) indicate that the access to food as major factor generating disparity in weight. Thus, social and territorially behavior is strongly
involved in such phenomena: probably tilapia set up a hierarchy with some dominant fish eating more feed and limiting access to feed by other fish. This often results in three modes in distribution of fish: the dominant group, which consumed a greater portion of the feed and grew faster; those that were able to get some feed and, those with limited access to feed and be undernourished with impaired growth and more susceptible to diseases.
Figure 1. Parameters (means and error bars) measured from Nile tilapia (Oreochromis niloticus) reared at
three stocking densities for 74 days. A) Weight. B) Standard length. C) Serum cortisol. D) Plasma glucose.
According to Yousif (2002), the effect in weight variation could be reduced (but not extinguished) with increased feed frequency (perhaps, increases in feed frequency can increase the opportunities for smaller ones to reach food) or by increased water exchange rates. In his experiment, Yousif (2002) described that at each
feeding period, smaller fish in all treatments were actively feeding without being seriously disturbed by larger and, in accordance to Piper et al. (1992), stated that in any fish population there
regardless of opportunities given them to grow faster.
In many species, this type of dominance can be reduced by increasing the stock rate as seen in works with rainbow trout (North et al., 2006) and
African catfish (Hengsawat et al., 1997). These
results can be explained by the hypothesis supported by Ellis et al. (2002) that a high
density condition does not always result in increased fish stress: territorially, fish can reduce its own competitiveness assuming less injurious threat signals when submitted to great densities in stocking, as aggressive behaviors demand high energy cost and sometimes (depending on density) are ineffective. In our experiment design, fish were not submitted to a high stock density, therefore it was not possible to see this effect (reduction on variance as stock density increases).
Treatment with lower density presented the best FCR, which is 56% better than treatment with higher density (Tab. 3). The values found are similar to those recommended by Ono e Kubitza (1999) for tilapia in net-cages (1.4 to 1.8) and the observed difference between treatments is
possibly due to increased competition for food caused by overcrowding in treatment with higher density compared to others. High feed conversion implies higher cost of production, since the feed represents 50-70% of total production costs (Jolly e Clonts, 1993). Marengoni (2006) also found increased (12%) feed conversion in tilapia confined to 400 fish/m³ when compared with those in a density of 250 fish/m³.
Mean biomass values at the end of the experiment were similar (Tab. 3). Sampaio e Braga (2005) observed no influence of stocking density on biomass and showed that, despite the decrease of performance of individual fish, the total weight of each net-cage was not affected with the increase in fish density, which, for the producer, is an interesting data for decision making regarding the increment of its stock density during production. Maeda et al. (2006; 2010) found a positive correlation between the stocking density increase and final biomass. Carro-Anzalotta e McGinty (1986) observed inhibitory effects at high densities (500, 750 and 1000 fish/m³) on the final O. niloticus biomass
maintained for 169 days in net-cages.
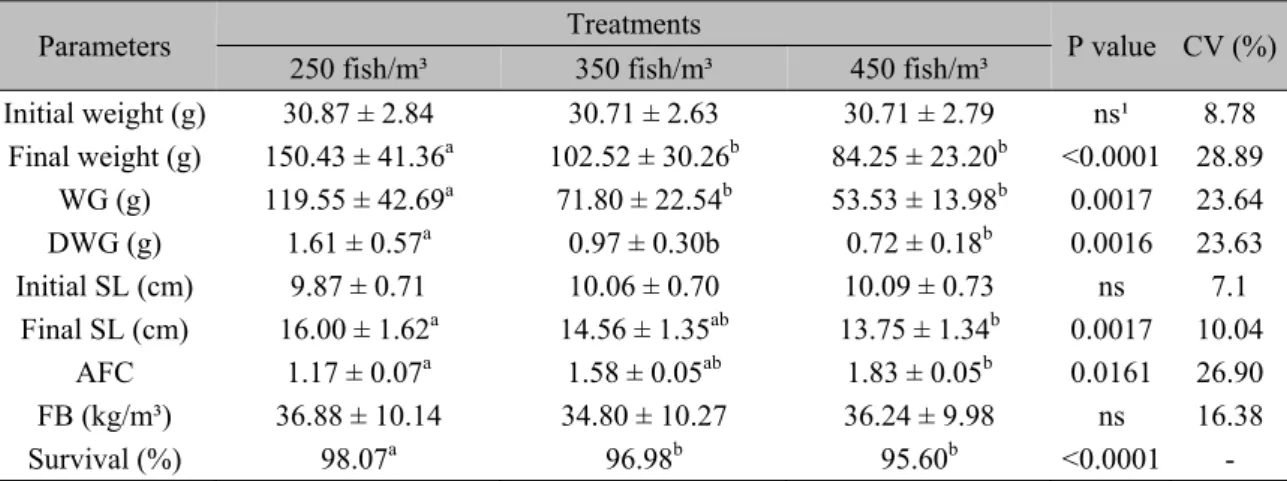
Table 3. Juvenile Nile tilapia (Oreochromis niloticus) performance under three stocking densities for 74
days in net-cages
Parameters Treatments P value CV (%)
250 fish/m³ 350 fish/m³ 450 fish/m³
Initial weight (g) 30.87 ± 2.84 30.71 ± 2.63 30.71 ± 2.79 ns¹ 8.78
Final weight (g) 150.43 ± 41.36a 102.52 ± 30.26b 84.25 ± 23.20b <0.0001 28.89
WG (g) 119.55 ± 42.69a 71.80 ± 22.54b 53.53 ± 13.98b 0.0017 23.64
DWG (g) 1.61 ± 0.57a 0.97 ± 0.30b 0.72 ± 0.18b 0.0016 23.63
Initial SL (cm) 9.87 ± 0.71 10.06 ± 0.70 10.09 ± 0.73 ns 7.1
Final SL (cm) 16.00 ± 1.62a 14.56 ± 1.35ab 13.75 ± 1.34b 0.0017 10.04
AFC 1.17 ± 0.07a 1.58 ± 0.05ab 1.83 ± 0.05b 0.0161 26.90
FB (kg/m³) 36.88 ± 10.14 34.80 ± 10.27 36.24 ± 9.98 ns 16.38
Survival (%) 98.07a 96.98b 95.60b <0.0001 -
1Not significant. Means with different letters (a,b,c) in the same row differ statistically according to Tukey test
(P<0.05). CV - coefficient of variation; WG - weight gain; DWG - daily weight gain; SL - standard-length; AFC - apparent feed conversion; FB - final biomass.
Survival ranged from 95.6 to 98.07%, which are the recommended values (above 95%) for stocking juvenile Oreochromis sp. in net-cages
(McGinty et al., 1989). Lower stocking density
resulted in the highest (P<0.0001) survival rate
(98.07%) when compared to higher densities
survival in all tanks was above 99.0% (P <0.05),
similar to results obtained by Marengoni (2006) (98.27 to 99.06%). However, we observed an increase in mortality from the 50th day which
may have been caused by increased biomass and fish stress due to a reduction swimming space.
Serum cortisol concentrations presented no statistical difference among treatments (Tab. 4) and with an average between 123.64 and 246.65 ng/mL, close to levels reported by Pickering e
Pottinger (1989) for fish in post-conflict stress (200 ng/mL) and superior to those described by Foo e Lam (1993) (64-119 ng/mL) in
Oreochromis sp. subjected to overcrowded
environment. Thus, regardless of population density studied, there was physiological stress in tilapia, probably due to the confinement in net-cages. Correa et al. (2003) reported no difference
in cortisol levels between dominant and subordinate fish, suggesting that the competitive environment can be stressful for both.
Table 4. Serum cortisol concentration (ng/mL) during experiment with Nile tilapia (Oreochromis niloticus) reared at three stocking densities for 74 days.
Treatments 0 Experimental Days 35 74
250 fish/m³ 123.65a 184.91b 246.65c
350 fish/m³ 126.50a 198.16b 207.17b
450 fish/m³ 154.84a 194.72b 232.96c
Means in the same row followed by different letters (a,b,c) represent significant differences (P<0.05) by Tukey test.
Cortisol levels increased with respect to time for all treatments (Fig. 1C) which demonstrate the occurrence of chronic stress, since the fish body that could not overcome, increased due to the increase of biomass in the course of the experiment. In addition, the range of concentrations of corticosteroid in the blood of fish may reflect the duration of the stressor (Pickering e Pottinger, 1989).
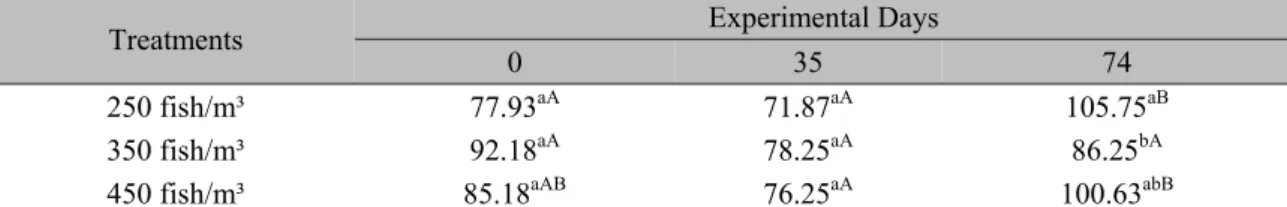
Blood glucose concentrations ranged between 71.87 and 105.75 mg/100mL (Tab. 5) and are in line with the values observed by Barreto e Volpato (2006) but above the basal concentration saw to fish (<60 mg/100mL) by Vijayan et al.
(1997).
Table 5. Blood glucose concentration (mg/100mL) during experiment with Nile tilapia (Oreochromis niloticus) reared at three stocking densities for 74 days.
Treatments Experimental Days
0 35 74
250 fish/m³ 77.93aA 71.87aA 105.75aB
350 fish/m³ 92.18aA 78.25aA 86.25bA
450 fish/m³ 85.18aAB 76.25aA 100.63abB
Means in the same column followed by different lower case letters (a,b) or means in the same row followed by different upper case letters (A, B) represent significant differences (P<0.05) by Tukey test.
Blood glucose levels decreased during the first half of the experiment (35 days) in all treatments and then rose again at the end of the 74 days (Fig. 1D). These results indicate physiological stress in fish and may possibly set the high initial blood glucose levels due to an increase of catecholamines in response to an acute stress (Vijayan et al., 1991). Following the cessation of
the acute nature of stress, blood glucose decreased but increased again at the end of the period possibly due to the high concentration of serum cortisol generating gluconeogenesis in
cases of chronic stress in fish (Vijayan et al.,
1991). According to Vijayan and Moon (1994), catecholamines are involved in the immediate production of glucose after stress through glycogenolysis, whereas cortisol is important for long term regulation of glucose by gluconeogenesis in fish. Gluconeogenesis can harm fish carcass quality in reducing and altering the pH of the deposition of lipids (Zhang et al.,
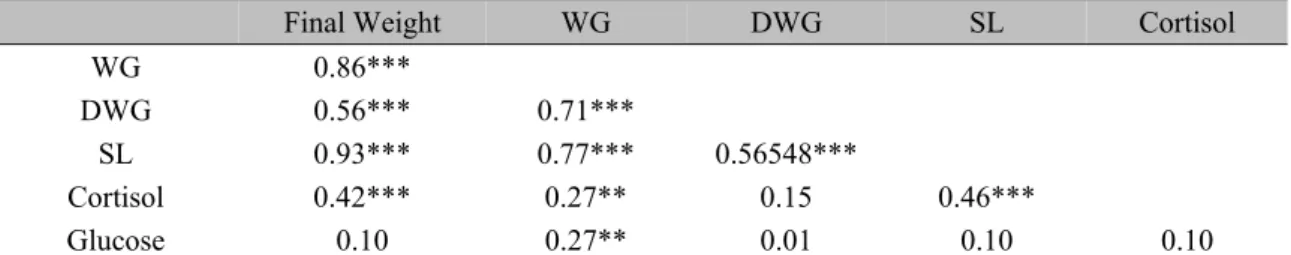
No correlation between blood glucose and cortisol or between glycaemia and weight parameters, standard length, weight gain and average daily gain was observed. In the same way, there was also no correlation between
cortisol and weight gain and daily weight gain. However, there was a high correlation (P<0.001)
between the values of cortisol and weight, and cortisol and standard length (Tab. 6).
Table 6. Correlation between cortisol, glucose and performance parameters in Nile tilapia (Oreochromis niloticus) reared at three stocking densities for 74 days.
Final Weight WG DWG SL Cortisol
WG 0.86***
DWG 0.56*** 0.71***
SL 0.93*** 0.77*** 0.56548***
Cortisol 0.42*** 0.27** 0.15 0.46***
Glucose 0.10 0.27** 0.01 0.10 0.10
*** P <0.0001; ** P <0.01; WG-weight gain; DWG-daily weight gain; SL-Standard length.
Serum cortisol concentrations did not show significant difference. Thus, the observed correlations between cortisol and final weight and between SL and cortisol may be related to the growth period, independent of treatment. Therefore, although (Foo e Lam (1993)) using corticosteroids in fish demonstrated a negative influence on performance, in this experiment this was not observed. Barton e Iwama (1991) pointed the difficulty to conclude that the observed reductions in growth of fish reared in higher densities are the result of metabolic stress, since there are several other factors involved, such as competition for food, behavioral interactions, space limitations or the direct effect of hormone levels, metabolic enzymes and body metabolism. All of these factors must be taken in account when choose the better stock density for rear fish.
CONCLUSIONS
The lowest density (250 fish/m³) showed the best growth performance, being more suitable for growing juvenile tilapia in net-cages. All treatments showed increases in serum cortisol and blood glucose concentration when compared with reference values, demonstrating that crowding in net-cages is a stressful factor to juvenile tilapia. However, it was not possible to conclude that the observed reduction in fish growth was a direct result of metabolic stress due to higher fish density. More studies are needed to evaluate other parameters such as hematology, leukocyte count, biochemical (glycogen) and cell growth expression (IGF) in fish and the
development of other methodologies for assessing fish welfare in systems with high stocking density.
ACKNOWLEDGEMENTS
To CNPq and INCT-Pecuária (CNPq/MCT) for financing and scholarships. To Mr. Mauro Nakata from Piscicultura Cristalina for his support. Authors declare no conflict of interest.
REFERENCES
BARRETO, R.E.; VOLPATO, G.L. Ventilatory frequency of Nile tilapia subjected to different stressors. J. Exp. Anim. Sci., v.43, p.189-196,
2006.
BARRETO, T.N. Efeito da homogeneidade de tamanho sobre o comportamento agressivo e o estresse social na tilápia-do-nilo (Oreocromis niloticus), linhagem tailandesa. 2011. 38f.
Dissertação (Mestrado em Biologia Animal) - Instituto de Biociências, Letras e Ciências Exatas da Universidade Estadual Paulista Júlio de Mesquita Filho, São José do Rio Preto, SP. BARTON, B.A.; IWAMA, G.K. Physiological changes in fish from stress in aquaculture with emphasis on the responses and effects of corticosteroids. Annu. Rev. Fish Dis., v.1, p.3-16,
1991.
BUENO, G.W.; Ostrensky, A.; Canzi, C. et al.
Implementation of aquaculture parks in Federal Government waters in Brazil. Rev. Aquac., v.7,
CARNEIRO, P.C.F.; CYRINO, J.E.P.; CASTAGNOLLI, N. Produção da tilápia vermelha da Flórida em tanques-rede. Sci. Agric.,
v.56, p.6, 1999.
CORREA, S.A.; FERNANDES, M.O.; ISEKI, K.K.; NEGRAO, J.A. Effect of the establishment of dominance relationships on cortisol and other metabolic parameters in Nile tilapia (Oreochromis niloticus). Brazilian journal of medical and biological research. Rev. Bras. Pesqui. Med. Biol., v.36, p.1725-1731, 2003.
CARRO-ANZALOTTA, A.E.; MCGINTY, A.S. Effects of stocking density on growth of tilapia nilotica cultured in cages in ponds. J. World Aquac. Soc., v.17, p.6, 1986.
ELLIS, T.; NORTH, B.; SCOTH, A.P. et al. The
relationships between stocking density and welfare in farmed rainbow trout. J. Fish Biol.,
v.61, p.493-531, 2002.
FOO, J.T.W.; LAM, T.J. Serum cortisol response to handling stress and the effect of cortisol implantation on testosterone level in the tilapia, Oreochromis-mossambicus. Aquaculture, v.115,
p.145-158, 1993.
GARCIA, F.; ROMERA, D.M.; GOZI, K.S. et al. Stocking density of Nile tilapia in cages
placed in a hydroelectric reservoir. Aquaculture,
v.410, p.51-56, 2013.
HENGSAWAT, K.; WARD, F.J.;
JARURATJAMORN, P. The effect of stocking density on yield, growth and mortality of African catfish (Clarias gariepinus Burchell 1822) cultured in cages. Aquaculture, v.152, p.67-76,
1997.
JOLLY, C.M.; CLONTS, H.A. Economics of aquaculture. Binghamton: Haworth Press, 1993.
319p.
MAEDA, H.; SILVA, P.C.; OLIVEIRA, R.P.C.
et al. Densidade de estocagem na alevinagem de
tilápia-do-nilo em tanque-rede. Ciênc. Anim. Bras., v.11, p.471-476, 2010.
MAEDA, H.; SILVA, P.C.; AGUIAR, M.S. et al. Efeito da densidade de estocagem na segunda
alevinagem de tilápia nilótica (Oreochromis niloticus), em sistema raceway. Ciênc. Anim. Bras. v.7, p.8, 2006.
MARENGONI, N.G. Produção de tilápia do nilo Oreochromis niloticus (linhagem chitralada), cultivada em tanques-rede, sob diferentes densidades de estocagem. Arch. Zootec., v.55,
p.127-138, 2006.
McGINTY, A.S.; RAKOCY, J.; BRUNSON, M.W. Cage culture of tilapia. Southern Regional Aquaculture Center, SRAC Publication No. 281, 1989.
NORTH, B.P. et al. The impact of stocking
density on the welfare of rainbow trout (Oncorhynchus mykiss). Aquaculture, v.255,
p.466-479, 2006.
AOAC - Association of Official Analytical
Chemists. Official methods of
analysis.Washington: AOAC, 2010.
ONO, E.A.; KUBITZA, F. Cultivo de peixes em tanques-rede. 2ª ed. Jundiaí: F. Kubitza, 68p. 1999.
PICKERING, A.D.; POTTINGER, T.G. Stress responses and disease resistance in salmonid fish: effects of chronic elevation of plasma cortisol. Fish Physiol. Biochem. v.7, p.253-258,
1989.
PIPER, R.G. et al. Fish hatchery management.
Whashington: Department of the interior Fish and Wildlife Service, 1992. 544p.
SAMPAIO, J.M.C.; BRAGA, L.G.T. Cultivo de tilápia em tanques-rede na barragem do Ribeirão de Saloméa – Floresta Azul – Bahia. Rev. Bras. Saúde Prod. Anim., v.6, p.42-52, 2005.
SANCHES, F.H.C. Resposta de estresse à substância de alarme na tilápia-do-nilo. 2013.
28f. Dissertação (Mestrado em Zologia) - Instituto de Biociências de Botucatu, Universidade Estadual Paulista, Botucatu, SP. STATISTICAL analysis system. Version 9.3. Cary: SAS Institute, 2011.
TUNDISI, J.G.; TUNDISI, T.M. Impactos potenciais das alterações do Código Florestal nos recursos hídricos. Biota Neotrop., v.10, p.67-76,
2010.
VIJAYAN, M.M.; BALLANTYNE, J.S.; LEATHERLAND, J.F. Cortisol-induced changes in some aspects of the intermediary metabolism of salvelinus-fontinalis. Gen. Comp. Endocr.,
VIJAYAN, M.M.; MOON, T.W. The stress-response and the plasma disappearance of corticosteroid and glucose in a marine teleost, the Sea Raven. Can. J. Zool., v.72, p.379-386, 1994.
VIJAYAN, M.M.; PEREIRA, C.; GRAU, E.G.; IWAMA, G.K. Metabolic responses associated with confinement stress in tilapia: the role of cortisol. Comp. Biochem. Phys parte C:
Pharmacol., Toxicol. Endocrinol., v.116,
p.89-95, 1997.
WATANABE, W.O.; LOSORDO, T.M.; FITZSIMMONS, K.; HANLE, Y.F. Tilápia production system in the americas: tecnological advances, trends, and challenges. Rev. Fish. Sci.,
v.10, p.3, 2003.
YOUSIF, O.M. The effects of stocking density, water exchange rate, feeding frequency and grading on size hierarchy development in juvenile Nile tilapia, Oreochromis niloticus L.
Emir. J. Food Agric., v.14, p.45-53, 2002.
ZHANG, C.X.; MAI, K.; AI, Q. et al. Dietary
phosphorus requirement of juvenile Japanese seabass, Lateolabrax japonicus. Aquaculture,