1
Vol.59: e16999982, January-December 2016 http://dx.doi.org/10.1590/1678-4324-errata-2016999982
ISSN 1678-4324 Online Edition
BRAZILIAN ARCHIVES OF BIOLOGY AND TECHNOLOGY
A N I N T E R N A T I O N A L J O U R N A L
Erratum
In Article
“
Chemical quality of bottled mineral waters from markets of
Curitiba-PR-Brazil
”
, with the number of DOI: http://dx.doi.org/10.1590/1678-4324-2016160111,
published in journal Brazilian Archives of Biology and Technology, vol. 59, the 01 page.
That read:
“Éde
r José dos Santos
1*,Dasio Roberto de Oliveira Junior
1, Amanda Beatriz
Hermann
1,Ralph Edwatd Sturgeon
2.
1 Instituto de Tecnologia do Paraná – TECPAR – Centro de Tecnologia em Saúde e Meio Ambiente, Curitiba, Paraná, Brasil; 2Measurement Science and Standards, NationalResearchCouncil Canada, Ottawa, Canada.”
Read:
“Éder José dos Santos
1*, Dasio Roberto de Oliveira Junior
1, Amanda Beatriz
Hermann
1, Ralph Edward Sturgeon
2.
1 Instituto de Tecnologia do Paraná – TECPAR – Centro de Tecnologia em Saúde e Meio Ambiente, Curitiba, Paraná, Brasil; 2Measurement Science and Standards, National Research Council Canada, Ottawa, Canada.”
In Article “
Chemical quality of bottled mineral waters from markets of
Curitiba-PR-Brazil
”
, with the number of DOI: http://dx.doi.org/10.1590/1678-4324-2016160111,
published in journal Brazilian Archives of Biology and Technology, vol. 59, the 02 page.
That read:
“In Brazil, in accordance with RDC Resolution No. 274/2005 of the Ministry of Health, mineral
water is “water obtaineddirectly fromnaturalorgroundwater extractionsources”. Concern overthe
qualityof mineral wateron the marketis highlightedin several articles devoted to this subject.Ikem et al. investigated the chemical quality of twenty-five bottled waters from cities in the state of Alabama, USA, through a one-wayparametricanalysisof variance(ANOVA) and showed thatseveralsamplesavailable on the markethadphysical-chemical parameters (pH and conductivity) as well as essential and non-essential elements exceeding the EU and US EPA drinking water standards (Ikem et al., 2002).”
Read:
“In Brazil, in accordance with RDC Resolution No. 274/2005 of the Ministry of Health, mineral
water is “water obtained directly from natural or ground water extraction sources”. Concern over
In Article “
Chemical quality of bottled mineral waters from markets of
Curitiba-PR-Brazil
”
, with the number of DOI: http://dx.doi.org/10.1590/1678-4324-2016160111,
published in journal Brazilian Archives of Biology and Technology, vol. 59, the 02 page.
That read:
“
In these studies, the concentrations ofinorganicions as well as parameterssuch aspH, electrolyticconductivity and inorganicand total organiccarbon were determined. For thispurpose, the main analytical techniques employed were ion chromatography (IC), inductively coupled plasma optical emission spectrometry (ICP OES) and inductively coupled plasma mass spectrometry (ICP-MS). In Brazil, studies have also highlightedconcern over thequality and compositionof bottled mineral waters available on the market. Godoy et al. investigated the natural radionuclides 228Ra, 226Ra and 210Pb in Brazilian bottled mineral waters (Godoy et al., 2001).”
Read:
“
In these studies, the concentrations of inorganicions as well as parameters such asp H, electrolytic conductivity and inorganic and total organic carbon were determined. For this purpose, the main analytical techniques employed were ion chromatography (IC), inductively coupled plasma optical emission spectrometry (ICP OES) and inductively coupled plasma mass spectrometry (ICP-MS). In Brazil, studies have also highlighted concern over the quality and composition of bottled mineral waters available on the market. Godoy et al. investigated the natural radionuclides 228Ra, 226Ra and 210Pb in Brazilian bottled mineral waters (Godoy et al., 2001).”
In Article “
Chemical quality of bottled mineral waters from markets of
Curitiba-PR-Brazil
”
, with the number of DOI: http://dx.doi.org/10.1590/1678-4324-2016160111,
published in journal Brazilian Archives of Biology and Technology, vol. 59, the 03 page.
That read:
Table 1. ICP OES, CVG-ICP OES and ICP-MS instrumental parameters.
ICP OES CVG-ICP OES ICP-MS
Radiofrequency 40 MHz 40 MHz 27.12 MHz
Forward power 1.25 kW 1.2 kW 1.4 kW
Plasma gasflow rate 15.0 L min-1 15.0 L min-1 18.0 L min-1
Auxiliarygasflow rate 1.5 L min-1 1.5 L min-1 1.8 L min-1
Sheathgasflow --- --- 0.21 L min-1
Carrier gas flow rate --- 120 mL min-1 ---
Nebulizerpressure 180 kPa --- ---
Nebulizertype Concentricglass K --- ---
Spray chamber Standard Axial Varian Standard Axial Varian ---
Replicateread time 15 s with 4 replicates 15 s with 4 replicates 20 s with 8 replicates Torchtype 1.8 mm I.D. alumina injector tube Quartz for axial view Quartz
NaBH4 concentration --- 0.3 % (m/v) in 0.4%, m/v, NaOH ---
HCl concentration --- 5 mol L-1 ---
Analytical lines /
isotopes (ICP-MS) Al: 396.152 nm, Ba: 455.403 nm, Cd: 214.439 nm, Cr: 267.716 nm, Cu: 327.395 nm; Fe: 238.204 nm, Li: 610.365 nm, Mn: 257.610 nm, Ni:231.604 nm, Sr: 421.552 nm, V: 292.401 nm, Zn: 213.857 nm
Hg: 252.652 nm
75As, 121Sb, 206,207,208Pb
and78Se
Collisionalgas CRI --- --- H2 (78Se)
Internal standard --- --- 89Y, 115In
Read:
Table 1. ICP OES, CVG-ICP OES and ICP-MS instrumental parameters.
ICP OES CVG-ICP OES ICP-MS
Forward power 1.25 kW 1.2 kW 1.4 kW
Plasma gas flow rate 15.0 L min-1 15.0 L min-1 18.0 L min-1
Auxiliary gas flow rate 1.5 L min-1 1.5 L min-1 1.8 L min-1
Sheath gas flow --- --- 0.21 L min-1
Carrier gas flow rate --- 120 mL min-1 ---
Nebulizer pressure 180 kPa --- ---
Nebulizer type Concentric glass K --- ---
Spray chamber Standard Axial Varian Standard Axial Varian ---
Replicate read time 15 s with 4 replicates 15 s with 4 replicates 20 s with 8 replicates Torch type 1.8 mm I.D. alumina injector tube Quartz for axial view Quartz
NaBH4 concentration --- 0.3 % (m/v) in 0.4%, m/v, NaOH ---
HCl concentration --- 5 mol L-1 ---
Analytical lines / isotopes (ICP-MS)
Al: 396.152 nm, Ba: 455.403 nm, Cd: 214.439 nm, Cr: 267.716 nm, Cu: 327.395 nm; Fe: 238.204 nm, Li: 610.365 nm, Mn: 257.610 nm, Ni:231.604 nm, Sr: 421.552 nm, V: 292.401 nm, Zn: 213.857 nm
Hg: 252.652 nm
75As, 121Sb, 206,207,208Pb
and 78Se
Collisional gas CRI --- --- H2 (78Se)
Internal standard --- --- 89Y, 115In
In Article “
Chemical quality of bottled mineral waters from markets of
Curitiba-PR-Brazil
”
, with the number of DOI: http://dx.doi.org/10.1590/1678-4324-2016160111,
published in journal Brazilian Archives of Biology and Technology, vol. 59, the 03 page.
That read:
“
Reagents and samples: All chemicals were of analytical grade, unless otherwise specified.High--ionized in a Milli-Q system (Bedford, MA, USA). The following Merck reagents (Darmstadt, Germany) were used: NaBH4 to prepare a 0.3 % m/v solution in NaOH; 65% v/v HNO3suprapur® ; 37% v/v HCl from which a 5 mol L-1 solution was prepared. Buffer solutions for pH 4.00 and pH 7.00 were supplied by Êxodo (Hortolândia, Brasil). -1 of Al, As, Hg, In, K+, Mn, Na+, Pb, Se,
Sb, Sr, V, Y, Zn, Cl-, NO
2- and NH4+were obtained from AccuStandard (New Haven, USA); those for Ba, Cd, Cr, Ca2+, Cu, Fe, Li, Mg2+ and Ni from UltraScientific (North Kingstown, USA), while solutions of F-, NO
3- and SO42- were supplied by FlukaAnalitical (St. Louis, USA). A conductivity
standard of 84 μS cm-1 was obtained from Mettler Toledo. Quality control Certified Reference Materials comprising acidified aqueous solutions containing 100 µg mL-1 As, Sb, Ca, Cd, Cr, Cu, Fe, Li, Mg, Mn, Ni, Pb, Se, Sr, V and Zn (QCS-01-5), 100 µg mL-1 of Al, Ba, K and Na (QCS-02-R1-5) and 20 µg mL-1 of Hg (TCLP-02-1) were obtained from AccuStandard. These served asquality control standards.
”
Read:
“
Reagents and samples: All chemicals were of analytical grade, unless otherwise specified.High-purity water (18.2 MΩ cm resistivity) was de-ionized in a Milli-Q system (Bedford, MA, USA). The following Merck reagents (Darmstadt, Germany) were used: NaBH4 to prepare a 0.3 % m/v solution in NaOH; 65% v/v HNO3 suprapur® ; 37% v/v HCl from which a 5 mol L-1 solution was prepared. Buffer solutions for pH 4.00 and pH 7.00 were supplied by Êxodo (Hortolândia, Brasil). Monoelemental standard solutions containing 1000 µg mL-1 of Al, As, Hg, In, K+, Mn, Na+, Pb, Se, Sb, Sr, V, Y, Zn, Cl-, NO2- and NH4+ were obtained from AccuStandard (New Haven, USA); those for Ba, Cd, Cr, Ca2+, Cu, Fe, Li, Mg2+ and Ni from UltraScientific (North Kingstown, USA), while solutions of F-, NO3- and SO42- were supplied by Fluka Analitical (St. Louis, USA). A conductivity
Fe, Li, Mg, Mn, Ni, Pb, Se, Sr, V and Zn (QCS-01-5), 100 µg mL-1 of Al, Ba, K and Na (QCS-02-R1-5) and 20 µg mL-1 of Hg (TCLP-02-1) were obtained from AccuStandard. These served as quality control standards.
”
In Article “
Chemical quality of bottled mineral waters from markets of
Curitiba-PR-Brazil
”
, with the number of DOI: http://dx.doi.org/10.1590/1678-4324-2016160111,
published in journal Brazilian Archives of Biology and Technology, vol. 59, the 06 page.
That read:
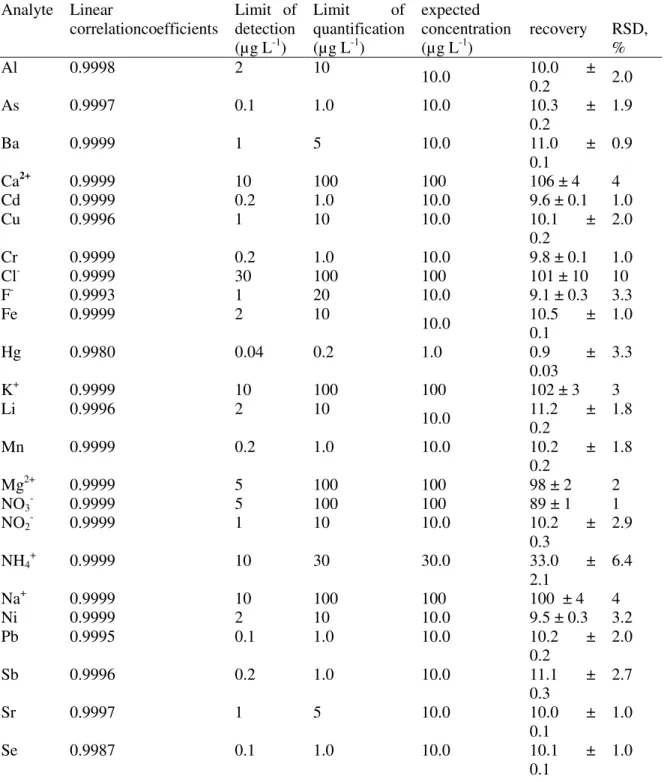
Table 4. Figures of merit and results for analysis of quality control materials and standards (n=7).
Analyte Linear
correlationcoefficients
Limit of detection (µg L-1)
Limit of
quantification (µg L-1)
expected concentration
(µg L-1) recovery RSD, %
Al 0.9998 2 10 10.0 10.0 ±
0.2 2.0
As 0.9997 0.1 1.0 10.0 10.3 ±
0.2
1.9
Ba 0.9999 1 5 10.0 11.0 ±
0.1
0.9
Ca2+ 0.9999 10 100 100 106 ± 4 4
Cd 0.9999 0.2 1.0 10.0 9.6 ± 0.1 1.0
Cu 0.9996 1 10 10.0 10.1 ±
0.2
2.0
Cr 0.9999 0.2 1.0 10.0 9.8 ± 0.1 1.0
Cl- 0.9999 30 100 100 101 ± 10 10
F- 0.9993 1 20 10.0 9.1 ± 0.3 3.3
Fe 0.9999 2 10
10.0 10.5 0.1 ± 1.0
Hg 0.9980 0.04 0.2 1.0 0.9 ±
0.03
3.3
K+ 0.9999 10 100 100 102 ± 3 3
Li 0.9996 2 10
10.0 11.2 0.2 ± 1.8
Mn 0.9999 0.2 1.0 10.0 10.2 ±
0.2
1.8
Mg2+ 0.9999 5 100 100 98 ± 2 2
NO3- 0.9999 5 100 100 89 ± 1 1
NO2- 0.9999 1 10 10.0 10.2 ±
0.3
2.9
NH4+ 0.9999 10 30 30.0 33.0 ±
2.1
6.4
Na+ 0.9999 10 100 100 100 ± 4 4
Ni 0.9999 2 10 10.0 9.5 ± 0.3 3.2
Pb 0.9995 0.1 1.0 10.0 10.2 ±
0.2
2.0
Sb 0.9996 0.2 1.0 10.0 11.1 ±
0.3
2.7
Sr 0.9997 1 5 10.0 10.0 ±
0.1
1.0
Se 0.9987 0.1 1.0 10.0 10.1 ±
0.1
SO42- 0.9999 10 100 100 98 ± 2 2.0
V 0.9999 2 10 10.0 9.0 ± 0.1 1.1
Zn 0.9999 2 10 10.0 9.6 ± 0.3 3.1
Read:
Table 4. Figures of merit and results for analysis of quality control materials and standards (n=7).
Analyte Linear correlation coefficients
Limit of detection (µg L-1)
Limit of
quantification (µg L-1)
expected concentration
(µg L-1) recovery RSD, %
Al 0.9998 2 10 10.0 10.0 ± 0.2 2.0
As 0.9997 0.1 1.0 10.0 10.3 ± 0.2 1.9
Ba 0.9999 1 5 10.0 11.0 ± 0.1 0.9
Ca2+ 0.9999 10 100 100 106 ± 4 4
Cd 0.9999 0.2 1.0 10.0 9.6 ± 0.1 1.0
Cu 0.9996 1 10 10.0 10.1 ± 0.2 2.0
Cr 0.9999 0.2 1.0 10.0 9.8 ± 0.1 1.0
Cl- 0.9999 30 100 100 101 ± 10 10
F- 0.9993 1 20 10.0 9.1 ± 0.3 3.3
Fe 0.9999 2 10 10.0 10.5 ± 0.1 1.0
Hg 0.9980 0.04 0.2 1.0 0.9 ± 0.03 3.3
K+ 0.9999 10 100 100 102 ± 3 3
Li 0.9996 2 10 10.0 11.2 ± 0.2 1.8
Mn 0.9999 0.2 1.0 10.0 10.2 ± 0.2 1.8
Mg2+ 0.9999 5 100 100 98 ± 2 2
NO3- 0.9999 5 100 100 89 ± 1 1
NO2- 0.9999 1 10 10.0 10.2 ± 0.3 2.9
NH4+ 0.9999 10 30 30.0 33.0 ± 2.1 6.4
Na+ 0.9999 10 100 100 100 ± 4 4
Ni 0.9999 2 10 10.0 9.5 ± 0.3 3.2
Pb 0.9995 0.1 1.0 10.0 10.2 ± 0.2 2.0
Sb 0.9996 0.2 1.0 10.0 11.1 ± 0.3 2.7
Sr 0.9997 1 5 10.0 10.0 ± 0.1 1.0
Se 0.9987 0.1 1.0 10.0 10.1 ± 0.1 1.0
SO42- 0.9999 10 100 100 98 ± 2 2.0
V 0.9999 2 10 10.0 9.0 ± 0.1 1.1
Zn 0.9999 2 10 10.0 9.6 ± 0.3 3.1
In Article “
Chemical quality of bottled mineral waters from markets of
Curitiba-PR-Brazil
”
, with the number of DOI: http://dx.doi.org/10.1590/1678-4324-2016160111,
published in journal Brazilian Archives of Biology and Technology, vol. 59, the 06 page.
That read:
“
Tables 5 and 6 summarize results obtained characterizing the twenty-seven commercial samples purchased for this study. The presence of NH4+ and NO2- are indicative of microbiological contamination. The concentration of NH4+ was below the limit of quantification but for NO2 -samples 14, 19 and 21 (0.01 mg L-1) concentrations nearthemaximum limit setby Brazilian legislation were evident whereas that for sample 16 (0.04 mg L-1) exceeded the maximum limit set by RDC N° 274, 2005, i.e., 0.02 mg/L.”
Read:
contamination. The concentration of NH4+ was below the limit of quantification but for NO2 -samples 14, 19 and 21 (0.01 mg L-1) concentrations near the maximum limit set by Brazilian legislation were evident whereas that for sample 16 (0.04 mg L-1) exceeded the maximum limit set by RDC N° 274, 2005, i.e., 0.02 mg/L.
”
In Article “
Chemical quality of bottled mineral waters from markets of
Curitiba-PR-Brazil
”
, with the number of DOI: http://dx.doi.org/10.1590/1678-4324-2016160111,
published in journal Brazilian Archives of Biology and Technology, vol. 59, the 06 page.
That read:
“
Iron is only detected in two imported samples from Italy: 10 μg L-1 (sample 26) and 21 μg L-1 (sample 27), but its concentration is notdeclared on the sample labels.Selenium is present in the range 1.2 - 6.4 μg L-1 (four samples) and V in the range 10 -150 μg L-1 (ten samples). Sample 24, imported from France, and sample 17, from Paraná State, are identified as containing the highest concentrations of Se: 6.4 ± 0.3 μg L-1 and V: 150 ± 5 μg L-1, respectively. According to Brazilian legislation, these samples should also beclassified as mineral waters “seleniada”, i.e., thatcontainselenium at minimum 6 μg L-1 and maximum of 10μg L-1, and “vanadica”, i.e.,that contain vanadium at minimum 30μg L-1 (Portaria DNPM 540, 2014 and RDC N° 274, 2005). However, no statementon the label can be found. With respect to trace element content and potential contaminants, all samplesshould have more information concerning their concentrations.
”
Read:
“
Iron is only detected in two imported samples from Italy: 10 μg L-1 (sample 26) and 21 μg L-1 (sample 27), but its concentration is not declared on the sample labels. Selenium is present in the range 1.2 - 6.4 μg L-1 (four samples) and V in the range 10 -150 μg L-1 (ten samples). Sample 24, imported from France, and sample 17, from Paraná State, are identified as containing the highest concentrations of Se: 6.4 ± 0.3 μg L-1 and V: 150 ± 5 μg L-1, respectively. According to Brazilian legislation, these samples should also be classified as mineral waters “seleniada”, i.e., that conta in selenium at minimum 6 μg L-1 and maximum of 10 μg L-1, and “vanadica”, i.e., that contain vanadium at minimum 30 μg L-1 (Portaria DNPM 540, 2014 and RDC N° 274, 2005). However, no statement on the label can be found. With respect to trace element content and potential contaminants, all samples should have more information concerning their concentrations.”
In Article “
Chemical quality of bottled mineral waters from markets of
Curitiba-PR-Brazil
”
, with the number of DOI: http://dx.doi.org/10.1590/1678-4324-2016160111,
published in journal Brazilian Archives of Biology and Technology, vol. 59, the 07 page.
That read:
Read:
“
Although the physico-chemical parameter pH showed values different from those declared on the labels, as summarized in Table 3, these differences were not significant and in these cases the producers indicate that the values correspond to those characterizing the source of the water. These differences are acceptable since chemical transformations may occur over time that could slightly affect the pH.The pH range varies from mildly acidic (5.53 ± 0.01, sample 23) to slightly alkaline (8.89 ± 0.10, sample 24). Alkalinity due to the presence of CO32- was detected in four samples wherein the reported pH was 8.49 ± 0.01 (sample 14), 8.79 ± 0.03 (sample 17), 8.44 ± 0.05 (sample 19) and 8.89 ± 0.01 (sample 24). Figure 1 shows the correlation between conductivity and total dissolved solids (TDS) parameters which indicates that the higher the sample conductivity, the greater the amount of TDS present. These two parameters are strongly correlated, especially with imported samples 24 (France), 25 (Portugal) and 26 (Italy). Conductivity is in close agreement with declared values except for sample 01 for which a value of 3.7 ± 0.1 μS cm -1 was determinedwhereas 153 μS cm -1 declared, and the producer will require notification.
”
In Article “
Chemical quality of bottled mineral waters from markets of
Curitiba-PR-Brazil
”
, with the number of DOI: http://dx.doi.org/10.1590/1678-4324-2016160111,
published in journal Brazilian Archives of Biology and Technology, vol. 59, the 01 page.
That read:
“
Likewise,thehardnesspresent in the samplecan be correlatedmainlyto the presenceof Ca and Mg. Samples24-26 are again highlighted for their significant values present. The main constituent elements reportedon the sample labels include: HCO3-, F-, Cl-, NO3- , SO42-, Na+ , K+ , Mg2+, Ca2+, Ba, Li and Sr. Principal component analysis (PCA) for the concentrations of these analytes is presented in Figure 2, where PC1 is the first principal component, PC2 is the second and PC3 is the third (Dos Santos et al., 2008, Dos Santos et. al., 2012 and Miller, J. N. and Miller, J. C, 2000). PC1 accounts for 47% of the variance of the data and discriminates samples through the influence of parameters related to HCO3-, F-, Cl-, Ca2+, and Li. PC2 accounts for 17% of the variance of the data and discriminates samples on the basis of SO42-, while PC3 accounts for 12% of the variance of the data and is mainly correlated with the presence of Ba and Sr. Together, 76% of the variability of the original data is thus accounted for. As evident from Figure 2, the samples are clustered in a main group but five are located in differentregions of thegraph. Samples 23 to 26 are imported: 23 and 24 from France, 25 from Portugal and 26 from Italy. Only sample 22 is from Minas Gerais State, Brazil. Is evident that these samples havedifferentphysicochemicalcompositions, being characterized by relatively high concentrations of salts, manly HCO3- and Sr. Legislation does not specify a value for Sr, and the HCO3- ion is an essential component of mineral waters (Decreto-Lei 7841, 1945). These fivesamplesare also rich inF-, providing a classification as “fluoridated mineralwater”, as defined by Brazilian legislation (Portaria DNPM 540, 2014). The concentration of Li is
high in samples 22, 24, 25 and 26, also a characteristic of mineral water in accordance with Brazilian legislation (Portaria DNPM 540, 2014). The concentration of Ba in sample 22 is the highest: 386 ± 5 μg L-1, but below the maximum specified by Brazilian legislation, i.e., 700 µg L-1 (RDC N° 274, 2005). The main cluster comprises the majority of the samples that are bottled in the State of Paraná, with the exception of sample 11 from São Paulo State and sample 27 from Italy. This cluster is characteristic of the presence of NO3-. Nitrate may have either a mineral or microbiological origin. Its determinable concentration ranges from 0.10 mg L-1 - 63.05 mg L-1 while samples 01, 15 and 25 are below the LOQ. Only sample 10 (63.05 mg L-1) is above the maximum specified by Brazilian legislation, i.e., 50 mg/L (RDC N° 274, 2005), but the label states a value of 3.47 mg L-1 (Table 3). The elevated concentration may be indicative of
microbiological contamination which may be harmful tohuman health (Astel et al., 2014). Samples
01, 10 and 21 are classified as “fluoridated mineral water”, according to their labels; however, in
(Portaria DNPM 540, 2014), needed forwaterto beclassified as such. Since the declared valuesare close to the minimum, analytesorptionby the packagingmaterials may have occurred. It is evident that samples 3 and 4 have the same mineral composition. In reality, these samples are from the same region (Apucarana city, State of Paraná), but on the market they have a different identification and no indication that they are from the same producer. In general, it is clear that information declared on the label is different from that arising from analysis of the samples in this work, but it must also be recognized that as the samples are rich in salts, several factors may lead to changes in the composition, however small, including decomposition of HCO3-, sorption of analytes onto the walls of the container material, the time on the market shelf, and proper care during transport and the ambient storage temperature. To make a more qualified analysis of the national samples, a scatter plot based on only national Brazilian samples is presented in Figure 3. Here the PCs account for 73% of the variability of the original data. As in Figure 2, variability in the compositions of samples are evident wherein the difference of mineral content of sample 22 in relation to others is evident. The sample 10 possibly is contaminated and the samples 15 and 17 show F- content and Na+ higher concentrations than others.Clearly, the PCA statistical tool can be very useful for identification
andcomparison ofcompositionsof bottled mineral waters on the market.
”
Read:
“
Likewise, the hardenss present in the sample can be correlated mainly to the presence of Ca and Mg. Samples 24-26 are again highlighted for their significant values present. The main constituent elements reported on the sample labels include: HCO3-, F-, Cl-, NO3- , SO42-, Na+ , K+ , Mg2+, Ca2+, Ba, Li and Sr. Principal component analysis (PCA) for the concentrations of these analytes is presented in Figure 2, where PC1 is the first principal component, PC2 is the second and PC3 is the third (Dos Santos et al., 2008, Dos Santos et. al., 2012 and Miller, J. N. and Miller, J. C, 2000). PC1 accounts for 47% of the variance of the data and discriminates samples through the influence of parameters related to HCO3-, F-, Cl-, Ca2+, and Li. PC2 accounts for 17% of the variance of the data and discriminates samples on the basis of SO42-, while PC3 accounts for 12% of the variance of the data and is mainly correlated with the presence of Ba and Sr. Together, 76% of the variability of the original data is thus accounted for. As evident from Figure 2, the samples are clustered in a main group but five are located in different regions of the graph. Samples 23 to 26 are imported: 23 and 24 from France, 25 from Portugal and 26 from Italy. Only sample 22 is from Minas Gerais State, Brazil. Is evident that these samples have different physicochemical compositions, being characterized by relatively high concentrations of salts, manly HCO3- and Sr. Legislation does not specify a value for Sr, and the HCO3- ion is an essential component of mineral waters (Decreto-Lei 7841, 1945). These five samples are also rich in F-, providing a classification as “fluoridated mineral water”, as defined by Brazilian legislation (Portaria DNPM 540, 2014). The concentration of Li is high in samples 22, 24, 25 and 26, also a characteristic of mineral water in accordance with Brazilian legislation (Portaria DNPM 540, 2014). The concentration of Ba in sample 22 is the highest: 386 ± 5 μg L-1, but below the maximum specified by Brazilian legislation, i.e., 700 µg L-1 (RDC N° 274, 2005). The main cluster comprises the majority of the samples that are bottled in the State of Paraná, with the exception of sample 11 from São Paulo State and sample 27 from Italy. This cluster is characteristic of the presence of NO3-. Nitrate may have either a mineral or microbiological origin. Its determinable concentration ranges from 0.10 mg L-1 - 63.05 mg L-1 while samples 01, 15 and 25 are below the LOQ. Only sample 10 (63.05 mg L-1) is above the maximum specified by Brazilian legislation, i.e., 50 mg/L (RDC N° 274, 2005),but the label states a value of 3.47 mg L-1 (Table 3). The elevated concentration may be indicative of microbiological contamination which may be harmful to human health (Astel et al., 2014). Samples 01, 10 and 21minimum, analyte sorptionby the packaging materials may have occurred. It is evident that samples 3 and 4 have the same mineral composition. In reality, these samples are from the same region (Apucarana city, State of Paraná), but on the market they have a different identification and no indication that they are from the same producer. In general, it is clear that information declared on the label is different from that arising from analysis of the samples in this work, but it must also be recognized that as the samples are rich in salts, several factors may lead to changes in the composition, however small, including decomposition of HCO3-, sorption of analytes onto the walls of the container material, the time on the market shelf, and proper care during transport and the ambient storage temperature. To make a more qualified analysis of the national samples, a scatter plot based on only national Brazilian samples is presented in Figure 3. Here the PCs account for 73% of the variability of the original data. As in Figure 2, variability in the compositions of samples are evident wherein the difference of mineral content of sample 22 in relation to others is evident. The sample 10 possibly is contaminated and the samples 15 and 17 show F- content and Na+ higher concentrations than others. Clearly, the PCA statistical tool can be very useful for identification and comparison of compositionsof bottled mineral waters on the market.
”
In Article “
Chemical quality of bottled mineral waters from markets of
Curitiba-PR-Brazil
”
, with the number of DOI: http://dx.doi.org/10.1590/1678-4324-2016160111,
published in journal Brazilian Archives of Biology and Technology, vol. 59, the 09 page.
That read:
“
nd: notdetected; legislation: Portaria Nº 540 de 18/12/20141,RDC N° 274 de 22/09/20052, Portaria N° 2914 de 12/12/20113.”
Read:
“
nd: not detected; legislation: Portaria Nº 540 de 18/12/20141, RDC N° 274 de 22/09/20052, Portaria N° 2914 de 12/12/20113.”
In Article “
Chemical quality of bottled mineral waters from markets of
Curitiba-PR-Brazil
”
, with the number of DOI: http://dx.doi.org/10.1590/1678-4324-2016160111,
published in journal Brazilian Archives of Biology and Technology, vol. 59, the 06 page.
That read:
“
nd: notdetected; legislation: Portaria Nº 540 de 18/12/20141,RDC N° 274 de 22/09/20052, Portaria N° 2914 de 12/12/20113.”
Read:
“
nd: not detected; legislation: Portaria Nº 540 de 18/12/20141, RDC N° 274 de 22/09/20052, Portaria N° 2914 de 12/12/20113.”
In Article “
Chemical quality of bottled mineral waters from markets of
Curitiba-PR-Brazil
”
, with the number of DOI: http://dx.doi.org/10.1590/1678-4324-2016160111,
published in journal Brazilian Archives of Biology and Technology, vol. 59, the 11 page.
That read:
“
CONCLUSIONS
The present study reveals that, in general, the majority of parameters determined in commercial bottled mineral waters from markets in Curitiba-PR-Brazil are below limits specified by Brazilian legislation. Only one sample was detected as having a high concentration of NO3-, indicating microbiological contamination; some results for NO2- may also reflect the same contamination. Improvements in monitoring throughout the process of filling and points of sale of the samples, with the aim of securing the microbiological quality of bottled mineral waterssold in the region under study may be needed. The comparison of labelled composition to analytical results highlights a difference for mostelements, but it should be noted that intrinsic instabilityas well asother factors such assorption of components onto container surfaces as well as the length of time spent on the shelf, care during transport, and the ambient storage temperature may alter the composition; perhaps
a “best before date” could eliminate such discrepancies. In such cases,a furtherstudy of thestability
PR State is not achieved according to their mineral composition, PCA scores clearly delineate the imported samples from those from other states.
ACKNOWLEDGEMENTS
The authors are thankfulto Conselho Nacional de Pesquisas e Desenvolvimento Tecnológico (CNPq, Brazil) for thescholarshiptoDasio R. De Oliveira Júnior andto Financiadora de Estudos e Projetos (FINEP, Brazil) for financial support (Rede de Monitoramento Ambiental –
Rema/Sibratec).
”
Read:
“
CONCLUSIONS
The present study reveals that, in general, the majority of parameters determined in commercial bottled mineral waters from markets in Curitiba-PR-Brazil are below limits specified by Brazilian legislation. Only one sample was detected as having a high concentration of NO3-, indicating microbiological contamination; some results for NO2- may also reflect the same contamination. Improvements in monitoring throughout the process of filling and points of sale of the samples, with the aim of securing the microbiological quality of bottled mineral waters sold in the region under study may be needed. The comparison of labelled composition to analytical results highlights a difference for most elements, but it should be noted that intrinsic instability as well as other factors such as sorption of components onto container surfaces as well as the length of time spent on the shelf, care during transport, and the ambient storage temperature may alter the composition;
perhaps a “best before date” could eliminate such discrepancies. In such cases,a further study of the
stability and interaction with the packaging should be performed. Although a perfect division of samples from PR State is not achieved according to their mineral composition, PCA scores clearly delineate the imported samples from those from other states.
ACKNOWLEDGEMENTS
The authors are thankful to Conselho Nacional de Pesquisas e Desenvolvimento Tecnológico (CNPq, Brazil) for the scholarship to Dasio R. De Oliveira Júnior and to Financiadora de Estudos e Projetos (FINEP, Brazil) for financial support (Rede de Monitoramento Ambiental –
Rema/Sibratec).
”
In Article “
Chemical quality of bottled mineral waters from markets of
Curitiba-PR-Brazil
”
, with the number of DOI: http://dx.doi.org/10.1590/1678-4324-2016160111,
published in journal Brazilian Archives of Biology and Technology, vol. 59, the 11 page.
That read:
“
Portaria Nº 540 de 18/12/2014: establishesminimumlimits ofnoteworthyelementsfor the classification ofmineral waters – DNPM, Brazil, 2014.Portaria N° 2914 de 12/12/2011: Sets forth the proceduresofcontroland surveillance ofwater qualityfor human consumption andits potability standards, Ministry of Health,Brazil, 2011.
RDC N° 274 de 22/09/2005:approves the Thechnical regulations for water bottled and ices - ANVISA, Brazil, 2005.
”
Read:
“
Portaria Nº 540 de 18/12/2014: establishes minimum limits of noteworthy elements for the classification ofmineral waters – DNPM, Brazil, 2014.RDC N° 274 de 22/09/2005:approves the The chnical regulations for water bottled and ices - ANVISA, Brazil, 2005.
”
In Article “
Chemical quality of bottled mineral waters from markets of
Curitiba-PR-Brazil
”
, with the number of DOI: http://dx.doi.org/10.1590/1678-4324-2016160111,
published in journal Brazilian Archives of Biology and Technology, vol. 59, the 11 page.
That read:
“Silva Pereira, M. S.; Dos Reis, B. F. (2012). Spectrophotometric aluminium determination in high salts concentration solution used in hemodyalisisemploingpreconcentration in flow injection.
Quim. Nova, 25 (6), 931-934.”