www.scielo.br/rbg
FEW CONSIDERATIONS, WARNINGS AND BENEFITS FOR THE E&P INDUSTRY WHEN
INCORPORATING STRATIFICATIONS INSIDE SALT SECTIONS
Alexandre Rodrigo Maul
1,2, Marco Antonio Cetale Santos
1and Cleverson Guizan Silva
1ABSTRACT.This article presents a review of procedures and techniques describing the importance of considering the stratification within the evaporitic section, combining seismic attributes and well information during the processes of seismic migration, in order to build seismic images closer to the geological realities. A new nomenclature is proposed, reflecting the interval velocity and density behavior of different salt strata. The study also reviews the parameters for geomechanical simulations of the reservoir seals, allowing better decisions in terms of production and/or injection rates, among others. The incorporation of intra-salt heterogeneities, or stratifications, allows for a better prediction of operational aspects such as mud weight and penetration rates, which are essential information for drilling safety, and economy. Important considerations about the lithotypes were carried, especially concerning the accumulated frequency of occurrence, the evaporites cyclicity, salt movements, etc. The data resolution, when comparing well models versus seismic models, was another important aspect considered in this review, with emphasis on the uncertainty analysis.
Keywords: evaporites, seismic attributes, resolution, uncertainty, model.
RESUMO.Este artigo apresenta uma revisão sobre os procedimentos e as técnicas que descrevem a importância de considerar estratificações existentes dentro da seção evaporítica, combinando atributos sísmicos e informações de poços para construir imagens sísmicas o mais próximo possível da realidade geológica, através de processos mais robustos de migrações sísmicas. Uma nova nomenclatura é proposta refletindo o comportamento da velocidade intervalar e densidade de cada estrato. Adicionalmente, são abordados os parâmetros para simulação geomecânica das rochas capeadoras dos reservatórios, permitindo melhores decisões sobre taxas de produção e injeção dos campos, entre outras. A incorporação das heterogeneidades, ou estratificações, nas seções evaporíticas também auxilia na definição de aspectos operacionais, tais como peso de fluido e taxas de penetração, informações essenciais para a segurança e economicidade da perfuração. Importantes considerações sobre a frequência de ocorrência dos litotipos, a ciclicidade dos evaporitos, movimentações do sal, etc., são também abordadas. A resolução dos dados, quando comparamos os modelos oriundos dos poços com os provenientes da sísmica, foi outro importante aspecto considerado, quando da análise de incertezas.
Palavras-chave: evaporitos, atributos sísmicos, resolução, incerteza, modelo.
1Universidade Federal Fluminense – UFF, Geology and Geophysics, Av. General Milton Tavares de Souza, s.n., 24210-346, Niterói, RJ, Brazil – E-mails:
marcocetale@id.uff.br, cguizan@id.uff.br
INTRODUCTION
The first drilled well to reach the Santos Basin pre-salt reservoir section, at the Brazilian southeastern continental margin, in September 2005, crossed an evaporitic section of approximately 2,000 m, in order to access deep reservoirs about 5,000 meters below sea floor. Currently more than 200 wells have been drilled in the Santos Basin to access the pre-salt section reservoirs. The production in this section already exceeds 1.5 million barrels of oil equivalent per day, through several fields. One important aspect about this evaporitic section is that it cannot be considered homogeneous, composed only by halite, the most common evaporitic salt. Maul et al. (2015) emphasized the stratification inside that section. Those stratifications and their main aspect are the so-called enigmatic structures mentioned by Jackson et al. (2015). Among discussions in the literature and, even more, in the light of the drilled wells, several types of evaporites are identified on the Santos Basin evaporitic succession, as can be found in similar onshore salt mines around the world (Poiate Jr, 2012). Drilling in evaporitic sections is operationally challenging and subject to several risks since these rocks have completely different physical behavior, resulting in drilling column imprisonment, column collapse or over pressured brines. A direct implication of this misguided approach that considers a homogeneous salt is unrealistic seismic images leading to errors during well locations aimed to achieve the reservoirs below the evaporitic section. Robust depth seismic migration strategies depend on more realistic velocity models in terms of geology, therefore, better-constrained salt models become mandatory (Gobatto et al., 2016; Fonseca et al., 2018; Maul et al., 2018a).
From the combination of seismic images and well data, the development of field exploitation models addresses the geomechanical conditions to efficiently produce and determine the injection rates to pressure maintenance within the reservoir. As the evaporitic section is the pre-salt reservoir “seal”, the geomechanical behavior is fundamental for the exploration and exploitation stages (Teixeira et al., 2017, 2018). In the present article, we propose a new nomenclature reflecting mineral groups in terms of interval velocity and density aiming to simplify the construction of seismic velocity models. Important aspects to consider when working with heterogeneities in evaporitic sections are reviewed describing the limitations as well as the direct and indirect applications of better-constrained seismic velocity models, in an attempt to investigate the reservoirs below the evaporitic section. Besides, we review the influence
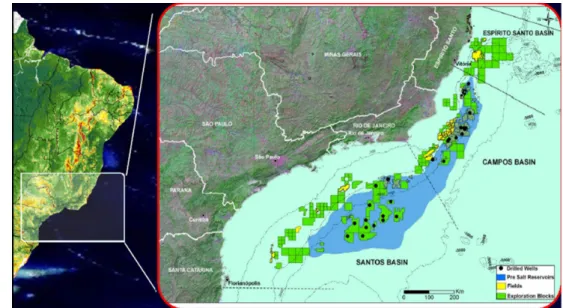
of different salts and salt stratification and its influence in seismic imaging, as well as the advantages to use instantaneous seismic attributes or the inversion results. Several published examples are presented, covering almost the entire extension of Santos and Campos Basins, offshore southeastern Brazil (Fig. 1, where hydrocarbon reservoirs in pre-salt section occur, with greater emphasis for the Santos Basin. Through the examples, we will illustrate the improvements when applying different methodological approaches for different E&P projects, allowing better decisions in many disciplines.
METHODOLOGY REVIEW
Maul et al. (2015) present a methodology for a qualitative evaluation of seismic amplitude response at the base of salt (equivalent to the top of the pre-salt reservoirs in Santos Basin), using seismic illumination studies. They applied several salt velocity models, including constant velocities, inserting dome geometries, interpreting stratified regions and incorporating stratification using as constrains the amplitude response. The referred approach was re-introduced and tested in many other works (Jardim et al., 2015; Maul et al., 2016; González et al., 2016; Gobatto et al., 2016; Falcão et al., 2016; González et al., 2018; Fonseca et al., 2018).
During this first approach, the authors used only the seismic amplitude response in order to incorporate the existing stratification inside the evaporitic section. Despite promising results, these early works still indicated some classic problems, such as interface X layer response; lack of well calibration information; seismic resolution problems; ambiguities. Therefore, the referred authors developed several approaches aiming to mitigate, at least in part, each of the identified problems during project execution.
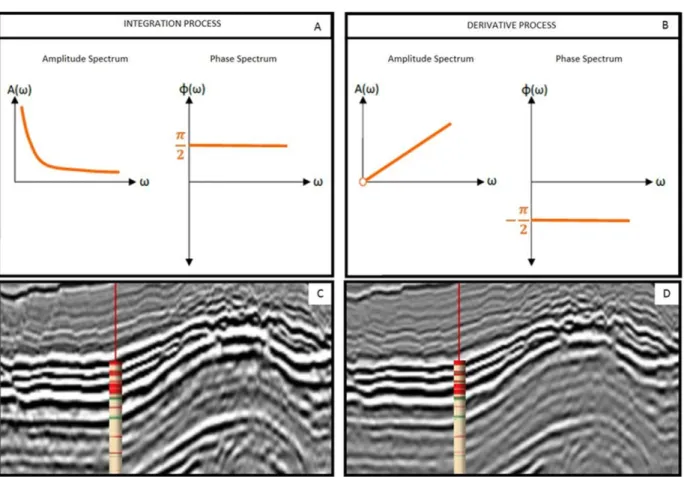
To improve seismic resolution some suggested studies to recover the high frequencies, using an iterative seismic deconvolution process, intending to remove part of the wavelet lobe effect. Seismic data integration after deconvolution returned the lithology property information as pseudo-layers, instead as interfaces. This process is equal to a 90º phase rotation over the de-convolved data, assuming it is a zero phase data. This combination, although effective, generates a low frequency enhancing effect. To minimize this effect Seifert et al. (2017) proposed a data derivative process, resulting in little high frequency Increase.
However, since they aimed to change from a property interface to a pseudo-impedance, the derivative process resulted
Figure 1 – Location of Campos and Santos Basins. The blue polygon limits the pre-salt reservoirs totaling an area of approximately
350,000 km2in water depths between 2,000 and 3,000 m. Green and gray polygons are exploration blocks and yellow polygons the
hydrocarbon fields. Black dots locate the drilled wells. Modified from https://diariodopresal.files.wordpress.com/2010/.
in a 90º phase rotation but in the opposite direction when compared with the integrated data. This raised another approach: to run a 180º phase rotation in order to have the same placement of the integration process. The benefits when considering the derivative instead the integration and how any of these approaches enhance the signal resolution is presented in Figure 2.
The thicknesses of evaporitic stratifications are about meters, arising ambiguity issues with respect to the seismic resolution. In addition, many seismic events are often built by the seismic convolutional phenomenon or, as we can simply say, the wavelet lateral lobes, as exemplified by Oliveira et al. (2015). These authors applied a phase rotation (integration/derivation) in search for the layer property, the socalled pseudo-impedance, obtaining better resolution (deconvolution). However, this process does not guarantee proper well and seismic calibration, driving Meneguim et al. (2015) to suggest the use of an absolute inversion process to circumvent this ambiguity response.
Tying well and seismic data properly is of fundamental importance, however, for operational and economic reasons, in the evaporitic section he vast majority of wells have no registered logs. To fill this lack of information, Amaral et al. (2015) propose to use rock-cutting samples to get a better lithological statistical representation. It enabled them to estimate the average interval velocity using average velocities for each lithotype. To establish these values they used the information presented by Justen et al. (2013).
Meneguim et al. (2015), Barros et al. (2017) and Cornelius & Castagna (2018) adopted similar approaches. This approach allows the usage of all the wells for the seismic inversion process even in case the estimated velocity values are not very accurate.
The uncertainty related to this methodology, when calculating average interval velocities, was explored by Meneguim et al. (2015), González et al. (2016), Yamamoto et al. (2016), Gobatto et al. (2016), Falcão (2017) and tested by González et al. (2018).
During the acoustic inversion process, three aspects are of utmost importance. (1) the seismic data quality, regarding phase and noise to signal ratio; (2) the interpreted seismic horizons and faults, which will serve as boundary conditions for the inversion study, as well as for modelling (commonly called trend-model) and, finally (3), the availability of well log information, in particular acoustic sonic and density. After tied to seismic data, the logs serve as inputs for seismic properties distribution, important step when building inversion trend models.
The thickness variation of the evaporitic section, from a few meters to more than 2 kilometers, is another great issue for the seismic inversion. This variation imposes difficulties to establish a single wavelet to represent this range of thickness changes.
As described earlier the seismic acoustic inversion, taking all the described precautions, provides the best response in terms of stratification resolution and positioning, generating the best answers in terms of impedance, density and interval velocity. Additionally, Meneguim et al. (2015) also propose a Bayesian
Figure 2 – Comparison of the integration (A) and derivative (B) processes to enhance the seismic resolution over the amplitude data. A - amplitude and phase spectrum
behavior when applying the integration process, note the decrease of the amplitude spectrum and theπ/2 phase rotation; B - amplitude and phase spectrum behavior when applying the derivative process, note the increase of the amplitude spectrum and the -π/2 phase rotation. In this example, a 180◦phase rotation is needed to place the response at the same location as the integration process; C - original amplitude response; D - derivative process + phase rotation response emphasizing the benefits when considering this combined approach. Adapted from Falcão (2017).
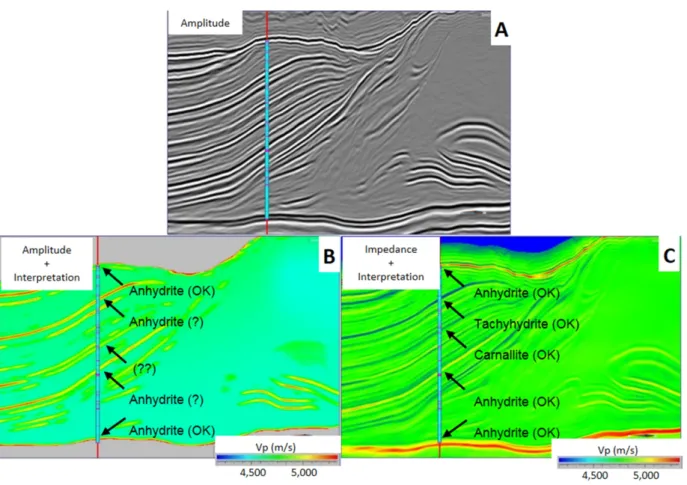
classification to complement the acoustic inversion studies. This process brings the possibility to generate probabilistic scenarios for the occurrence of each lithological type inside the evaporitic section, enhancing the resolution. To emphasize the benefits of using the inversion results, Gobatto et al. (2016) present a comparison between the amplitude and the impedance interpretation of the salt heterogeneities (Fig. 3).
EVAPORITES REVIEW
Evaporites by definition are rocks formed in sedimentary environments with very low terrigenous supply, subjected to high evaporation rates, in arid climate conditions, providing the formation of brines. According to Kendall (1988), a sequential chemical precipitation of carbonates, sulphates and chlorides reflect a vertical succession as well as its lateral positioning, as established by the Walther’s Law, with carbonates and sulfates
near the entrance to the sea, and more soluble salts in the central and distal areas of the basin. Karner & Gamboa (2007) advocate that evaporites are the final stage of a regional mega-transgressive sequence. However, other researchers argue that the formation of the “salt ponds” were formed as part of the fast break-up during the rift phase causing subsidence and influx of seawater in “restricted lakes”.
Characteristically, the total evaporite precipitation occurs in a very short time, even in very large areas, causing few benthic biozones (Schreiber et al., 2007). In the Santos Basin, Dias et al. (1994) and Davison (2007) apud Karner & Gamboa (2007) indicate a maximum age of deposition of about 113Ma. This estimate is in agreement with the pre-salt and post-salt sediments at the proximal portion of the basin, dating somewhere between 120Ma and 110Ma (Freitas, 2006). All authors, however, call the attention for the poor accuracy of the ages. Even with
Figure 3 – Possible interpretations of salt heterogeneities. A - Amplitude response – the main input for the study; B - Salt heterogeneities interpretation based
on amplitude response only. Some anhydrite layers are confirmed, but few doubts on the interpretation still remain; C - Salt heterogeneities interpretation based on impedance response. Observe the better interpretation in terms of both, resolution and lithotypes, honoring the well information. Adapted from Gobatto et al. (2016).
this relatively short deposition interval, the evaporitic thickness in the basin depocenter is over 2,000 m, confirming the high depositional rates. The salt movement mechanism, specifically for the halite, results in various structures such as salt pillows, domes, walls, rafts, growth faults, etc. The vertical movement is attributed to the Rayleigh-Taylor (R-T) instability, as described by Lachmann (1910) and Arrhenius (1913) both referenced in Dooley et al. (2015). Ge et al. (1997) discuss the effect of the sedimentary overload over an evaporitic section above an irregular basement. According to these authors, the sediment weight forces the salt to come up on pillows or anticlines. With the overload continuity, these structures were transformed into domes and salt walls. Guerra & Underhill (2012) defend the hypothesis where the gravity force and pressure differences move all the evaporites together from high pressure to lower pressure areas in the Santos Basin.
The seismic interpretation and numerical models provide better understanding of the halokinectic effects present in the
Santos Basin. Several authors advocate the division of Santos Basin into “Halokinectic Provinces” (Demercian et al., 1993; Cobbold et al., 1995; Demercian, 1996; Szatmari et al., 1996; Ge et al., 1997; Gemmer et al., 2004; Ings et al., 2004; Mohriak et al., 2008; Guerra & Szatmari, 2009; Davison et al., 2012; Jackson et al., 2014). Gamboa et al. (2009) mention the existing of four major saline cycles within the Aptian Section in Santos Basin: (1) a basal thick package of halite; (2) a composite package of anhydrite at the base followed by halite and other salt compounds; (3) a slender halite package and finally (4) thinner package of the same salts described in (2). Freitas (2006) describes more than a dozen smaller cycles composing the larger cycles previously described. Each individual cycles being composed by a succession of anhydrite, halite, complex salts, halite and finally anhydrite. The complex soluble salts may not be represented in every described cycles.
Jackson et al. (2015) emphasize the existence of enigmatic structures within the evaporitic section in Santos Basin, probably
generated by vertical compressive forces (Dooley et al., 2015). The great salt lithotypes variability in the evaporitic section, suggests that each one has different a behavior. Some are classically mobile, other more plastic and other more ruptile. Poiate Jr (2012) consulting several authors mentioned the main evaporites deposits in sedimentary basins according to their chemical composition (Table 1).
Table 1 – Chemical composition of major evaporitic minerals and their
separation in specific groups according to Poiate Jr (2012).
Group Mineral Composition
Carbonates Calcite CaCO3 Magnesite MgCO3 Dolomite CaMg(CO3)2 Trona Na3H(CO3)2· 2(H2O) Sulfates Gypsum CaSO4·2(H2O) Anhydrite CaSO4 Kieserite MgSO4·H2O Langbeinite K2Mg2(SO4)3 Polyhalite K2Ca2Mg(SO4)4·6(H2O) Chlorides Halite NaCl Sylvite KCl Kainite MgSO4· KCl · 3(H2O) Bischofite MgCl2·6(H2O) Carnallite KMgCl3·6(H2O) Tachyhydrite CaMg2Cl6· 12(H2O)
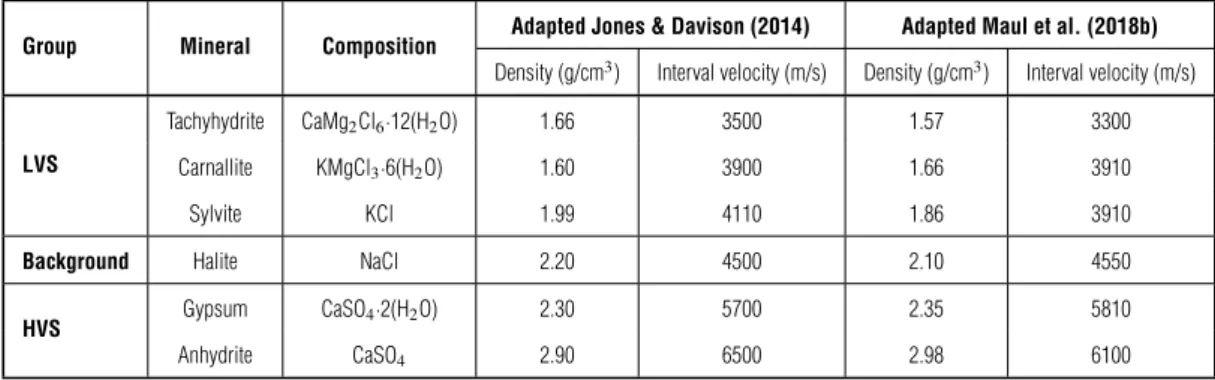
Maul et al. (2018b) based on the methodology proposed by Amaral et al. (2015), compiled the information from more than 200 wells in Santos Basin, showing the halite predominance, over 80% of occurrence. The other 20% are anyhydrite, gypsum, tachyhydrite, carnallite, and sylvite. Other studies considered halite the background mineral in this section representing 75-90% of occurrences (Yamamoto et al., 2016; Gobatto et al., 2016). Based on this work, Maul et al. (2018b) organized the salt types into three specific groups: Low Velocity Salts (LVS), composed by sylvite, carnallite and tachyhydrite, representing something between 5-10% of occurrence; halite (background), representing nearly 80%, and; High Velocity Salts (HVS) represented basically by anhydrite and few gypsum occurrences, corresponding to 10-20% of mineral occurrences.
These percentages are important when considering average interval velocity and density calculations as well as any other derived elastic property for the evaporitic section. These percentages are in accordance to the literature results (Fiduk & Rowan, 2012; Jackson et al., 2014, 2015). Table 2 presents the salt mineral groups, and respective density and interval velocities, comparing the values published by Jones & Davison (2014) with the average values compiled by Maul et al. (2018b) for more than 200 wells in Santos Basin.
Jones & Davison (2014) described the seismic reflectivity response of salt sections and indicated a specific domain nominated ”Complex Appearance within Body Salt”, in domed regions, where intense salt deformation result in non-reflective evaporites. According to Jackson et al. (2015), it is possible to distinguish four seismic facies inside the salt section as described in Table 3.
Table 2 – Mineral groups and respective properties. Comparison of density and interval velocity values reported by Jones & Davison (2014), with
the average values compiled by Maul et al. (2018b) covering more than 200 well in Santos Basin. Low Velocity Salts (LVS), Halite (Background) and High Velocity Salts (HVS).
Group Mineral Composition Adapted Jones & Davison (2014) Adapted Maul et al. (2018b)
Density (g/cm3) Interval velocity (m/s) Density (g/cm3) Interval velocity (m/s)
LVS
Tachyhydrite CaMg2Cl6·12(H2O) 1.66 3500 1.57 3300
Carnallite KMgCl3·6(H2O) 1.60 3900 1.66 3910
Sylvite KCl 1.99 4110 1.86 3910
Background Halite NaCl 2.20 4500 2.10 4550
HVS Gypsum CaSO4·2(H2O) 2.30 5700 2.35 5810
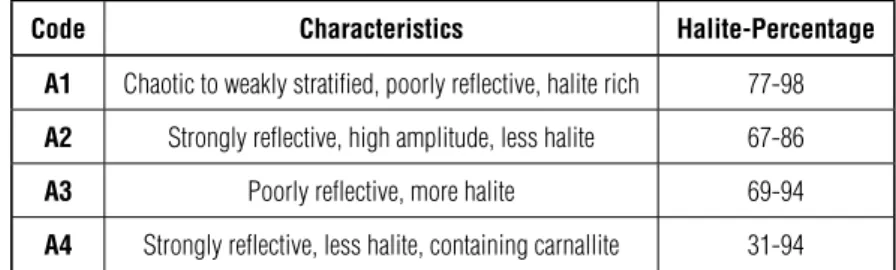
Table 3 – Seismic facies in relation to the halite content within the salt sections according to
Jackson et al. (2015).
Code Characteristics Halite-Percentage
A1 Chaotic to weakly stratified, poorly reflective, halite rich 77-98
A2 Strongly reflective, high amplitude, less halite 67-86
A3 Poorly reflective, more halite 69-94
A4 Strongly reflective, less halite, containing carnallite 31-94
PROPOSED CLASSIFICATION OF THE STRATIFIED SALT DOMAINS
From the combination of these two approaches (Jones & Davison, 2014; Jackson et al., 2015) it is possible to propose a new classification based on seismic facies and salt composition as follows:
Without Stratification Domain (WSD)
This domain is characterized by the absence of seismic reflections (which can be understood as absent stratification or a mixture of evaporites). In this domain, the halite predominates with a mixture of small amounts of mobile salts including sylvite, carnallite, tachyhydrite and other less common salts. The halite content exceeds 95%, and the mobile salts account for less than 5%.
Evident Stratification Domain (ESD)
This domain is represented by the strongest stratification, with presence of all kinds of evaporites. The halite is broadly present, however, other evaporitic groups (HVS and LVS) have important occurrence. In this domain, the salt thickness is the smallest depending on the overload (commonly carbonates on Santos Basin). The overload promotes expulsion of the most mobile salts such as halite, sylvite, carnallite and tachyhydrite, increasing the HVS proportion in these regions, while the halite decreases to about 70%.
Random Stratification Domain (RSD)
A relatively well identified domain shows erratic stratification originated under deformation mobile salt movements. The salt proportions are erratic. The folded salt layers could even be present many times within the same evaporitic level. However, in wells the halite proportion reaches more than 85%.
Hidden Stratification Domain (HSD)
In the HSD domain, the seismic response is “hidden”, due to seismic resolution, incidence angle and/or mixing of minerals. Salt groups from the “WSD” domain could also be present within the HSD.
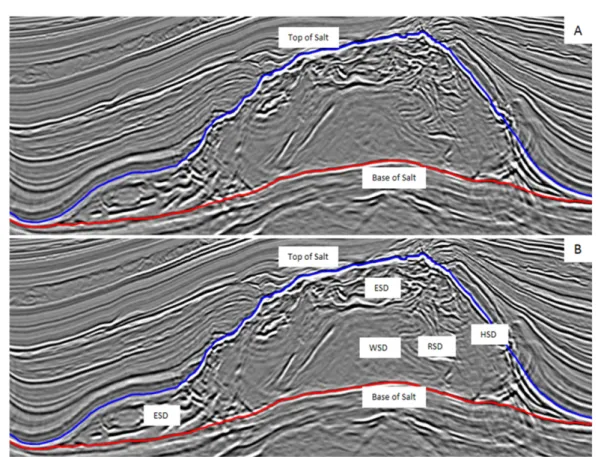
Although the WSD, ESD and RSD domains are challenging for any E&P activity, they are relatively simple to identify on seismic images, especially those coming from optimized parametrization of acquisitions followed by appropriate seismic processing techniques. Contrarily the seismic interpretation is unclear and difficult in the HSD domain. Figure 4 illustrates the distribution of the proposed domains on seismic data, considering the presence or absence of stratification within the salt section.
SALT INFLUENCE OVER SEISMIC MODELS – SHORT REVIEW
The quality of seismic images depends on the acquisition parametrization as well as the processing strategy, especially in terms of the applied migration process (Yilmaz, 2001). This same author has emphasized that considering the structural complexity when building the seismic image has a tremendous influence in reproducing a model faithfully. According to Ritter (2011), the main seismic migration goals are the correct positioning of seismic reflectors (vertical and horizontal) and mainly the correspondence between the reflection amplitudes and the reflection coefficient by themselves. The author also comments that the migration process requires strong knowledge of the velocity field, which is often estimated from seismic data by itself Jones & Davison (2013, 2014) cite various difficulties for imaging over evaporitic bodies such as the flanks, the layer interfaces and the overlying layer. However, they do not mention in an explicit way existing stratifications inherent issues, on which we have our considerations.
Figure 4 – Examples of seismic interpretation: ”A” without salt domains:”B” including the salt domains; WSD – Without Stratification Domain;
ESD – Evident Stratification Domain; RSD – Random Stratification Domain; HSD – “Hidden” Stratification Domain.
Therefore, to improve the seismic image quality over salt layers, sophisticated seismic data processing algorithms are required, especially with regard to the migration method (Fonseca et al., 2018; Maul et al., 2018a). Falcão (2017) illustrates, using a theoretical model, how a plan and horizontal target below the base of the salt is influenced by the salt stratification during the migration process. The results demonstrated that only a stratified salt velocity model, applied during the seismic migration, reproduced the initial target. In areas of complex geology, under the evaporitic section, the application of Reverse Time Migration (RTM) is increasing. This algorithm uses the full wave equation without any asymptotic approximation, therefore not showing limitations due to the structural complexity (dipping layers, lateral velocity variations). Regardless of the correct velocity model applied to the evaporitic section, the contrast between lithology types eventually generates stratifications or similar seismic interfaces due to the convolutional process.
Meneguim et al. (2015) illustrate that robust depth scenarios is also possible when using the stratification information inside the salt section. Gobatto et al. (2016) followed
by Fonseca et al. (2018) and Maul et al. (2018a) applied interval velocity models for the evaporitic section, considering the existing stratification, resulting in better gathers alignment during move-out correction. It provides smaller computational efforts when updating velocity models through tomography, as well as assisting Full-Waveform Inversion (FWI) before updating the final velocity model to perform the RTM process.
STRATIFIED SALT MODEL APPLICATIONS
The obtained results under the stratification insertion methodologies serve as inputs for different disciplines, such as seismic studies as well as geomechanical simulation and operational safety when drilling new wells. We present and discuss some application examples.
Seismic Illumination
The objective of seismic illumination studies is to illustrate a seismic wave response in a given target. In the exploration and production oil industry regarding seismic studies, several solutions and some examples illustrate the results from ray
tracing as well as from simulated amplitude (Laurain et al., 2004a,b). The illumination studies are always models. For that reason, they only generate simplified results. It is an output depending on impedance, interval velocity and density as inputs. The ray tracing has a strong impact on the response, since this technique considers the smoothed interfaces (Pratt et al., 1996). This is not the case for the evaporitic section of Santos Basin, where stratifications are present and some of them are deformed. As an example for seismic acquisition, we present the instantaneous amplitude map computed over the target of interest to compare with the illumination outputs. After this, taking the available processing velocity model we suggested a ray tracing illumination study. To complement the analysis an amplitude simulation study was performed considering the recovered amplitude energy at any point. In order to evaluate the results a new model (incorporating salt stratification using the amplitude response to generate the stratification inside the salt section) was generated, using the same previous acquisition parameters. Figure 5 presents the results.
We observe in Figure 5 that the amplitude responses observed in ”A” are not present in the simulated amplitude responses in “B”. This happened because the processing velocity model does not reproduce the existing geology above the target (i.e.: the existing salt stratifications). On Figure 5 ”C”, using the stratified velocity model, most of the amplitude features observed in “A” are present. The details observed in ”A” missing in ”C” result from the simplifications required for the ray trace solution. Maul et al. (2015) suggest a methodology to control the target amplitude response for reservoir properties extrapolation. Knowing the energy at any given point from the migrated seismic data, the authors verified how confident was the amplitude response to use as external drift for well property extrapolation. The authors demonstrate how to generate uncertainty illumination maps (hit-count maps) despite not knowing the real salt velocity model. They also discuss how the overburden model could influence the amplitude responses in a given target. Jardim et al. (2015), Falcão et al. (2016) and González et al. (2018) later supported these results. Figure 6 illustrates the obtained results in a particular project in Santos Basin.
A greater qualitative correlation between the real extracted amplitude’s map on the target of interest “A” with the salt stratified model “D” is observed figure 6. The results are comparable to that presented in figure 5. Subsequently, a quantitative uncertainty analysis regarding the amplitude response, assuming various salt velocity models was performed (Maul et al., 2015). Different
models return similar responses in terms of hit-counts where the overburden do not influence the results.
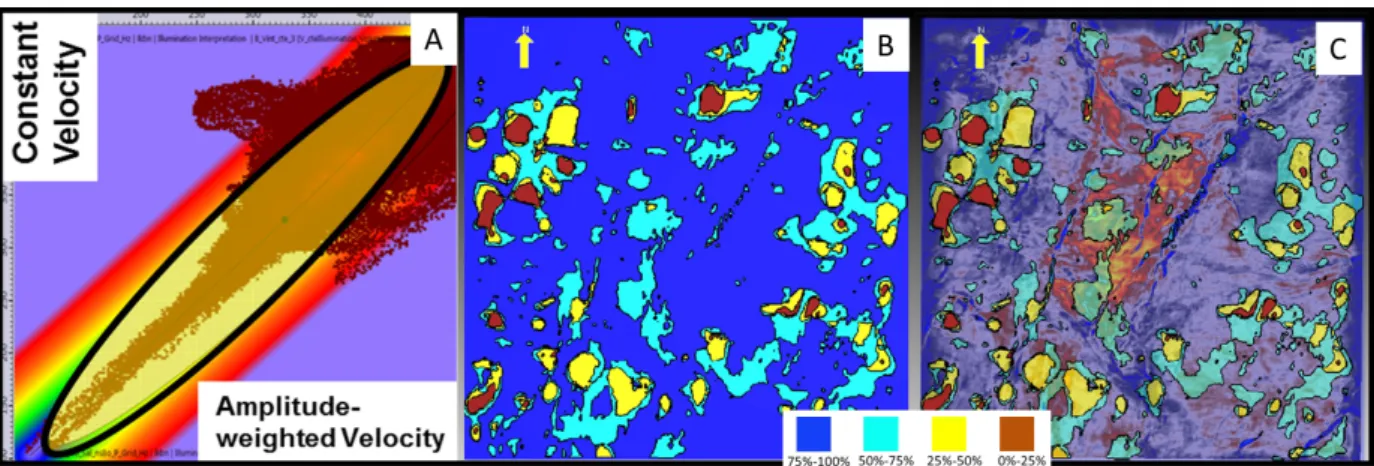
Figure 7 illustrates the combination of each two maps in order to get maps of accumulated variations between them. The energy responses inside the black ellipse in fig 7A have more similarity, in other words, less variation when comparing any two given models. This approach was performed using any two-velocity models and the cumulative difference map is presented (Fig. 7B). The values represent the response confidence degree. The normalized values represent how velocity-model dependent is the response. This information is useful for a property distribution trend variable analysis.
Seismic Processing
The best seismic images are obtained after a combination of proper acquisition parameters; appropriate seismic processing strategies, particularly regarding migration, and the best possible velocity model for any data. As widely discussed, the evaporitic section should not be considered simple or homogeneous.
Improvements have been observed when considering stratification regardless of the seismic migration method, such as RTM. Even lighter computational methodologies (e.g. Kirchhoff) also get benefits when considering the stratifications applying a prior smooth model velocity (Falcão, 2017). The background velocity, when considering the salt stratification as primary information, has shown to be very efficient when searching for better “gathers alignments” during the Normal Move-Out (NMO) or Dip Move-Out (DMO) processing operations. DMO is commonly applied for environments that are more complex. As a direct consequence, this result in lesser computational effort (Gobatto et al., 2016; Fonseca et al., 2017, 2018; Maul et al., 2018a,b). Figure 8 illustrates the gather alignment using a salt stratified velocity model.
Adequate initial velocity models also provide better tomographic model update assisting in the gathers aligning process and consequently better seismic images (Pombo et al., 2017). On this aspect, the salt stratification serves at least as a boundary condition for tomographic updating providing better convergences and minimizing the computational effort. Guo & Fagin (2002) emphasize the need to incorporate reasonable geological knowledge into any velocity modelling workflow. The method presented by Maul et al. (2015) brings the geological features to velocity model in the evaporitic section, calibrating it using the well information. Figure 9 shows the overlap of the velocity models and seismic image, exemplifying the coincidence
Figure 5 – Illumination study results based on the ray trace, showing the
amplitude response simulation for different salt models. A - Instantaneous amplitude response extracted from the migrated data over the horizon of interest; B - Simulated amplitude response computed after a ray trace illumination study considering the existing processing velocity model as input, over the same horizon of interest; C - Simulated amplitude response computed after a ray trace illumination study considering the stratified velocity model as input over the same horizon of interest. Images kindly provided by the Geophysicists Rejhane Santos, Roberto Dias & Rodrigo Link (2014).
Figure 6 – Hit-map studies obtained from seismic acquisition simulations
considering different velocity models. The more hits at any given point (x,y) the more reliable is the original amplitude response. A - Instantaneous seismic amplitude response extracted on the horizon of interest; B - Point count map (hit-count) in specific targets (x,y) using the seismic processing model as input; C - Point count map (hit-count) in specific targets (x,y) using a constant velocity model for the salt (4,500 m/s) as input; D - Point count map (hit-count) in specific targets (x,y) using the stratified salt velocity model. Adapted from Maul et al. (2015).
of velocity variations guided by the amplitude response in the stratified model (Fig. 9C).
The velocity model update applying the FWI technique has become quite usual even for processing data not containing enough far offset information. One of the major pre-requisites for the FWI application is to provide an almost precise initial velocity model compatible with the final velocity model in terms of geology. Once again, in this case, the generation of geological velocity model considering seismic attributes as guide shows very efficiency results.
The anisotropy consideration when building velocity models in order to generate more realistic seismic images have
become increasingly obvious (Cogan et al., 2011; Zdraveva et al., 2011; Cooke et al., 2012). Anisotropic aspects involved in velocity model building depart from well information when comparing expected and observed results. Raymer et al. (1999) and Raymer et al. (2000) indicated that the anisotropy in salt bodies observed in wells could be over than 7% in the preferred direction (parallel to the depositional axis, if there is one). The anisotropic aspect is not predominant in halite and other mobile salts but it exists. The rigidity character of ruptile salts, such as anhydrite, becomes more important, especially following the preferred directions imposed by the stratifications. Thus, the heterogeneous and consistent velocity model presenting salt
Figure 7 – Amplitude response uncertainty analysis as a similarity response function considering velocity salt model variation calculated on the horizon of interest.
A - Cross-Plot between any two models. The central area (black ellipse) represents greater similarity when comparing two different models; B - Sum of the differences between any two maps. The blue shades represent the greater similarity, independent of the used model; the other colors represent the decreasing similarities and consequently the lower confidence levels; C - The same similarity map “B” overlapping the target extracted amplitude response, filtering out the dark blue where response confidence is higher. Adapted from Maul et al. (2015).
Figure 8 – Seismic section illustrating the position of gather panels (left). The reflectors in the deformed strata in panel ”B” (green ellipse) are perfectly aligned after
application of stratified velocity model. Adapted from Gobatto et al. (2016).
stratifications, even without good resolution, is an important input to the anisotropy analysis. At least, the stratifications help controlling the anisotropy extrapolation of information observed in wells.
The previously described aspects (velocity model update by FWI and anisotropy, tomographic update and gathers alignment) aim to the final goal: the seismic migration and its deliverable images. Considering the feasibility and computational
effort, the RTM migration is considered the most suitable for complex geology projects, such are the salt bodies, regarding seismic migrations for the pre-salt occurrences. RTM requires a refined velocity model, seeking to reflect the existing media heterogeneities. In this way velocity models incorporating stratification, anisotropy, FWI, tomographic inversion and, RTM with upper frequency bounds (up to 45 Hz), are the best approaches to consider.
Figure 9 – Salt interval seismic section with different overlapped velocity
models. A - Constant velocity model (4,500 m/s); B - Tomographic velocity model updated over the constant velocity model; C - Stratified velocity model adopting the methodology described in this work. Note the notable coincidence between velocity variations guided by the amplitude response in the model ”C”, while this does not occur in the models “A” and ”B”. The average interval values in both “B” and “C”, for each x and y position, are similar however, only in “C” the velocities follow the geological features. Adapted from Maul et al. (2015).
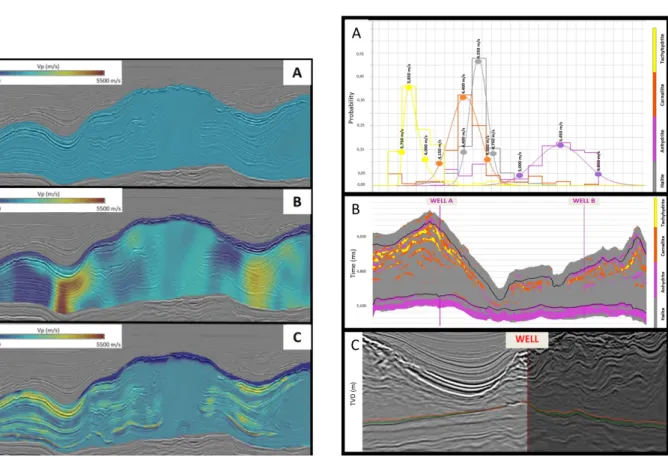
Figure 10 – Depth positioning uncertainty analysis. A - Velocity variation for
each mineral type emphasizing the average values and two standard deviations above and below (TQD–Tachyhydrite; CRN–Carnallite; AND–Anhydrite; HAL–Halite); B - Section illustrating the probability of occurrence of each mineral type at any position (x,y,z), in a time-section; C - Sections illustrating the horizons converted by the velocity models considering the probability velocity cube shown in ”B” and the mineral velocity values as described in ”A”. The green horizon shows the base scenario, the orange represents the lower velocities scenario and the blue represents the highest velocities scenario. Adapted from Meneguim et al. (2015).
Uncertainty Analysis in Vertical Positioning
An obvious consequence of the stratification modeling is the vertical positioning variation of the target. Even considering simplified velocity models (almost constant) in stratified intervals, tomographic adapted, anisotropic criteria and FWI, always require well information for calibration. To extrapolate the information far from the well position, several works suggest a combination of wells (1D) with spatial information (2D or 3D) from interpreted horizons and velocity analysis, all together (Dubrule, 2003; Robein, 2003; Leron et al., 2003; Sandjivy et al., 2003; Bulhões et al., 2014; Ferreira et al., 2017; Pombo et al., 2017). Meneguim et al. (2015) created a routine, considering the stratification position, classifying the lithological type and assuming the average velocity value for each class. Additionally,
the authors applied two standard deviations generating three horizon scenarios for reference (Fig. 10). The base scenario considered the average velocity, the deeper position considers two standard deviations above the average velocity and the shallower position considered two standard deviations below the average velocity. With this approach, the authors reported a 3% displacement gross variation, regarding rock volume, above the oil-water contact, compared to the base case.
Operational Safety and Geomechanical Simulation Studies
Classically evaporites are low-viscosity, ductile and plastic minerals/rocks. They also present fluidity when subject to high tensions. Because of that, the deposits easily move and may
generate large domes and important folds, representing one of the major challenges for drilling. Especially regarding drill imprisonment or even casing collapses, eventually resulting in complete well loss.
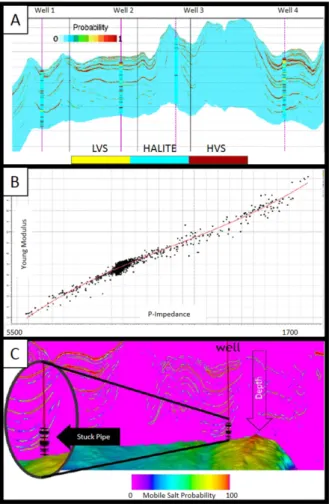
Figure 11 – Example of property extraction from cross plots applied for the
evaluation of operational safety when drilling well. A - Cube of most probable facies generated from Bayesian’s classification performed over the salt acoustic impedance cube. LVS – Low Velocity Salts; HALITE – Halite; HVS – High Velocity Salts; B - Cross-plot illustrating how to generate one property from another using well information; C - Example of imprisonments events during drilling and its effective correspondence with the seismic facies predictions. Adapted from Teixeira et al. (2017).
These aspects are more important for halite and mobile salts (sylvite, carnallite, tachyhydrite) and less critical for anhydrite, since it presents greater stability (Costa & Poiate Jr, 2009). For geomechanical simulation studies, the sealing rocks require special attention. In the pre-salt reservoirs, evaporites are the seals. The first geomechanical simulations for these reservoirs considered the evaporitic seal a homogeneous layer, composed by halite. In some cases, the studies also considered a thin layer (around 15 meters) of anhydrite at the base of this
”homogeneous” section. In the current methodology, we used the stratified models and, imposed laboratory property values over the established lithotypes: density, elasticity modulus, Poisson ratio, stiffness, friction angle, etc. creating a better geomechanical model in terms of cape rock. Toríbio et al. (2017) confirmed the utility in be considering this methodology in order to generate geomechanical properties. Complementing, cross-plot analysis and the related equations generated compatible property values required to these models. Teixeira et al. (2017) and Teixeira et al. (2018) illustrated how acoustic inversion in salt section plus Bayesian facies classification, combined with properties correlation using well logs, allowed more robust models in terms of elastic properties (Fig. 11).
CONCLUSION
The results presented in this review indicate that considering the stratification inside evaporitic sections is mandatory for diverse E&P applications. It increases safety during drilling and can enhance geomechanical models of cape rocks, better predicting the production and injection rates.
Using the seismic amplitude or any instantaneous attributes to incorporate stratification inside evaporitic sections is an effective methodology even where the seismic data resolution is not enough or the seismic information has lower quality.
Stratified seismic models based on inversion data help to solve false amplitude interpretations due to the convolutional effect. It helps effective well information calibration. In the absence of inversion data, at least deconvolution, followed by a derivative and phase rotation is recommended.
As expected, these processes combined enhance the frequency, increasing the resolution of layers during the inversion process, even without well calibration.
The seismic facies study complements the acoustic inversion. It offers the possibility to create probabilistic scenarios for the occurrence of each lithotype at any single point, helping to increase the resolution.
In Santos Basin, after compiling information for more than 200 wells, we conclude that around 80% of lithotypes are, basically, halite, 10-20% high velocity salts-HVS (anhydrite and gypsum) and 5-10% low velocity salts-LVS (sylvite, carnallite and tachyhydrite). The seismic response of the “mineral groups” halite, LVS and HVS is effective and adequate, considering the seismic frequencies in Santos and Campos Basins, giving a thickness resolution about 30-50 m. The thickest salt regions have greater prevalence of halite and low velocity salts. In thinner
salt regions, the presence of high velocity salts is predominant. The overload above the salt drives the expulsion of the more mobile material (halite, sylvite, carnallite and tachyhydrite) increasing the proportion of high velocity salts (anhydrite and gypsum).
The proposed classification in terms of stratification pattern (WSD, ESD, RSD and HSD) is also another approach to minimize the risk when trying to solve seismic image problems. Stratified velocity models provide better illumination studies for both: seismic acquisition design and to evaluate amplitude quality response. During seismic processing, they provide the means to greatly improve tomographic studies, FWI updating, and gather alignments resulting in better seismic images. The methodology can also be used to evaluate depth-positioning uncertainties.
ACKNOWLEDGMENTS
The authors would like to thank Petrobras for providing time to prepare this compilation and the permission to publish it, as well as few many colleagues, which authorized the figures publication. Specially thanks to the Geophysicist Pablo Barros for reviewing the final text.
REFERENCES
AMARAL PJT, MAUL AR, FALCÃO L, CRUZ NMSM, GONZÁLEZ MA & GONZÁLEZ G. 2015. Estudo estatístico da velocidade dos sais na camada evaporítica na Bacia de Santos. In: 14th International Congress of the Brazilian Geophysical Society & EXPOGEF. Rio de Janeiro, Brazil, 3-6 August 2015, p. 666–669. Brazilian Geophysical Society. doi: 10.1190/ sbgf2015131.
BARROS P, FONSECA J, SILVA L, MAUL A, YAMAMOTO T, MENEGUIM T, QUEIROZ L, TORIBIO T, MARTINI A, GOBATTO F & GONZÁLEZ M. 2017. Salt Heterogeneities Characterization in Pre-Salt Santos Basin Fields. In: OTC Brasil, Offshore Technology Conference. Rio de Janeiro, Brazil: IBP. doi: 10.4043/28147-MS.
BULHÕES FC, AMORIM GAS, BRUNO VL, FERREIRA GD, PEREIRA ES & CASTRO RF. 2014. Fluxo para construção do Modelo de Velocidade Regional da Bacia de Campos. In: VI Simpósio Brasileiro de Geofísica da SBGf. Porto Alegre, Brazilian Geophysical Society.
COBBOLD PR, SZATMARI P, DEMERCIAN LS, COELHO D & ROSSELLO EA. 1995. Seismic and experimental evidence for thin-skinned horizontal shortening by convergent radial gliding on evaporites, deep-water Santos Basin, Brazil. In: JACKSON MPA, ROBERTS DG & SNELSON S (Eds.). Salt Tectonics: A Global Perspective. American Association of Petroleum Geologists, Memoir, 65, 305–321.
COGAN M, ZDRAVEVA O, KAIRZHANOVA T & SCHOEMANN M. 2011. A wide-azimuth TTI model-building and imaging case study from the
central Gulf of Mexico. In: 81st Annual Meeting. San Antonio - TX, USA, SEG Technical Program Expanded Abstracts 2011, p. 4056–4060. Society of Exploration Geophysicists. doi: 10.1190/1.3628053. COOKE A, LE DIAGON F, DE MARCO R, AMAZONAS D, BUNTING T, MOLDOVEANU N, KLUG S & MATTOS E. 2012. Full-azimuth towed-streamer seismic: An exploration tool for pre-salt hydrocarbon exploration offshore Brazil. In: 82nd Annual Meeting. Las Vegas, Nevada, USA. SEG Technical Program Expanded Abstracts 2012, p. 1–5. Society of Exploration Geophysicists. doi: 10.1190/segan2012-1076.1. CORNELIUS S & CASTAGNA JP. 2018. Variation in salt-body interval velocities in the deepwater Gulf of Mexico: Keathley Canyon and Walker Ridge areas. Interpretation, 6(1): T15–T27. doi: 10.1190/INT-2017-0069.1.
COSTA AM & POIATE JR E. 2009. Rocha salina na indústria do petróleo: aspectos relacionados à reologia e à perfuração de rochas salinas. In: MOHRIAK W, SZATMARI P & ANJOS SMC (Eds.). Sal—Geologia e Tectônica—Exemplos nas Bacias Brasileiras. São Paulo, SP, Brazil: Beca Edições Ltda., p. 362–385.
DAVISON I. 2007. Geology and tectonics of the South Atlantic Brazilian salt basins. Geological Society, London. Special Publications. 272(1): 345–359. doi: 10.1144/SP363.8.
DAVISON I, ANDERSON L & NUTTALL P. Salt deposition, loading and gravity drainage in the Campos and Santos salt basins. In: ALSOP GI, ARCHER SG, HARTLEY AJ, GRANT NT & HODGKINSON R (Eds.). Salt Tectonics, Sediments and Prospectivity. Geological Society, London, Special Publications, 363(1): 159–174.
DEMERCIAN L. 1996. A halocinese na evolução do Sul da Bacia de Santos do Aptiano ao Cretáceo Superior. Master’s dissertation. Universidade Federal do Rio Grande do Sul. Brazil. 201 pp.
DEMERCIAN S, SZATMARI P & COBBOLD P. 1993. Style and pattern of salt diapirs due to thin-skinned gravitational gliding, Campos and Santos basins, offshore Brazil. Tectonophysics, 228(3-4): 393–433. doi: 10.1016/0040-1951(93)90351-J.
DIAS J, SAD A, FONTANA R & FEIJÓ F. 1994. Bacia de Pelotas. Boletim de Geociências da Petrobras, 8(1): 235–245.
DOOLEY TP, JACKSON MP, JACKSON CAL, HUDEC MR & RODRIGUEZ CR. 2015. Enigmatic structures within salt walls of the Santos Basin—Part 2: Mechanical explanation from physical modelling. Journal of Structural Geology, 75: 163–187. doi: 10.1016/j.jsg.2015.01. 009.
DUBRULE O. 2003. Geostatistics for seismic data integration in earth models. Volume 6. Society of Exploration Geophysicists and European Association of Geoscientists and Engineers. 273 pp.
FALCÃO L. 2017. O Sal Estratificado e sua Importância na Modelagem de Velocidades para Fins de Migração Sísmica. Master’s dissertation. UFF. Dinâmica Oceânica e Costeira. Niterói, RJ, Brazil. 91 pp.
FALCÃO L, MAUL A, GOBATTO F, GONZÁLEZ G & GONZÁLEZ MLA. 2016. Results of Incorporation Stratigraphy within the Evaporitic Sequence into the Velocity Field for Reservoir Characterization. Brazilian Journal of Geophysics, 34(3): 341–349. doi: 10.22564/rbgf.v34i3.829. FERREIRA GD, BULHÕES FC, AMORIM GA, LIMA LFD & FOLETTO RC. 2017. Construction of velocity model from Co-Kriging between wells and seismic. In: 15th International Congress of the Brazilian Geophysical Society. Expanded Abstracts. Rio de Janeiro, RJ, Brazil, p. 1828–1832. Brazilian Geophysical Society. doi: 10.1190/sbgf2017360.
FIDUK JC & ROWAN MG. 2012. Analysis of folding and deformation within layered evaporites in Blocks BM-S-8 &-9, Santos Basin, Brazil. In: ALSOP GI, ARCHER SG, HARTLEY AJ, GRANT NT & HODGKINSON R (Eds.). Salt Tectonics, Sediments and Prospectivity. Geological Society of London. 363(1): 471–487. Special Publications.
FONSECA JS, GOBATTO F, BOECHAT J, MAUL A, YAMAMOTO T, BORN E, TEIXEIRA L & GONZÁLEZ M. 2017. Dealing with Evaporitic Salts Section in Santos Basin during Geological Seismic Velocity Construction. In: 15th International Congress of the Brazilian Geophysical Society & EXPOGEF. Rio de Janeiro, Brazil, 31 July-3 August 2017, p. 1777–1781. Brazilian Geophysical Society. doi: 10. 1190/sbgf2017-350.
FONSECA JS, TEIXEIRA L, MAUL A, BARROS P, BORGES F, BOECHAT J & GONZÁLEZ M. 2018. Modelling Geological Layers into New Velocity Models for Seismic Migration Process-A Brazilian Pre-Salt Case. In: First EAGE/PESGB Workshop on Velocities. Expanded Abstracts, London, United Kingdom: EAGE/PESGB. doi: 10.3997/2214-4609. 201800010.
FREITAS JTR. 2006. Ciclos deposionais evaporíticos da bacia de santos uma análise cicloestratigráfica a partir de dados de 2 poços e de traços de sísmica. Master’s dissertation. UFRGS. Rio Grande do Sul, Brazil. 160 pp.
GAMBOA LAP, MACHADO MAP, DA SILVEIRA DP, DE FREITAS JTR, DA SILVA SRP, MOHRIAK W, SZATMARI P & ANJOS S. 2009. Evaporitos estratificados no Atlântico Sul: interpretação sísmica e controle tectono-estratigráfico na Bacia de Santos. In: MOHRIAK W, SZATMARI P & ANJOS SMC (Eds.). Sal: Geologia e Tectônica. São Paulo, p. 340–359. Beca Edições.
GE H, JACKSON MP & VENDEVILLE BC. 1997. Kinematics and dynamics of salt tectonics driven by progradation. AAPG Bulletin, 81(3): 398–423.
GEMMER L, INGS SJ, MEDVEDEV S & BEAUMONT C. 2004. Salt tectonics driven by differential sediment loading: stability analysis and finite-element experiments. Basin Research, 16(2): 199–218. GOBATTO F, MAUL A, TEIXEIRA L, GONZÁLEZ G, FALCÃO L, GONZÁLEZ M & BOECHAT JT. 2016. Refining velocity model within the salt section in Santos Basin: An innovative workflow to include the
existing stratification and its considerations. In: 86th Annual Meeting. Dallas, TX, USA. SEG Technical Program Expanded Abstracts 2016, p. 5328–5331. Society of Exploration Geophysicists. doi: 10.1190/ segam2016-13685489.1.
GONZÁLEZ G, MAUL A, JARDIM F, FALCÃO L, GOBATTO F & GONZÁLEZ M. 2018. Estimando incertidumbres sobre la amplitud sísmica para un yacimiento del Presal a través de mapas de iluminación. Geociencias Aplicadas Latinoamericanas, 4(1): 3–9. doi: 10.3997/2352-8281.20180003.
GONZÁLEZ M, GOBATTO F, MAUL A, FALCÃO L, GONZÁLEZ G, OLIVEIRA L, MENEGUIM T & AMARAL P. 2016. Proposed workflow to incorporate stratification within salt section using velocity and seismic attributes. In: Third EAGE/SBGf Workshop on Quantitative Seismic Interpretation of Lacustrine Carbonates. Expanded Abstracts. Rio de Janeiro, RJ, Brazil., EAGE/SBGf. doi: 10.3997/22144609.201600050. GUERRA MC & UNDERHILL JR. 2012. Role of halokinesis in controlling structural styles and sediment dispersal in the Santos Basin, offshore Brazil. In: ALSOP GI, ARCHER SG, HARTLEY AJ, GRANT NT & HODGKINSON R (Eds.). Salt Tectonics, Sediments and Prospectivity. Geological Society of London. 363(1): 175–206. doi: 10.1144/SP363.9. GUERRA MCM & SZATMARI P. 2009. Modelagem Física de Processos Halocinéticos. In: MOHRIAK W, SZATMARI P & ANJOS SMC (Eds.). Sal: Geologia e Tectônica. São Paulo, SP, Brazil: Beca Edições Ltda., p. 165–177.
GUO N & FAGIN S. 2002. Becoming Effective Velocity Model Builders and Depth Imagers, Part 2 – The Basics of Velocity-Model Building, Examples and Discussions. The Leading Edge, 21(12): 1210–1216. INGS S, BEAUMONT C & GEMMER L. 2004. Numerical modeling of salt tectonics on passive continental margins: Preliminary assessment of the effects of sediment loading, buoyancy, margin tilt, and isostasy. In: GCSSEPM. Expanded Abstracts. Bob F. Perkins, 24th Annual Research Conference, Houston, TX, USA. CD-ROM, p. 36–68.
JACKSON CAL, JACKSON MPA, HUDEC MR & RODRIGUEZ C. 2014. Internal structure, kinematics, and growth of a salt wall: Insights from 3-D seismic data. Geology, 42(4): 307–310. doi: 10.1130/G34865.1. JACKSON CAL, JACKSON MPA, HUDEC MR & RODRIGUEZ CR. 2015. Enigmatic structures within salt walls of the Santos Basin—Part 1: Geometry and kinematics from 3D seismic reflection and well data. Journal of Structural Geology, 75: 135–162. doi: 10.1016/j.jsg.2015.01. 010.
JARDIM F, MAUL A, FALCÃO L & GONZÁLEZ G. 2015. Estimating amplitude uncertainties through illumination studies for a pre-salt reservoir. In: 14th International Congress of the Brazilian Geophysical Society & EXPOGEF. Rio de Janeiro, Brazil, 3-6 August 2015, p. 817–821. Brazilian Geophysical Society. doi: 10.1190/sbgf2015-160.
JONES IF & DAVISON I. 2013. Seismic imaging in and around salt bodies: problems and pitfalls. In: 75th EAGE Conference & Exhibition. Expanded Abstracts. London, UK: Society of Exploration Geophysicists. doi: 10.1190/segam20140047.1.
JONES IF & DAVISON I. 2014. Seismic imaging in and around salt bodies. Interpretation, 2(4): SL1–SL20. doi: 10.1190/INT-2014-0033.1. JUSTEN JCR, VARGAS JR EA & DE SOUZA IAEALS. 2013. Análise das propriedades elásticas de rochas e minerais evaporíticos. In: 13th International Congress of the Brazilian Geophysical Society & EXPOGEF. Rio de Janeiro, Brazil, 26–29 August 2013, p. 1154–1158. Society of Exploration Geophysicists and Brazilian Geophysical Society. doi: 10.1190/sbgf2013-237.
KARNER GD & GAMBOA L. 2007. Timing and origin of the South Atlantic pre-salt sag basins and their capping evaporites. Geological Society, London, Special Publications, 285(1): 15-35. doi: 10.1144/SP285.2. KENDALL AC. 1988. Aspects of evaporite basin stratigraphy. In: SCHREIBER BC (Ed.). Evaporites and hydrocarbons. p. 11–65, New York: Columbia University Press.
LAURAIN R, GELIUS LJ, VINJE V & LECOMTE I. 2004a. A review of 3D illumination studies. Journal of Seismic Exploration, 13(1): 17–37. LAURAIN R, VINJE V & STRAND C. 2004b. Simulated migration amplitude for improving amplitude estimates in seismic illumination studies. The Leading Edge, 23(3): 240-245.
LERON A, MAGNERON C & SANDJIVY L. 2003. Spatial quality control of seismic stacking velocities using geostatistics. In: 65th EAGE Conference & Exhibition. Expanded Abstracts. Stavanger, Norway. MAUL A, FALCÃO L, GOBATTO F, NOVELLINO V, JARDIM F, OLIVEIRA L, MENEGUIM T, AMARAL PJ, BORGES F & TEIXEIRA L. 2016. Incorporação de Estratificações dentro da Seção Evaporítica utilizando Velocidades e Atributos Sísmicos. Informe Geofísico da Petrobras, 152. MAUL A, FONSECA J, TEIXEIRA L, BARROS P, BOECHAT J, NUNES JP, YAMAMOTO T, GONZÁLEZ M & GONZÁLEZ G. 2018a. Modelling intra-salt layers when building velocity models for depth migration Examples of the Santos Basins, Brazilian offshore. In: 88th Annual Meeting. Anaheim – CA, USA. SEG Technical Program Expanded Abstracts 2018, p. 3764–3767. Society of Exploration Geophysicists. doi: 10.1190/segam2018-2996209.1.
MAUL A, SANTOS MAC & SILVA CG. 2018b. Evaporitic Section Characterization and Its Impacts over the Pre-Salt Reservoirs, Examples in Santos Basin, Offshore. In: 19th Rio Oil & Gas. Expanded Abstracts, IBP, Rio de Janeiro, RJ, Brazil.
MAUL ARM, JARDIM FJS, FALCÃO LFF & GONZÁLEZ GAGS. 2015. Observing Amplitude Uncertainties for a Pre-salt Reservoirs using Illumination Study (Hit-maps). In: 77th EAGE Conference and Exhibition. Expanded Abstracts. Madrid, Spain. doi: 10.3997/2214-4609.201412921.
MENEGUIM TB, MENDES SC, MAUL AR, FERNANDES LF, FARIAS MG & GONZÁLEZ G. 2015. Combining seismic facies analysis and well Information to guide new interval velocity models for a Pre-Salt study, Santos Basin, Brazil. In: 14th International Congress of the Brazilian Geophysical Society. p. 1365–1368. Brazilian Geophysical Society. doi: 10.1190/sbgf2015-271.
MOHRIAK W, NEMCOK M & ENCISO G. 2008. South Atlantic divergent margin evolution: rift-border uplift and salt tectonics in the basins of SE Brazil. Geological Society, London, Special Publications, 294(1): 365–398.
OLIVEIRA LC, FERNANDES LF, MAUL AR, ROSSETO JA, DE LOS ANGELES GONZALEZ FARIAS M & SANCHEZ GG. 2015. Geological Velocity Approach in order to obtain a Detailed Velocity Model for the Evaporitic Section–Santos Basin. In: 14th International Congress of the Brazilian Geophysical Society & EXPOGEF. Rio de Janeiro, Brazil, 3-6 August 2015, p. 1374–1377. Brazilian Geophysical Society. doi: 10.1190/sbgf2015-273.
POIATE JR E. 2012. Mecânica das rochas e mecânica computacional para projetos de poços de petróleo em zonas de sal. Ph.D. thesis. Departamento de Engenharia Civil, Pontifícia Universidade Católica do Rio de Janeiro (PUC-Rio), Brazil. 462 pp.
POMBO E, KAZZUO C, FREITAS F, CARVALHO A, MAUL A & GONZÁLEZ M. 2017. Velocity Models Building (Geological and Tomographic Process Updates Emphasis). In: 15th International Congress of the Brazilian Geophysical Society & EXPOGEF. Rio de Janeiro, Brazil, 31 July-3 August 2017, p. 1773–1776. Brazilian Geophysical Society. doi: 10.1190/sbgf2017-349.
PRATT R, SONG ZM, WILLIAMSON P & WARNER M. 1996. Two-dimensional velocity models from wide-angle seismic data by wavefield inversion. Geophysical Journal International, 124(2): 323–340. doi: 10.1111/j.1365-246X.1996.tb07023.x.
RAYMER D, KENDALL J, BEAUDOIN M, MUELLER M & KENDALL R. 1999. Measuring the anisotropy of salt in the Mahogany oil field, Gulf of Mexico. In: AAPG International Conference and Exhibition. p. 100–103. RAYMER DG, TOMMASI A & KENDALL JM. 2000. Predicting the seismic implications of salt anisotropy using numerical simulations of halite deformation. Geophysics, 65(4): 1272–1280. doi: 10.1190/1.1444818. RITTER G. 2011. Migração e Modelagem de Dados Sísmicos de Ondas Planas por Feixes Gaussianos. Ph.D. thesis. COPPE/UFRJ – Engenharia Civil. Rio de Janeiro, RJ, Brazil. 110 pp.
ROBEIN E. 2003. Velocities, Time-Imaging and Depth-Imaging in Reflection Seismic: Principles and Methods. EAGE. 464 pp.
SANDJIVY L, LÉRON A & TORRES O. 2003. Improving time migration velocity fields using geostatistics. In: 8th International Congress of the Brazilian Geophysical Society. Rio de Janeiro, RJ, Brazil.
SCHREIBER BC, BABEL M & LUGLI S. 2007. An Overview of Evaporite Puzzles. In: SCHREIBER BC, BABEL M & LUGLI S (Eds.). Evaporites through Space and Time. Geological Society of London, Special Publications. 285(1): 364. doi: 10.1144/SP285.2.
SEIFERT I, PENNA R, MAUL A & GONZÁLEZ M. 2017. Accurate Velocity Model Refinement through the use of Acoustic Impedance for Evaporite Seismic Facies differentiation of Pre-Salt Reservoir Prospects in Santos Basin. In: 15th International Congress of the Brazilian Geophysical Society. Rio de Janeiro, RJ, Brazil, p. 1782–1786. Brazilian Geophysical Society. doi: 10.1190/sbgf2017-351.
SZATMARI P, GUERRA M & PEQUENO M. 1996. Genesis of large counter-regional normal fault by flow of Cretaceous salt in the South Atlantic Santos Basin, Brazil. Geological Society, London, Special Publications, 100(1): 259–264.
TEIXEIRA L, GOBATTO F, MAUL A, CRUZ NM & LAQUINI. 2017. Rock Physics and Seismic Inversion to identify stratification within salt section supporting velocity, facies modeling and geomechanical analysis. In: 15th International Congress of the Brazilian Geophysical Society. Rio de Janeiro, RJ, Brazil, p. 5–10. Brazilian Geophysical Society. doi: 10.1190/sbgf2017-002.
TEIXEIRA L, NUNES J, MAUL A, FONSECA J, BARROS P & BORGES F. 2018. Seismic-Based Salt Characterisation for Geomechanical Modelling of a Presalt Reservoir. In: 80th EAGE Conference and
Exhibition 2018. Copenhagen, Denmark. doi: 10.3997/2214-4609. 201801331.
TORÍBIO T, QUEIROZ LE, TEIXEIRA L, YAMAMOTO T, MENEGUIM T, LEONARDI O, CORTEZ M, RELVAS MT, MOLITERNO AM, TARTARINI A, FONSECA J & MAUL A. 2017. Characterizing Evaporitic Section and Geomechanical Properties using Seismic Inversion, a Case Study for Santos Basin. In: 15th International Congress of the Brazilian Geophysical Society. Brazilian Geophysical Society. doi: 10.1190/ sbgf2017-226.
YAMAMOTO T, MAUL A, BORN E, GOBATTO F, CAMPOS MT & GONZÁLES M. 2016. Incorporação de Estratificações Salíferas na Modelagem de Velocidade de uma Jazida da Bacia de Santos. In: VII Simpósio Brasileiro de Geofísica. Ouro Preto–MG, Brazil. CD-ROM. YILMAZ Ö. 2001. Seismic data analysis: Processing, inversion, and interpretation of seismic data. Society of Exploration Geophysicists. doi: 10.4043/22827-MS.
ZDRAVEVA O, WOODWARD M, NICHOLS D & OSYPOV K. 2011. Building Anisotropic Models for Depth Imaging: comparing different approaches. In: 12th International Congress of the Brazilian Geophysical Society. Expanded Abstracts. Rio de Janeiro, RJ, Brazil. Society of Exploration Geophysicists and Brazilian Geophysical Society. doi: 10. 4043/22827-MS.
Recebido em 10 abril, 2018 / Aceito em 13 agosto, 2018 Received on April 10, 2018 / Accepted on August 13, 2018