1Centro de Estudos de Geologia Costeira e Oceânica, Instituto de Geociências, Universidade Federal do Rio Grande do Sul – UFRGS, Porto Alegre (RS), Brasil.
E-mails: [email protected], [email protected], [email protected], [email protected]
2Abreu Consulting and Training, Houston, Texas, United States. E-mail: [email protected]
*Corresponding author.
Manuscript ID: 20160138. Received in: 12/07/2016. Approved in: 04/28/2017. ABSTRACT: he aim of this work was to analyze the sedimentary record of the coastal plain of Pelotas Basin, placing it in the context of temporal and spatial scales, and proposing a stratigraphic hierar-chical framework.he coastal plain, located in southern Brazil and in northern Uruguay, is mainly formed by four Quaternary barri-er-lagoon systems. hree of these systems were studied through the integration of surface and subsurface data (geomorphological and topographical mapping, outcrops description, geoprocessing, dating and Ground Penetrating Radar — GPR — records) and interpreted as the preserved, onshore portion of depositional sequences main-ly controlled by glacioeustatic cycles of about 100 kyr. he stacking pattern comprising these sequences is progradational with seaward downsteping (highest sea-levels measured: 9.5, 8 and 3 m, respective-ly), comprehending a degradational sequence set, or the regressive/ falling stage systems tract of a higher order depositional sequence identiied in seismic sections, with about 0.5 Ma. he youngest se-quence has diachronous systems tracts — while some sectors have already transitioned from the transgressive to the highstand/falling stage systems tract, others are still under a transgressive context. It in-dicates that, in this time and scale, the sea level is not the main con-trol of coastal evolution, and autogenic factors are fundamental in the run of geological record.
KEYWORDS: Barrier-Lagoon; Glacioeustasy; Diachronism of Systems Tracts; Ground Penetrating Radar; Rio Grande do Sul coastal evolution.
RESUMO: O objetivo deste trabalho foi analisar o registro sedimentar da Bacia de Pelotas, contextualizando-o em escalas temporais e espaciais e propondo um arcabouço estratigráico hierarquizado. A planície costeira, localizada no Sul do Brasil e Norte do Uruguai, é principalmente for-mada por quatro sistemas deposicionais do tipo laguna-barreira. Os três sistemas mais jovens foram estudados por meio da integração de dados de superfície e de subsuperfície (mapeamento geomorfológico e topográ-ico, descrição de aloramentos, geoprocessamento, datações e registros de georradar) e interpretados como a porção costeira, preservada, de sequên-cias deposicionais controladas principalmente por ciclos glacioeustáticos da ordem de 100 ka. O padrão de empilhamento das três sequências, em conjunto, é progradacional com altitudes mais baixas no sentido do oceano (máximos níveis do mar medidos: 9,5, 8 e 3 m, respectivamen-te), correspondendo a um conjunto de sequências degradacionais, ou ao trato de sistemas regressivos/nível em queda de uma sequência de maior ordem, identiicada em seções sísmicas, com aproximadamente 0,5 Ma. A sequência mais jovem possui tratos de sistemas diácronos — enquanto alguns setores já possuem o registro do trato de sistemas de nível alto/em queda, outros ainda se encontram em contexto transgressivo. Isso indi-ca que nesse tempo e esindi-cala o nível do mar não representa o principal controle da evolução costeira, e fatores autogênicos são fundamentais no desenvolvimento do registro geológico.
PALAVRAS-CHAVE: Laguna-Barreira; glacioeustasia; diacronismo dos tratos de sistemas; georradar; evolução costeira do Rio Grande do Sul.
High-Frequency Sequences in the
Quaternary of Pelotas Basin (coastal plain):
a record of degradational stacking as a
function of longer-term base-level fall
Sequências deposicionais de alta frequência no Quaternário da Bacia
de Pelotas (planície costeira): registro de empilhamento degradacional
em função de queda do nível de base em longo período
Maria Luiza Correa da Camara Rosa1*, Eduardo Guimarães Barboza1,
INTRODUCTION
Sequence stratigraphy is a method used to build strati-graphic frameworks and examine the geological record of sedimentary basins through the deinition and mapping of coeval, genetically related packages of rock, emerging from the works of Blackwelder (1909), Grabau (1913), Sloss et al. (1949), Vail et al. (1977), Van Wagoner et al. (1988), among others. Sequence stratigraphy has evolved from seismic stratigraphy (Payton 1977) and established itself as a revolutionary paradigm for the understanding of stratigraphic record (Wilgus et al. 1988), mostly due to the demand and technological development of the oil indus-try and pioneer work of Sloss et al. (1949). Sequence stra-tigraphy can be used in the analysis of the record in difer-ent hierarchical ranks, from the great stages of sedimdifer-entary basin illing to the evolution of depositional environments (Posamentier et al. 1992; Schlager 2009; Catuneanu 2002; Neal & Abreu 2009).
he Pelotas Basin coastal plain, located in Rio Grande do Sul and Santa Catarina states, in southern Brazil and in northern Uruguay, has the most complete record of Quaternary events
along the Brazilian coast (Fig. 1). his plain, with 770 km of extension and 15 to 100 km wide, is formed by alluvial fan systems and by the lateral juxtaposition of four barrier-lagoon depositional systems, irstly deined for Rio Grande do Sul by Villwock et al. (1986). Such systems have evolved during the Upper Quaternary, due to the combination of allochthonous and autochthonous processes, such as the eustasy (Delaney 1965; Villwock & Tomazelli 1995; Tomazelli & Villwock 1996), tectonics (Rosa et al. 2009), climate (Martinho et al. 2008, 2010; Lopes et al. 2013), coastal dynamics, and sedi-mentary budget (Toldo Jr. et al. 1999, 2004, 2005; Dillenburg et al. 2000, 2009; Gruber et al. 2003, 2006; Dillenburg & Barboza 2014). hus, the understanding of the geological development of the coastal plain can be improved through the application of sequence stratigraphy.
herefore, this work aimed at examining and organizing the fragmented sedimentary record of the coastal plain of Pelotas Basin, discussing scale issues, placing it in the context of the particular temporal and spatial scales, and proposing a stratigraphic framework to connect scales. Moreover, through the stratigraphic analysis we intended to show the diachronous nature of stratigraphic surfaces and systems tracts.
55ºW
Continental Shelf Continental Slope Continental rise/ abyssal plain Cenozoic sediments Volcanic rocks Gondwanic sediments (Paleozoic-Mesozoic) Precambrian shield Basement highs Fractures Faults
0 100 200 km N
30ºS
35ºS
40ºW 45ºW
50ºW
GEOLOGICAL SETTING
In order to contextualize the coastal plain record and link large scale — regional and long-term trends — to short scale — high-frequency events afected by climate and local coastal processes — we started positioning the geological record through a hierarchical framework for the entire basin ill, from Cretaceous to Quaternary. his framework resulted from the analysis of the main studies related to the evolu-tion of Pelotas Basin detailed ahead.
Pelotas Basin is located in the extreme south of the Brazilian Continental Margin (Fig. 1), and has an area of approximately 210,000 km2. It borders Santos Basin
to the north, through Florianópolis High (Gamboa & Rabinowitz 1981), and Punta Del Este Basin to the south, through Polonio High, in Uruguay (Urien & Martins 1978). The Pelotas Basin was formed due to tectonic movements associated with the opening of the South Atlantic Ocean (Asmus & Porto 1972). The basement is composed of Uruguayan-Sul-Rio-Grandense Shield, Santa Catarina Shield and Paraná Basin strata. Main stages of the basin filling are summarized in Figure 2, based on the works of Fontana (1996), Abreu (1998), Bueno et al. (2007), Neal and Abreu (2009), and Abreu et al. (2010).
Low-Frequency Sedimentary Record:
Pelotas Basin
According to Fontana (1996), the Pelotas Basin can be divided into three major phases (Fig. 2). hese phases would include the formation of a Rift Megasequence, developed in the early stages of opening, followed by a Transgressive Megasequence that started in the Aptian, and a Regressive Megasequence, which evolved since the Paleocene. hese three megasequences were subdivided into 17 depositional sequences, ive belonging to the transgressive phase and 12 to the regressive phase.
According to Bueno et al. (2007), main phases of basin illing are the Pre-rift, Rift, Post-rift and Drift Supersequences (Fig. 2). he Pre-rift Supersequence is related to magmatic processes that occurred prior to the initial stages of rifting, with the generation of thick volcanic lows (Serra Geral Formation). Continental magmatism was emplaced between 138 and 127 Ma, with peak at around 132 Ma (Stewart et al. 1996; Bueno et al. 2007).
The Rift Supersequence can be divided into two stages, Rift I, with a predominance of basalts (Imbituba Formation), and Rift II, with siliciclastic deposition (Cassino Formation). his phase consists of illing anti-thetical half grabens approximately 125 Ma. he Post-rift Supersequence is composed of the volcanic suite of
the Curumim Formation (basalts, andesites, traquian-desites), alternated with lacustrine sediments grading to marine limestones and sandstones. Volcanic units com-prising the oceanic crust are represented by seaward dip-ping relections identiied on seismic sections (Fontana 1996; Abreu 1998). According to Bueno et al. (2007), the continuation of the opening process led to the Drift Supersequence, which was divided into three phases: initial (shallow shelf ), intermediate (transgressive) and inal (regressive wedge). Bueno et al. (2007) interpreted 12 depositional sequences in the transgressive phase and four in the regressive phase, forming a siliciclastic wedge (Cidreira and Imbé formations) from the Miocene to the Holocene.
In Abreu (1998), 1,500 km of seismic sections were interpreted in Pelotas Basin and 3,000 km in the con-jugate Walvis Basin in West Africa. These seismic lines have been integrated with core data in an attempt to correlate the existing record on both sides. In this work, Pelotas Basin has been divided into four units (Fig. 2): Basement, Transgressive phase (Aptian-Turonian), Aggradational phase (Coniacian-Eocene) and Regressive phase (Oligocene-Recent). The resulting stratigraphic framework is composed of 56 depositional sequences, in which 18 are Cretaceous and 38 are Cenozoic. The mean duration of sequences was determined based on biostratigraphy.
Low- and Medium-Frequency Sedimentary
Record: Accommodation Succession
In Abreu et al. (2010), the stratigraphic framework established by Abreu (1998) for Pelotas Basin was used to apply the Accommodation Succession Method proposed by Neal and Abreu (2009). According to this method, sequence stratigraphic units and key-surfaces are deined regardless the time of duration, controlling mechanisms, or magni-tude of the events. hus, resulting sedimentary architecture identiied to deine sedimentary packages solely depends on two factors: on the rate of changes in accommodation and on sediment supply.
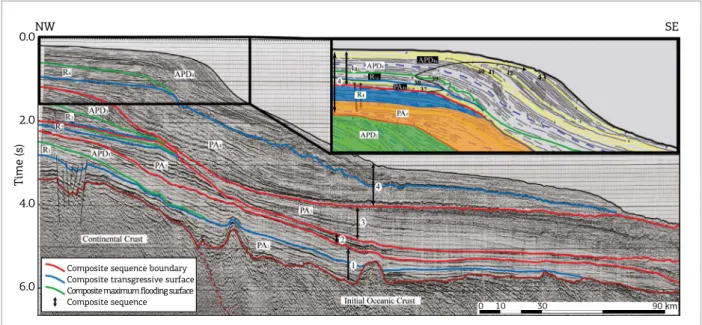
On the hierarchical framework of Abreu et al. (2010), four composite sequences were established for the Pelotas Basin (Fig. 3). Each composite sequence is formed by three sequence sets, deined according to their stacking pattern as Progradational-Aggradational (PA), Retrogradational (R) and Aggradational-Progradational-Degradational (APD). hus, 12 sequence sets compose the basin illing (Fig. 3).
Ma
0 5 10 15 20 25 30 35 40 45 50 55 60 65 70 75 80 85 90 95 100 105 110 115 120 125 130 135 140
Erathem System Series
Stage
Based on Fontana (1996) Phases &
Trends Seqs.
Based on Abreu (1998), Neal &
Abreu (2009) and Abreu et al. (2010) Based on Bueno et al. (2007) Eustatic
curves Phase
Comp. Sequenc.
Sets
Comp.
seqs.Sequen.Sets Seqs. Phases &Trends Seqs. magmatismTectonic &
T
ermal subsidence
Magmatic Eocene event
Driſt
Post-riſt 113 Ma
118 Ma Riſt
125 Ma 127 Ma
Pre-Riſte 138 Ma
Syneclise Ma
0
5
10
15
20
25
30
35
40
45
50
55
60
65
70
75
80
85
90
95
100
105
110
115
120
125
130
135
140 17
16
15 14 13
12
11
10
9
8
7
6
5
4
3
2
1
Geologic Time Scale: ICS, 2013
R: retrogradational; PA: progradational-aggradational APD: aggradational-progradational-degradational; SB: sequence boundary; TS: transgressive surface; MFS: maximum flooding surface.
same patterns, resulting in PA4a, R4a and APD4a (Figs. 2 and 3). hus, the record that regards the upper portion of the basin has the APD pattern, and the last sequences jointly have a degradational architecture.
According to Abreu (1998), the last sequence boundary (no. 43) found in the seismic section is about 0.5 Ma. he age of this sequence corresponds to the existing Quaternary sed-imentary record onshore, in which it is possible to interpret that this sequence is in fact composed of higher frequency sequences. As discussed ahead, these are partially represented in the onshore portion of the Pelotas Basin by the record of coastal plain depositional systems.
High-Frequency Sedimentary
Record: Barrier-lagoon Systems
he coastal plain is a physiographic feature correspond-ing to the onshore portion of the Pelotas Basin (Villwock 1984). Younger deposits of the basin ill are exposed, con-sisting predominantly of alluvial fans near the basement, and of four barrier-lagoon depositional systems (Fig. 4). Pioneer studies of these depositional systems were devel-oped in the coastal plain Rio Grande do Sul by Backeuser (1918), Lamengo (1940), Rambo (1942), Delaney (1965), Jost (1971) and Villwock (1972).
According to Villwock et al. (1986), these depositional systems were controlled by glacioeustasy with resulting trans-gressive-regressive cycles. Also, tectonics (Rosa et al. 2009), climate, coastal dynamic processes, and sedimentary budget
(Toldo Jr. et al. 1999, 2004, 2005; Dillenburg et al. 2000, 2009; Gruber et al. 2003, 2006; Martinho et al. 2008, 2009, 2010; Lopes et al. 2013; Dillenburg & Barboza 2014) have controlled the creation and illing of accommodation. In this paper, we reviewed the age and sequence stratigraphic evolu-tion of Systems II through IV. System I, which outcrops in the inner most position of the coastal plain and has almost 100 m of altitude, is not yet as well studied as the other sys-tems and was not addressed in this paper.
he ages of the Barrier-lagoon Systems I through IV (400, 325, 125 and 7 ka to recent) have been irst suggested by Villwock and Tomazelli (1995), based on oxygen isotope stages deined by Shackleton and Opdyke (1973) and Imbrie et al. (1984). hese systems are interpreted to represent peri-ods of high sea level, which Villwock and Tomazelli (1995) correlated to isotope stages 11, 9, 5 and 1, respectively. hese correlations were conirmed for Systems III and IV by 14C and
thermoluminescence dating (Poupeau et al. 1988; Tomazelli et al. 1998; Buchmann & Tomazelli 2003; Dillenburg et al. 2006,ore recent work indicated that System II was developed in response to transgression related to the oxygen isotope stage 7, instead of stage 9, based on thermoluminescence ages in quartzose deposits and electron spin resonance ages in fossil teeth (Lopes et al. 2010, 2014). hen, according to these authors, System II was deposited around 200 ka, and Barrier I is likely to be correlated to stage 9 (Fig. 5).
The evolution of these systems was initially defined mainly based on geomorphological observations, as
T
ime (s)
0.0
2.0
4.0
6.0
NW SE
Composite sequence boundary Composite transgressive surface
Composite maximum flooding surface
Composite sequence 0 10 30 90 km
Figure 3. Seismic section of the Pelotas Basin with four composite sequences, each formed by three sequence sets (Abreu et al. 2010). Sequence stratigraphic hierarchy of the last sequence set (APD4) of the Pelotas Basin shows the same patterns on a more detailed scale (interpreted based on the work of Abreu 1998, Neal & Abreu 2009, Abreu et al. 2010). The numbers indicated in the zoom in igure (yellow lines) correspond to the sequence
well as on sedimentological data from outcrops and boreholes. More recently, high-resolution seismic and Ground Penetrating Radar (GPR) enabled a more con-tinuous view of the depositional architecture and pro-vided key-observations to further the understanding
of the evolution of these systems (Weschenfelder et al. 2005, 2014; Barboza et al. 2009, 2011, 2013, 2014; Silva 2011, 2015; Silva et al. 2010, 2014; Fracalossi et al. 2010; Rosa 2012; Lima et al. 2013; Leal et al. 2016; Oliveira et al. 2016).
Holocene Barrier IV
Pleistocene Barrier III (last interglacial barrier) Pleistocene Barrier II
Pleistocene Barrier I Pleistocene and Holocene lagoon systems
Alluvial fan systems
Precambrian basement
Paleozoic basement
Platina facies
Biodetritic facies
Mudflat deep facies
Mudflat slope facies
Mudflat platform facies
Patos facies
Sandy facies Aſter
Tomazelli (1978)
Tomazelli & Villwock (1996) N
0 50 100 km
GPR and seismic
Schematic sections
Figure 4. Simpliied geological map of the coastal plain of Pelotas Basin, depicting the spatial distribution of
the alluvial fans and barrier-lagoon systems in the emerged portion and facies of continental shelf and slope
Porto Alegre
I II
III
IV I
?
II III IV
N
20 km
d
18O (s) 0 -2
2
400 300 200 100 0
Age (ka) Age (ka)
11
10 9
8 7
6 5
2 1
MIS7e
MIS5e
MIS1
9 ± 1 8 ± 1
3 ± 1
230 135 125 24 5/7 0
Alluvial fan systems
Pleistocene barrier-lagoon systems
Holocene barrier-lagoon system
Shoreline trajectory
Resulting trend
A B
MIS9?
325 ka? 230 kaMIS7e
+ 9.5 m
MIS5e 125 ka + 8 m
MIS1 8 ka + 3 m
Sea level
lowest level - 120 m
100 km
? ? ?
System
IV
III
II
I
Age dating and main references Interpreted
age
Minimum highest sea level
Isotope stage
8.2 ka (Silva 2011), 7.8 to 2.9 ka (Dillenburg et al. 2013), 7.7 to 4.3 ka (Dillenburg et al. 2006, 2007, 2009), 6.6 ka (Travessas et al. 2005), 4.4 ka (Tomazelli et al. 1998), 3.2 ka (Dillenburg et al. 2004), 4.4 to 1.1 ka (Martinho et al. 2008)
8 to 0 ka 3 m 1
85 ka with a 30% precision (Poupeau et al. 1988),
109 ka (Buchmann and Tomazelli 2003) 125 ka 8 m 5e
226 ka (Lopes et al. 2010),
214 to 240 ka (Lopes et al. 2014) 230 ka 9.5 m 7e
325 ka
– ? 9
sea-lev
el amplitude (m)
10
5
0
50
100
150
MATERIALS AND METHODS
he stratigraphic analysis performed is based on the integration of surface and subsurface data. Interpretations obtained from main studies summarizing the current under-standing of the Pelotas Basin were integrated with new data, including geomorphological and topographical mapping, out-crops description, geoprocessing, and GPR records. Remote sensing and ield data were organized and integrated into a Geographic Information System (GIS), using ArcGIS©
platform. Optical images from Landsat 7 and 8, SPOT 5, QuickBird and RapidEye, as well as the topographic model of Shuttle Radar Topography Mission (SRTM) and ASTER Satellite, were the bases of the GIS project. he Global Navigation Satellite System (GNSS) was utilized to position ield data, using the equipment Trimble®
ProXRT (WGS84 datum), and the diferential method.
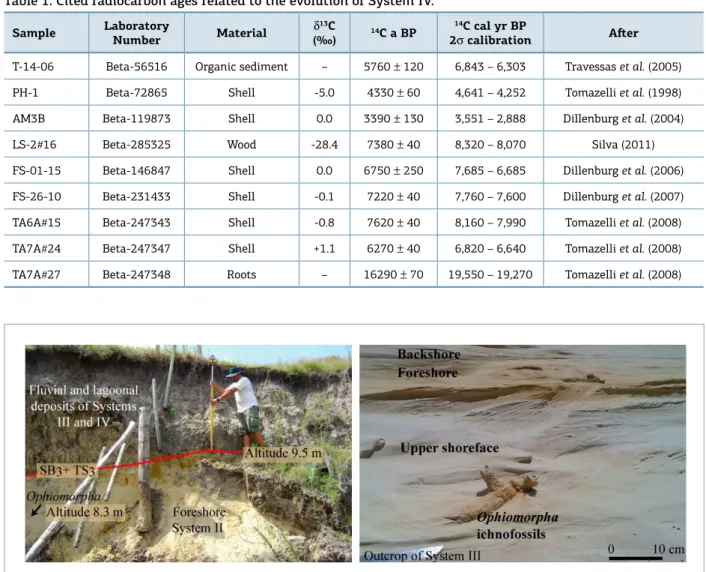
Detailed topographic measurements were performed in order to establish the relative position of maximum sea level related to each system. Altitude measurements were based on paleo indicators, consisting of the combination of sedi-mentary structures generated on the beach face, the occur-rence of Ophiomorpha ichnofossils, and the vertical facies succession. As discussed by many authors (Frey et al. 1978; Tomazelli et al. 1982; Pollard et al. 1993; Gibert et al. 2006), Ophiomorpha nodosa forms a complex 3D structure that can be extend in depth. Vertical shafts with thick-lined, narrower and not pelleted burrows correspond to the best indication of water-sediment interface (Gibert et al. 2006). As this fea-ture was not easily identiiable at the measured outcrops, the combination of Ophiomorpha with sand deposits con-taining low-angle planar cross-stratiication was related to foreshore. Considering the actual coast is microtidal, with semidiurnal mean range of only 0.5 m, the maximum alti-tudes of Ophiomorpha occurrence and the top of foreshore deposits were leveled, resulting in the minimum highest sea-level position for each evaluated system. he altitudes are considered the minimum in view of possible erosion.
he altitude of the paleo sea levels in each locality were referenced to the mean low tide determined by the tide gauge of Imbituba vertical datum, which is considered today’s zero sea level along the Brazilian margin. Two methods were used to perform this reference: trigonometric leveling and satellite positioning. In System II, topography measurements were carried out in the southern region of the coastal plain, where it is well preserved (Fig. 6). Leveling was based on a reference given by the Brazilian Institute of Geography and Statistics (IBGE — RN1968U) at an altitude of 13.6217 m, and the stations were leveled with a Zeiss Elta 50 Total Station. Diferential GNSS measurements were performed for the same type of features of Systems II and III. he model applied
to convert ellipsoidal to geoidal altitude is MAPGEO2010, provided by the IBGE.
he GPR proiles were collected with a GSSI™ (Geophysical Survey Systems, Inc.) SIR-3000 with antennas of 200, 400 MHz (monostatic — GSSI™), 80 and 124 MHz (Subecho SE-70 and SE-150 bistatic — Radarteam Sweden AB). he GPR system was connected to the GNSS allowing the topographic positioning of the survey. he data were acquired in the com-mon ofset method, with 32 stacks for each trace to improve the signal-to-noise ratio, and varying the depth of investiga-tion according to the penetrainvestiga-tion from about 300 to 1,000 ns of two-way travel time (TWTT). Considering the dielectric constant for sand (10), representing a velocity of 0.09 m/ns (Davis & Annan 1989), the depth of investigation ranged from about 15 to 45 m. his dielectric constant was vali-dated using lithological data obtained from SPT drill holes (Dillenburg et al. 2011). Trace stacking, frequency and gain ilters were applied during the collection to reduce noise and enable real time data viewing. he records were post-processed with the software packages Radan™, Relex Win®
and Prism 2®
. Data processing comprised time-zero adjustment, back-ground removal, band-pass frequency ilters, gain equaliza-tion, time-to-depth conversion, and topographic corrections. A total of 220 km of GPR data were obtained in both dip and strike directions, along Systems II, III and IV.
he stratigraphic interpretation was based on the method of seismostratigraphy (Payton 1977). he method was based on termination (onlap, downlap, toplap and truncations), geometry and pattern of the relections to interpret units and surfaces (Mitchum Jr. et al. 1977; Vail et al. 1977; Neal 2004; Catuneanu 2002; Catuneanu et al. 2009; Abreu et al. 2010; Barboza et al. 2009, 2011). GPR units are determined based on its internal coniguration and geometry, allowing the deinition of radarfacies and packages. he main radar-facies and its interpretation related to the depositional envi-ronment are well deined for the coastal plain of Pelotas Basin (Barboza et al. 2009, 2011).
he radiocarbon ages mentioned in this paper are related to the evolution of System IV, resulting from the works of Tomazelli et al. (1998, 2008), Dillenburg et al. (2004, 2006, 2007), Travessas et al. (2005), and Silva (2011). he samples were collected in standard penetrating test (SPT) cores and outcrops, and analyzed by Beta Analytic Inc., corresponding to six mollusk shell samples, one piece of wood, one sam-ple of root and one samsam-ple of organic sediment (Table 1).
RESULTS
Northern Proile
NW SE
60
40
20
0
0 5 10 15 20 25 30 35 40 45 50 55 60 65 70 75 80 km
System I System II System III System IV
Lag I
Barrier I
Lagoonal II
Barrier II Lag III
Barrier III
Lag IV Barrier IV
Southern Profile
NW SE
System II System III
System IV System IV
Lagoonal II/III
Lagoonal III
Lagoonal IV Lagoonal IV
Barrier II
Barrier III
Barrier IV Unit
Barrier I – BI
Barrier II – BII
Barrier III – BIII
Barrier IV – BIV Altitude of paleo sea-level indicators (m) Altitude (m)
600
0 0 25 50 km
N
24
16
8
0
0 5 10 15 20 25 km
Figure 6. Digital surface model (version 4 of Shuttle Radar Topography Mission) with Barriers I to IV outlined. In detail the color composition of the southern region of the coastal plain, combining altitude, slope and aspect images (RGB). Barriers and lagoon spits morphologies of the southern coastal plain are highlighted in the zoom
image. Topographic proiles were created based on the digital elevation model of Shuttle Radar Topography Mission (version 4). Steps in elevation diferentiate Systems II (higher), III and IV (lower, still active). The altitude
Table 1. Cited radiocarbon ages related to the evolution of System IV.
Sample Laboratory
Number Material
δ13C (‰)
14C a BP 14C cal yr BP
2σ calibration Ater
T-14-06 Beta-56516 Organic sediment – 5760 ± 120 6,843 – 6,303 Travessas et al. (2005)
PH-1 Beta-72865 Shell -5.0 4330 ± 60 4,641 – 4,252 Tomazelli et al. (1998)
AM3B Beta-119873 Shell 0.0 3390 ± 130 3,551 – 2,888 Dillenburg et al. (2004)
LS-2#16 Beta-285325 Wood -28.4 7380 ± 40 8,320 – 8,070 Silva (2011)
FS-01-15 Beta-146847 Shell 0.0 6750 ± 250 7,685 – 6,685 Dillenburg et al. (2006)
FS-26-10 Beta-231433 Shell -0.1 7220 ± 40 7,760 – 7,600 Dillenburg et al. (2007)
TA6A#15 Beta-247343 Shell -0.8 7620 ± 40 8,160 – 7,990 Tomazelli et al. (2008)
TA7A#24 Beta-247347 Shell +1.1 6270 ± 40 6,820 – 6,640 Tomazelli et al. (2008)
TA7A#27 Beta-247348 Roots – 16290 ± 70 19,550 – 19,270 Tomazelli et al. (2008)
he geomorphological analysis allows distinguishing the main units which compose the coastal plain: barriers and lagoons. Barriers can achieve altitudes of almost 30 m, with the exception of Barrier I, which is almost 100 m high in the north of the coastal plain in response of aeolian cover-ing of the bedrock. Barriers have undulatcover-ing surfaces related to aeolian activity in contrast with lagoonal features, which are plan or composed of distinguishing elongate curved spits (Fig. 6). As barriers are higher, dryer and mainly composed of sand, they tend to appear brighter in comparison with lagoonal deposits, and are easily to discriminate in remote sense images.
Topographic proiles from System I to IV show that together they are at progressively lower altitudes (Figs. 5 and 6). Outcrops measurements allowed deining the alti-tudes of paleo sea level along Barriers II and III, which have good exposures along the coastal plain. In the south
of the coastal plain, the top of the beach and the base of the aeolian deposits of System II resulted in altitudes ranging from 8.1 to 9.5 m, with a maximum altitude of 8.3 m for Ophiomorpha occurrence (Fig. 7).
For System III, in the southern of the coastal plain, Ophiomorpha occurrence has a maximum altitude of 3.6 m and the top of foreshore is at 4.2 m. On the north coast, the measurements of these ichnofossils vary from 5 to 7 m of altitude, and the top of foreshore is at 7.2 m. In another out-crop on the north coast, also related to System III, Tomazelli and Dillenburg (2007) measured two diferent levels on the top of Ophiomorpha occurrence, one of 5.1 and other of 7.7 m, where the top of foreshore is at 8.0 m. As mentioned in the methods section, the combination of Ophiomorpha with sedimentary structures, and the vertical facies succes-sion allowed for the interpretation of the closest position of paleo sea level. he measurements performed for this work
and those of Tomazelli and Dillenburg (2007) resulted in the minimum sea-level altitudes related to highstands of 9.5 ± 1 and 8 ± 1 m for Barrier II and III, respectively.
System IV indicators of paleo sea level are related to geomorphological features, as lagoonal terraces (Barboza & Tomazelli 2003), and the foreshore/shoreface position along strandplains, observed at outcrops, drill holes and GPR pro-iles (Barboza et al. 2009, 2011). As System IV has the most studied stratigraphic record of the coastal plain, and sea-level history during Holocene is quite well known we did not per-formed new measurements in this work. Barrier IV was stud-ied in detail by Dillenburg et al. (2000, 2009), Dillenburg and Barboza (2014) and Hesp et al. (2005, 2007), which distinguished three main morphological barrier types: relict duneields, active duneields or a complex foredune ridges, and duneields combination. he morphological types of Barrier IV are related to the stratigraphic stacking found in GPR data (Rosa 2012; Barboza & Rosa 2014).
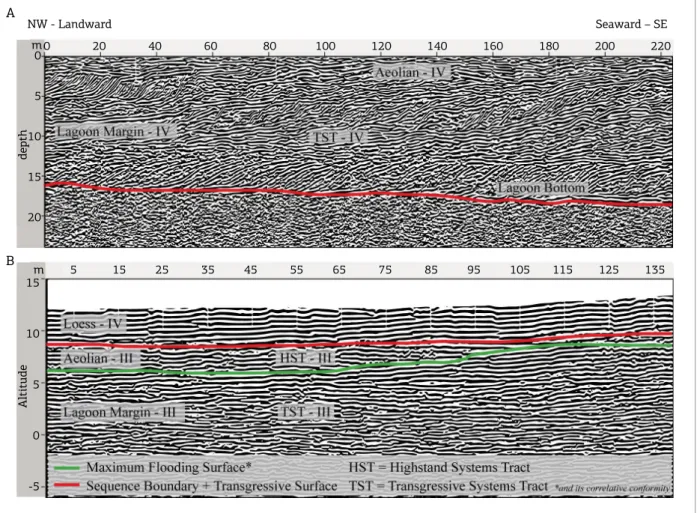
GPR interpretation resulted in the deinition of radar-facies correlated with depositional systems (Table 2 and Figs. 8 to 11). According to radarfacies relations, there are three main patterns deined: retrogradational, aggradational and progradational (Figs. 8 to 11). he retrogradational stacking is characterized by relections dipping landwards (Barboza et al. 2011; Rosa 2012; Lima et al. 2013; Silva 2011, 2015; Dillenburg & Barboza 2014). Radarfacies are related to lagoonal deposits covered by aeolian, backshore, foreshore and shoreface deposits (Figs. 8 and 9). Usually, retrogradational pattern is associated with barrier morphol-ogy of duneields. In some GPR sections, it is possible to recognize the maximum shoreline transgression (Barboza et al. 2011) where backshore and foreshore relections reach its landward most position (Fig. 9).
Seaward, in some sectors of the coastal plain, prograda-tional stacking is observed and characterized by continuous sets of beach and marine deposits (Figs. 9 and 10). In the GPR sections, progradational staking is composed by radar-facies related to aeolian, backshore, foreshore and shoreface deposits, forming a set of relections dipping seaward (Silva et al. 2010; Barboza et al. 2011; Rosa 2012; Dillenburg & Barboza 2014). Barrier morphology is mostly represented by strandplains, with complex foredune ridges and dune-ield combination (Dillenburg et al. 2000, 2009; Hesp et al. 2005, 2007; Martinho et al. 2008, 2010). he third pat-tern is deined as aggradational, with parallel to subparal-lel horizontal relections related to aeolian deposits, where the barrier morphology is mainly of duneields (Rosa 2012; Dillenburg & Barboza 2014).
he deinition of stacking based on relection conigura-tion and radarfacies succession allowed identifying the main internal and bounding surfaces. Each barrier-lagoon system
(II, III and IV) is separated by unconformities, represent-ing a depositional sequence characterized by a conformable succession of strata. he architectural pattern of Systems II, III and IV is mostly the same. hus, as the work done in System IV is so detailed and GPR data has a much better quality, and because System IV is less afected by digenesis, its understanding was used to guide the interpretation of Systems II and III.
he determination of retrogradational, aggradational, progradational and degradational stacking allowed dein-ing the transgressive and the highstand/falldein-ing stage system tracts packages (Figs. 8 to 10). he lowstand system tract was only recognized into an incised-valley related to System IV, studied by Tomazelli et al. (2008), and the degradational stacking (also known as falling-stage, or forced regression) was not separated from the highstand system tract because of data resolution. Dillenburg et al. (2017) (in press), studying Barrier IV in the southern portion of the coastal plain, were able to separate highstand and falling-stage systems tracts.
DISCUSSION
In order to contextualize the coastal plain record, we summarized current stratigraphic understanding of Pelotas Basin in a hierarchical scheme. Figure 11 and Table 3 show a summary of published data used to build the proposed hierarchy. Major phases of basin illing are deined as Rift, Post-rift and Drift (Fig. 2, Table 3 — Low), with the two later phases subdivided into transgressive, aggradational, and regressive intervals, which, according to Abreu et al. (2010), include four composite sequences (Fig. 3, Table 3 — Low and Medium). Each composite sequence is divided into three sequence sets, resulting in 12 sequence sets for the basin (Fig. 3). he last sequence set (APD4) encloses eight depositional sequences (Fig. 3).
Starting from the interpretation of seismic sections of Pelotas Basin, it is possible to deine that the geological record of the coastal plain is part of a depositional sequence deined by Abreu (1998) (number 43 of his work) with about 0.5 My. he integration of surface and subsurface data leave to interpret that this sequence is in fact composed of high-er-frequency sequences, partially represented by each bar-rier-lagoon system (Table 3 — High I).
Table 2. Radarfacies description and interpretation based on relection coniguration (shape, dip, relationship between relections and continuity). Sample images were acquired with a 200 MHz antenna and are W to E oriented.
Rf Description W Sample image E Interpretation
1a
Shape: sinuous convex
Dip: multidirectional, higher angles at the top Relationship: chaotic
Continuity: discontinuous
Amplitude: variable, higher in contact with Rf2 Dimension: sets with 5 m thick, 5 to 10 m length
Foredune
1b
Shape: planar Dip: horizontal or low angle to W
Relationship: subparallel with oblique truncation between sets Continuity: relative continuous
Amplitude: medium to high, variable
Dimension: sets with 1 to 10 m thick, tens of meters in length
Transgressive Sand Sheets and
Aggradational Aeolian Deposits
2
Shape: planar Dip: low angle unidirectional (5º) Relationship: parallel and oblique
Continuity: continuous Amplitude: high
Dimension: sets with about 5 m thick, 10s to 100s m in length
Backshore Foreshore
3a
Shape: sinuous
Dip: multidirectional in detail, with resultant tendency to E Relationship: chaotic
Continuity: discontinuous Amplitude: high
Dimension: sets with about 5 m thick, metric to 10s m in length
Upper Shoreface
3b
Shape: gently sinuous to planar Dip: very low angle with resultant tendency to E Relationship: subparallel with oblique truncation between sets
Continuity: relative continuous Amplitude: medium, variable
Dimension: sets with about 5 m thick, metric to 10s m in length
Mid-Lower Shoreface
4a
Shape: sigmoidal
Dip: unidirectional variable (low, high and low angle from topsets to bottomsets — 3 to 30º)
Relationship: oblique tangential Continuity: continuous Amplitude: high to low, variable
Dimension: sets with up to 5 m thick, 5 to 20 m in length
Lagoon Margin (beaches and
deltas)
4b
Shape: planar to gently undulating Dip: horizontal to very low angle Relationship: single reflector or a parallel set
Continuity: continuous Amplitude: high
Dimension: 1 to 2 m thick, longer than 10s m in length
Lagoon Bottom
5
Shape: concave
Dip: bidirectional on the edges and horizontal to oblique in the middle
Relationship: parallel to oblique, variable illing Continuity: continuous edges, variable illing Amplitude: high in the bottom, variable illing Dimension: Swales — 1 to 4 m thick, 5 to 20 m in length Channels: can reach more than 30 m thick, can be longer than 10s
or 100s m in length
about 400 ka (Chappell & Shackleton 1986, Martinson et al. 1987; Raymo et al. 1989; Gibbard & Cohen 2009).
he altitudes of relative sea-level highs deined through topographic measurements from this work are in accordance with those performed by Tomazelli and Dillenburg (2007), and Lopes et al. (2014). he minimum highest sea-level altitude estimated to System II is 9.5 ± 1 m, to System III is 7.7 ± 1 m, and to System IV is 3 ± 1 m. Rohling et al. (1998) and Rabineau et al. (2006) established magnitudes of lowstands to the past 500 kyr. Considering the correla-tion with oxygen isotope stages to determine the age of sequences lowstand, it is possible to determine that sea level was more than 100 m below its current position during each lowstand (Fig. 5).
Analyzing the magnitude of sea-level changes and the time of formation of each system, it is possible to interpret
that expressive and regional unconformities were formed by exposition, erosion and non-deposition, bounding the related sequences. Considering the maximum measured paleo indicator of sea-level position as the minimum altitude of the zero shoreline at the time of deposition of each system, and the age control, Systems II to IV together are progra-dational and are at progressively lower altitudes, resulting in a degradational architecture.
Internally, each sequence at the onshore portion of the basin is formed by the record of depositional environments disposed in retrogradational, aggradational, progradational and degradational stacking (Figs. 8 to 12). he stacking deines system tracts and surfaces, prevailing the transgres-sive and highstand (Fig. 12).
Quaternary depositional sequences are worldwide identi-ied, specially related to 41 and 100 kyr glacioeustatic cycles
A
B
m 0 20 40 60 80 100 120 140 160 180 200 220 Seaward – SE NW - Landward
0
5
10
15
20
depth
m 5 15 25 35 45 55 65 75 85 95 105 115 125 135 15
10
5
0
-5
Altitude
Figure 8. GPR sections obtained on the Barriers IV (A) and III (B). Locations are outlined on the map in Figure 4.
Both sections are mainly composed by relections dipping landwards associated to lagoonal (radarfacies 4a and 4b) and aeolian systems (radarfacies 1b) retrogradation, deining transgressive systems tracts related to two
A
B
m 0 20 40 60 80 100 120 140 160 180 200 Seaward – SE NW – Landward
0
5
10
15
20
depth
0
5
10
15
20
depth
m 0 100 200 300 400 500 600 700 800 900
Figure 9. GPR sections obtained on the Barrier IV showing in the base the same type of record of Figures 8A and B,
with landward dipping relections representing lagoon margins (radarfacies 4a and 4b) moving to this direction. The shoreline landward most position related to its maximum transgression is located where relections change and backshore, foreshore and upper shoreface (radarfacies 2 and 3) relections conigure barrier progradation.
In section A, a 14C analysis determined the age of 8,320–8,070 cal yrs BP (Silva 2011). In section B, a 14C analysis
determined the age of 7,760–7,600 cal yrs BP (Dillenburg et al. 2007). Sequence boundary is attested to sedimentary features interpreted as Barrier III deposits obtained in the drill holes (Silva, 2011 and Dillenburg et al. 2007). Sections locations are outlined on the map in Figure 4.
(Boyd et al. 1989; Saul et al. 1999; Carter & Naish 1998; Yoo & Park 2000; Morton et al. 2000; Blum & Carter 2000; Blum et al. 2002; Abbott et al. 2005; Blum & Aslan 2006; Parham et al. 2007; Riboulot et al. 2012; Amorosi et al. 2016). However, the time of sequence formation and its record vary according to the factors controlling their evo-lution. Studies developed in New Zealand, where the record is strongly inluenced by tectonics, identiied the occurrence of sequences with frequencies of 41 and 100 kyr developed during the Pliocene and Quaternary (Naish & Kamp 1997; Carter & Naish 1998; Saul et al. 1999; Abbott et al. 2005). In the Golf Coast (USA), sea-level changes are responsible by the formation of Quaternary sequences related to upper Pleistocene and Holocene (Blum et al. 2002; Blum & Aslan 2006). Studying the coastal plain and incised-valleys, Blum et al. (2002) e Blum & Aslan (2006) deined depositional sequences related to the 100 kyr cycles, composed by low-stand, transgressive, highstand and regressive systems tracts.
Sequences formed in response to 100 kyr are identiied as well in Eastern Niger submarine delta (Riboulot et al. 2012), In North Carolina, Parham et al. (2007) studied a drain-age system and detected nine depositional sequences illing an incised-valley with ages younger than 140 ka, conclud-ing that multiple sea-level oscillations occurred durconclud-ing this time or the area must be inluenced by glacial isostatic uplift and subsidence.
A
B
m 0 20 40 60 80 100 120 140 160 180 200 Seaward – SE NW – Landward
Altitude
Altitude
6
3.5
1
-1.5
-4
-6.5
m 0 20 40 60 80 100 15
10
5
0
Aeolian
Figure 10. GPR sections obtained on the Barriers IV (A) and III (B). Locations are outlined on the map in Figure 4.
Both sections are mainly composed by relections dipping seawards associated to swales, backshore, foreshore and shoreface (radarfacies 1a, 5, 2 and 3) deining the progradational stacking of highstand systems tracts related
to two depositional sequences (IV – section A, and III – section B).
Tectonic inluence in the relative sea level related to those sequences was not determined. Nevertheless, in Central Patagonia (Argentina), Pappalardo et al. (2015) measured similar coastal landforms (beach ridges, marine terraces and river mouth terraces) correlating its age to marine isotope stages 1, 5, 7, 9 and 11. he authors attributed the eleva-tion of landforms to sea-level rises combined with tectonic uplifts, with rates varying from 0,016 to 0,067 m/kyr. Despite uplifts is not proved for the coastal plain of Pelotas Basin, a tectonic inluence in its sedimentary record is not discarded, especially for the older deposits.
System IV
As previously discussed, Barrier III is interpreted as related to oxygen isotope stage 5 (125 ka) and has a sea-level posi-tion up to 7 m higher than current sea level based on the record of beach outcrops (Tomazelli & Dillenburg 2007; Rosa 2012). he oxygen isotope record shows a continuous trend of falling sea level starting in stage 5 until the Last Glacial Maximum (LGM) at about 20 ka. In the LGM, sea level is interpreted to have been situated at around 120 to 130 m below the current position (Fairbanks 1989; Corrêa
1995; Peltier & Fairbanks 2006). After the LGM, sea level rose at a fast rate. Along the Brazilian margin, sea level is interpreted to have exceeded the present level around 7.7 to 6.9 ka, reaching its maximum at approximately 5.6 ka (Martin et al. 1979; Angulo & Lessa 1997; Bezerra et al. 2003; Caldas et al. 2006; Angulo et al. 2006). In Rio Grande do Sul, sea level is estimated to have reached from 2 to 4 m above the current level (Barboza & Tomazelli 2003; Dillenburg et al. 2000, 2009). Since then, it would have started to fall again until it reaches the present level (Angulo & Lessa 1997; Angulo et al. 2006).
Phases (Riſt, P
ost-riſt & Driſt)
and composite sequences
Time (s)
Time (s)
0.0
2.0
4.0
6.0
0.0
2.0
4.0
6.0
W E
Composite Sequence Boundary Composite Transgressive Surface Composite Maximum Flooding Surface Composite Sequence
Sequence sets and
depositional sequences
Aggradational-Progradational-Degradational Sequence Set
Retrogradational Sequence Set
Progradational-Aggradational Sequence Set Sequence Boundaries
I to IV Barrier-Lagoon Systems (high-frequence sequences)
High-frequence depositional sequence set
I
II
III IV
Sea Level
? ? ?
100 km Aſter Tomazelli & Willwock (2000)
High-frequence
depositional sequence and system tracts
MFS = Maximum flooding surface RS = Ravinement surface
TS = Transgressive surface
SB = Sequence Boundary Highstand and falling stage system tractsTransgressive system tract Lowstand system tract
Aſter Tomazelli et al. (2008)
System tracts
and parasequences
m 0 20 40 60 80 100 120 140 160 180 200 0
5
10
15
20 Maximum flooding surface Transgressive surface (+ sequence boundary) TST = Transgressive systems tract HST = Highstand systems tract 37 to 43
Table 3. Summary of main works that depict the Pelotas Basin in diferent hierarchies.
Freq. Beginning Data type Results Main References Cited
Low 130 Ma Seismic, drilling Great phases of illing and
basin evolution
Fontana (1996), Abreu (1998),
Bueno et al. (2007)
Low and
Medium 130 Ma Seismic, drilling, dating
Four composite sequences, 12 sequence sets, 56 depositional sequences
Abreu (1998), Neal and Abreu
(2009), Abreu et al. (2010)
High I 230 ka (325
ka?)
Geomorphology, remote sensing, outcrops, drilling, dating, GPR
Barrier-lagoon Systems I or II through IV (part of high frequency sequences, each sequence cyclicity is 100 ka)
Villwock, (1984), Villwock and Tomazelli (1995), Tomazelli and
Villwock (2000), Lopes et al.
(2010, 2013, 2014), Rosa (2012)
High II 20 ka
Geomorphology, remote sensing, outcrops, drilling, dating,
seismic, GPR
System IV evolution (part of the younger high frequency
sequence)
Tomazelli & Villwock (1989),
Dillenburg et al. (2000, 2009),
Tomazelli et al. (2008), Barboza
et al. (2009, 2011), Rosa (2012), Dillenburg and Barboza (2014)
High III 500, 300, 60
and 22 yr
Geomorphology, remote sensing, including historical data, outcrops, drills, dating, beach proiles, monitoring of shoreline (DGPS), tide gauge, climatic, and
meteorological data
Phases of dunes (~500 yr), Lagoon level rise (Lagoa dos
Patos - 300 yr), increased vegetation in dune ields (60 yr), shoreline erosion (22 yr)
Toldo Jr. et al. (1999, 2004,
2005), Barboza et al. (2006),
Martinho et al. (2008, 2009,
2010), Rosa (2012), Dillenburg
et al. 2017 (in press) the contact between the valley bottom and System III. 14C
age dating of shells obtained in SPT cores on the barrier indicates a Holocene age above this contact. he valley was completely illed during the Holocene, represented today by a swamp.
he base of this incised valley was deined as a sequence boundary by Tomazelli et al. (2008), separating System III from the valley deposits. his unconformity was inter-preted by these authors as the sequence boundary formed as a consequence of the LGM. Roots from drill hole indi-cate 14C ages of 19,550–19,270 cal yrs BP to the base of
valley (Tomazelli et al. 2008). he lowstand system tract is interpreted to be related to the basal portion of the valley and to paleosoils and other continental correlated deposits beyond the coastal plain (Tomazelli et al. 2008; Rosa 2012). Atop the lowstand valley deposits, the transgressive surface is interpreted by the diferentiation of illing architecture patterns in GPR and seismic proiles, associated to sedimen-tological changes (Fig. 13). Into the valley, the transgres-sive system tract is characterized by lateral accretion, related to the evolution of channel bars disposed in aggradational staking. Fluvial channel deposits are characterized by a high content of coarse sand. Mud lenses and biodetritical gravel are present too. To the top, estuarine and lagoon deposits were interpreted, and shells of reworked mollusks indicate
14C ages between 8,160–7,990 and 6,820–6,640 cal yrs BP
(Tomazelli et al. 2008).
he transgressive system tract is represented in GPR by landward dipping relections of lagoonal deposits, when lagoonal margin migrates landwards (Fig. 8A). During
transgression, beach face erosion caused sediment trans-port from the barrier to the lagoons, mostly through wash-over fans and wind. As they are below the wave level, these features have a higher preservation potential during barrier transgression. In this case, the transgressive surface and the sequence boundary are merged (Figs. 8A and 9).
he lagoonal radarfacies are, at some sectors of the coast, covered by the radarfacies of aeolian, backshore, foreshore and shoreface deposits, composing retrograda-tional parasequences. he landward most beach and marine deposits represent the maximum shoreline transgression or the maximum looding surface (Fig. 9). In other sectors of the coastal plain, the shoreline transgression reached the western continental margin of the paleo lagoons, and wave action sculpted scarps in Barrier III. his induced a signiicant diference in the record of transgressive system tract along the coast, which is represented by thin marine deposits in these sectors.
he age of maximum looding surface varies along the coastal plain, and occurred in some sectors even before sea level reached its maximum elevation at about 6 ka. Silva (2011) obtained a 14C age of 8,320–8,070 cal yrs BP for a piece of
wood from drill hole into the transgressive lagoonal mar-gin deposits in the coastal plain of Santa Catarina (Fig. 9A). Dillenburg et al. (2006, 2007) dated preserved shells of marine mollusks in foreshore and shoreface deposits positioned at depths of 9 to 12 m. he oldest 14C ages obtained in the
Schematic Composite Section A – Northern Coastal Plain Fluvial IV
Barrier III m
15
0
m 15
0
m 20
0
m 25
0
0 15 km
0 20 km
0 30 km
0 30 km
NW SE
NW SE
NW SE
NW SE
schematic Composite Section B – Medium Coastal Plain
Schematic Composite Section C – Southern Coastal Plain SE NW
Schematic Composite Section D – Southern Coastal Plain
Highstand system tract (HST) (+ falling stage system tract)
Transgressive system tract (TST)
Ravinement Surface (RS) Maximum Flooding Surface (MFS) Sequence Boundary (SB)
Transgressive Surface (TS)
Aeolian
Beach / Marine
Lagoonal (backbarrier) Lagoonal IV
Barrier IV
Barrier III
Barrier II
Barrier II
Barrier III
Barrier III
P
atos Lagoon Lagoonal IV
Lagoonal IV
Lagoonal IV Lagoonal
IV
Aeolian IV covering
Barrier III deposits Paleolagoonal IV
Barrier IV
Barrier IV
Barrier IV Lagoonal
II/III
Lagoonal II/III
Lagoonal III
Lagoonal III TST
HST4
Mirim Lagoon
Chuí Stream
Figure 12. Schematic sections summarizing the stratigraphic framework of four sectors along the coastal plain
(ater Rosa 2012). The approximate location of the sections is outlined on the map in Figure 4.
N S m 0 200 400 600 800 1000
5
10
15
20
Maximum Flooding Surface Transgressive Surface Sequence Boundary
HST: highstand systems tract TST: transgressive systems tract LST: lowstand systems tract
Figure 13. Strike seismic section of the incised valley where the sequence boundary is related to the unconformity
between the depositional sequences of Systems III and IV. The valley ill refers to System IV, in which the main
stratigraphic surfaces and system tracts were interpreted. The location of the section is outlined on the map in Figure 4.
Coastal embayments show a progradational stacking inter-preted as the highstand systems tract, represented mostly by dis-tinct strandplain morphology (Figs. 9, 10A and 14). Landward, the maximum looding surface is positioned between the top of lagoonal and the base of beach deposits, while seaward it is in the shoreface deposits (Fig. 9). In most of the lagoons of the coastal plain, scarps were sculpted when the water level was higher in response to the high sea level. hese scarps repre-sent the continental record of the maximum looding surface. Some authors recognized progressive changes in the morphology and altitude of the strandplains, with fore-dune ridges narrower and downsteping, and interpreted the transition from normal to forced regression (Silva 2011, 2015; Dillenburg et al. 2006, 2009). According to models as the ones of Hunt and Tucker (1992), Helland-Hansen and Gjelberg (1994), and Plint and Nummedal (2000), this record could be related to the forced-regressive system tract. However, the basal surface of forced regression and the regressive surface of marine erosion are not recognized in most of GPR sections and cores. So the forced regression was only identiied in some studies related to the evolution of Barrier IV (Dillenburg et al. 2006; Silva 2011, 2015; Dillenburg et al. 2017 in press).
As already observed by Tomazelli and Villwock (1989), Dillenburg et al. (2000, 2009), Barboza et al. (2011), Rosa et al. (2011), Rosa (2012), Dillenburg and Barboza (2014) and Barboza and Rosa (2014), the Pelotas Basin shoreline has sectors with diferent behaviors, with System IV pre-senting synchronous progradational, aggradational and ret-rogradational patterns along the coast.
System IV shows sectors along the coast with transgres-sive shoreline, where GPR record exhibits landward dipping
relections (Fig. 8A). hese sectors are located where the shoreline is more projected seaward (Fig. 14). In these sec-tors, lagoonal mud and peat outcrop in the current beach face (Tomazelli et al. 1998; Dillenburg et al. 2004). 14C
dat-ing of these deposits indicate ages of 6,843–6,303 cal yr BP (Travessas et al. 2005), 4,252–4,641 cal yr BP (Tomazelli et al. 1998) and 3,551–2,888 cal yr BP (Dillenburg et al. 2004), which imply that the barrier was positioned seaward of its present position.
Where the coastline form embayments, progradational stacking is observed in System IV (Fig. 14). In these sectors, GPR proiles show seaward dipping relections (Fig. 10A). he strandplains of these areas can reach up to 15 km width (Dillenburg et al. 2009; Dillenburg & Barboza 2014). Aggradational behavior occurs in the transitions between the progradational and retrogradational sectors, mainly posi-tioned where shoreline changes its orientation (Dillenburg & Barboza 2014).
A
B C
D
Relative maximum sea level (about 6 ka) Maximum transgression (landward most position – diachronous)
Shoreline trajectories Shoreline position
Figure 14. (A) Landsat 7 satellite image (ETM+ sensor, 7R4G2B composition) showing the shoreline morphology. Progradational sectors (B) are formed by strandplains and located in coastal embayment, while coastal projections
are mainly retrogradational (C) and characterized by the presence of great duneields. Sediment transport is largely controlled by the longshore drit, which resulting northeast, and by aeolian activity, with northeast
predominant wind. (D) Oblique satellite image (source: Google Earth) of the northern coast of Rio Grande do Sul including the position of the shoreline related to the relative maximum sea level and maximum transgression, showing its diachronism (created, with no accuracy in the position, based on the works of Dillenburg et al. 2000, 2009, Travessas et al. 2005).
2005; Barboza et al. 2006; Martinho et al. 2008, 2009, 2010; Dillenburg et al. 2017 in press). As already observed in exper-imental studies, the signal of autogenic processes may be pre-served in the stratigraphic record (Paola et al. 2009; Jerolmack
CONCLUSIONS
he performed analysis resulted in a Sequence Stratigraphic framework which allowed positioning the Quaternary record of the coastal plain of Pelotas Basin in relation to its evolu-tion through a Sequence Stratigraphic view. Furthermore, the detailed analysis of System IV demonstrated the dia-chronous nature of stratigraphic surfaces and systems tracts, which is related to scale issues and the relation of autogenic and allogenic factors controlling the stratigraphic record.
he coastal plain is mainly formed by barrier-lagoon dep-ositional systems, here interpreted to represent the preserved, onshore portion of depositional sequences (Systems II, III and IV). GPR and elevation data of the four systems indi-cate that they have a degradational stacking corresponding to a sequence set prograding and downsteping into the basin (Figs. 5 and 6), comprehending a degradational sequence set. Stacking and types of deposits are show in four sche-matic dip sections (Fig. 12).
hese sequences are interpreted to be mainly controlled by glacioeustatic cycles of about 100 kyr duration repre-sented in oxygen isotope records. Higher frequency sea-level oscillations were not detected in this studied, but could
be recorded in the ofshore portion of the basin as well as a factor inluencing sedimentation. his record could be searched in future studies.
System IV shows the concomitant occurrence of pro-gradational and retropro-gradational stacking along the coast. In some sectors, the maximum looding surface reached its landward most position between 8 and 5 ka, with progra-dation occurring afterwards associated with the highstand system tract. In other sectors, the stacking pattern is still retrogradational and the shore is still under transgression (Fig. 14). It demonstrates the variability of factors con-trolling the sedimentary record. On this scale of analysis, coastal depositional systems behave diferently at the same time along strike, demonstrating the importance of auto-genic factors in its evolution.
ACKNOWLEDGEMENTS
he authors would like to thank CNPq (Brazilian National Council for Scientiic and Technological Development) and ExxonMobil Upstream Research Company for inan-cial support.
Abbott S.T., Naish T.R., Carter R.M., Pillans B.J. 2005. Sequence stratigraphy of the Nukumaruan Stratotype (Pliocene-Pleistocene, c. 2.08–1.63 Ma), Wanganui Basin, New Zealand. Journal of the Royal Society of New Zealand, 35:123-150.
Abreu V.S. 1998. Geologic evolution of conjugate volcanic passive margins: Pelotas Basin (Brazil) & ofshore Namibia (Africa). Implication for global sea-level changes. PhD Thesis, Rice University, Houston, Texas, 354 p.
Abreu V.S., Neal J.E., Vail P.R. 2010. Integration of Sequence Stratigraphy concepts. In: Abreu V.S., Neal J.E., Bohacs K.M., Kalbas J.L. (eds.). Sequence Stratigraphy of siliciclastic systems – The ExxonMobil Methodology: atlas of exercises, SEPM Concepts in Sedimentology & Paleontology, 9:209-224.
Alves E.C. 1977. Estrutura rasa do talude e sopé da Margem Continental do Rio Grande do Sul e Uruguai. MS Dissertation, Instituto de Geociências, Universidade Federal do Rio Grande do Sul, Porto Alegre, 74 p.
Alves E.C. 1981. Estruturas da margem continental sul brasileira e das áreas oceânicas e continentais, adjacentes. In: Asmus H.E. (ed.). Estruturas e tectonismo da Margem Continental Brasileira, e suas implicações nos processos sedimentares e na avaliação do potencial de recursos minerais, PETROBRAS/CENPES/DINTEP, Série REMAC 9:187-269.
Amorosi A., Bruno L., Cleveland D.M., Morelli A., Hong W. 2016. Paleosols & associated channel-belt sand bodies from a continuously subsiding late Quaternary system (Po Basin, Italy): New insights into continental sequence stratigraphy. Geological Society of America Bulletin, 128:11-12. doi:10.1130/B31575.1
Angulo R.J., Lessa, G.C. 1997. The Brazilian sea-level curves: a critical review with emphasis on the curves from Paranaguá & Cananéia regions. Marine Geology, 140:141–166. doi:10.1016/ S0025-3227(97)00015-7.
REFERENCES
Angulo R.J., Lessa G.C., Souza M.C. 2006. A critical review of Mid-
to Late‑Holocene sea‑level luctuations on the easthern brazilian
coastline. Quaternary Science Reviews, 25:486-506. doi:10.1016/j. quascirev.2005.03.008.
Asmus H.E, Porto R. 1972. Classiicação das bacias sedimentares
brasileiras segundo a tectônica de placas. In: 26th Congresso Brasileiro de Geologia, Belém, Anais, v. 2, p. 67-90.
Backeuser E.A. 1918, A faixa litorânea do Brasil Meridional, ontem e hoje, Rio de Janeiro. Bernard Freres, 210 p.
Barboza E.G., Tomazelli L.J. 2003. Erosional features of the eastern
margin of the Patos Lagoon, southern Brazil: signiicance for Holocene
history. Journal of Coastal Research, Special Issue, 35:260-264.
Barboza E.G.. Rosa M.L.C.C. 2014. Indicadores geológicos e geomorfológicos de setores em erosão na costa do Rio Grande do Sul, Brasil. In: Goso C. (ed.), Problemática de Los Ambientes Costeiros. Sur de Brasil, Uruguay y Argentina, DIRAC, p. 83-98.
Barboza E.G., Toldo Jr. E.E., Tomazelli L.J., Dillenburg S.R., Ayup-Zouain R.N. 2006. Stratigraphic and Holocenic evolution of the submerged platform of the easthern margin of the Lagoa dos Patos Lagoon, RS.
Journal of Coastal Research, Special Issue, 39:266-269.
Barboza E.G., Dillenburg S.R., Rosa M.L.C.C., Tomazelli L.J., Hesp P.A.
2009. Ground‑penetrating radar proiles of two Holocene regressive
barriers in southern Brazil. Journal of Coastal Research, Special Issue, 56:579-583.
Barboza E.G., Rosa M.L.C.C., Hesp P.A., Dillenburg S.R., Tomazelli L.J., Ayup-Zouain R.N. 2011. Evolution of the Holocene coastal barrier of Pelotas Basin (southern Brazil) – a new approach with GPR data.
Barboza E.G., Rosa M.L.C.C., Dillenburg S.R Tomazelli L.J. 2013. Preservation potential of foredunes in the stratigraphic record. Journal of Coastal Research, Special Issue, 65:1265-1270.
Barboza E.G., Rosa M.L.C.C., Dillenburg S.R Tomazelli L.J. 2014. Stratigraphic analysis applied on the recognition of the interface
between marine & luvial depositional systems. Journal of Coastal
Research, Special Issue, 70:687-692.
Bezerra F.H.R, Barreto A.M.F., Suguio K. 2003. Holocene sea level history on the Rio Grande do Norte State coast, Brazil. Marine Geology, 196:73-89. doi:10.1016/S0025-3227(03)00044-6.
Blackwelder E. 1909. The evaluation of unconformities. Journal of Geology, 17:289-299.
Blum M.D., Carter A.E. 2000. Middle Holocene evolution of the Central Texas Coast. Transactions of the Gulf Coast Association of Geological Societies. 50, p. 331-341.
Blum M.D., Aslan A. 2006. Signatures of climate vs. sea-level change
within incised valley‑ill successions: Quaternary examples from the
Texas Gulf Coast. Sedimentary Geology, 190:177-211.
Blum M.D., Carter A.E., Zayac T., Goble R. 2002. Middle Holocene Sea-Level & Evolution of The Gulf of Mexico Coast (USA). Journal of Sedimentary Research. Special Issue, 36:65-80.
Boyd R., Suter J., Penland S. 1989. Relation of sequence stratigraphy to modern sedimentary environments. Geology, 17:926-929.
Buchmann F.S.C., Tomazelli L.J. 2003. Relict nearshore shoals of Rio
Grande do Sul, southern Brazil: origin & efects on nearby modern
beaches. Journal of Coastal Research, Special Issue, 35:318-322.
Bueno G.V., Zacharias A.A., Oreiro S.G., Cupertino J.A., Falkenhein F.U.H., Martins-Neto A.M. 2007. Bacia de Pelotas. Boletim de Geociências da Petrobras, 15(2):551-559.
Caldas L.H.O., Stattegger K., Vital H. 2006. Holocene sea-level history: evidence from coastal sediments of the northern Rio Grande do Norte coast, NE Brazil. Marine Geology, 228:39-53.
Carter R.M., Naish T.R. 1998. A review of Wanganui Basin, New Zealand: global reference section for shallow marine, Plio–Pleistocene (2.5–0 Ma) cyclostratigraphy. Sedimentary Geology, 122:37-52.
Catuneanu O. 2002. Sequence stratigraphy of clastic systems: concepts, merits, and pitfalls. Journal of African Earth Sciences, 35(1):1-43.
Catuneanu O., Abreu V., Bhattacharya J.P., Blum M.D., Dalrymple R.W., Eriksson P.G., Fielding C.R., Fisher W.L., Galloway W.E., Gibling M.R., Giles K.A., Holbrook J.M., Jordan R., Kendall C.G.St.C, Macurda B., Martinsen O.J., Miall A.D., Neal J.E., Nummedal D., Pomar L., Posamentier H.W., Pratt B.R., Sarg J.F., Shanley K.W., Steel R.J., Strasser A., Tucker M.E., Winker C. 2009. Towards the standardization of sequence stratigraphy. Earth-Science Reviews, 92:1-33.
Chappell J., Shackleton N.J. 1986. Oxygen isotopes & sea level.
Nature, 324:137-140.
Cohen K.M., Finney S., Gibbard P.L., Fan J. 2013. The ICS International Chronostratigraphic Chart. Episodes, 36(3):199-204.
Corrêa I.C.S. 1995. Les variations du niveau de la mer durant les derniers 17.500 ans BP: l’exemple de la plate-forme continentale du Rio Grande do Sul-Brésil. Marine Geology, 130:163-178.
CPRM – Serviço Geológico do Brasil. 2008. Geologia e recursos minerais do Estado do Rio Grande do Sul, Programa de Geologia do Brasil: Integração, Atualização e Difusão de Dados de Geologia do Brasil, Mapas Geológicos Estaduais em Sistema de Informações Geográicas – SIG, Escala 1:750.000, DVD ROM.
Davis J.L., Annan A.P. 1989. Ground penetrating radar for high resolution mapping of soil and rock stratigraphy. Geophysical Prospecting, 37:531-551.
Delaney P. 1965. Fisiograia e geologia da subsuperfície da Planície
Costeira do Rio Grande do Sul. Publicação Especial da Escola de Geologia/UFRGS, Porto Alegre, v. 6, 195 p.
Dias J.L., Sad A.R.E., Fontana R.L., Feijó F.J. 1994. Bacia de Pelotas.
Boletim de Geociências Petrobras, 8:235-245.
Dillenburg S.R., Barboza E.G. 2014. The strike-fed sandy coast of Southern Brazil. Geological Society of London Special Publication, 388:333-352. doi:10.1144/SP388.16.
Dillenburg S.R., Roy P.S., Cowell P.J., Tomazelli L.J. 2000. Inluence of
antecedent topography on coastal evolution as tested by the shoreface translation-barrier model (STM). Journal Coastal Research, 16:71-81.
Dillenburg S.R., Tomazelli L.J., Barboza E.G. 2004. Barrier evolution & placer formation at Bujuru southern Brazil. Marine Geology, 203:43-56.
Dillenburg S.R., Tomazelli L.J., Hesp P.A., Barboza E.G., Clerot L.C.P., Silva D.B. 2006. Stratigraphy & evolution of a prograded,
transgressive duneield barrier in southern Brazil. Journal of Coastal
Research, Special Issue, 39(1):132-135.
Dillenburg S.R., Barboza E.G., Tomazelli L.J., Lima L.G., Becker J.E.G. 2007. A barreira costeira de Dunas Altas no litoral médio do Rio Grande do Sul: um exemplo de barreira agradacional ou estacionária. In: XI Congresso da Associação Brasileira de Estudos do Quaternário, Belém, Anais, 341.
Dillenburg S.R., Barboza E.G., Tomazelli L.J., Hesp P.A., Clerot L.C.P., Ayup-Zouain, R.N. 2009. The Holocene Coastal Barriers of Rio Grande do Sul. In: Dillenburg S.R., Hesp P.A. (eds.), Geology & Geomorphology of Holocene Coastal Barriers of Brazil, Springer, p. 53-91.
Dillenburg S.R., Barboza E.G., Rosa M.L.C.C. 2011. Ground Penetrating Radar (GPR) & Standard Penetration Test (SPT) records of a regressive barrier in southern Brazil. Journal of Coastal Research, Special Issue, 64:651-655.
Dillenburg S.R., Barboza E.G., Rosa M.L.C.C., Caron F., Sawakuchi A. Unpublished. The complex prograded Cassino barrier in southern Brazil: Geological and morphological evolution and records of climatic, oceanographic and sea-level changes in the last 7-6 ka. Submitted to Marine Geology in November, 2017, in press.
Fairbanks R.G. 1989. A 17,000 year glacio-eustatic sea-level record:
inluence of glacial melting rates on the Younger Dryas event & deep
ocean circulation. Nature, 342:637-642.
Fontana R.L. 1996. Geotectônica e sismoestratigraia da Bacia de Pelotas
e Plataforma de Florianópolis. PhD Thesis, Instituto de Geociências, Universidade Federal do Rio Grande do Sul, Porto Alegre, 2 v, 214 p.
Fracalossi F.G., Barboza E.G., Rosa M.L.C.C., Silva A.B. 2010. O registro
em subsuperfície da barreira pleistocênica entre Osório e Tramandaí
– RS. Gravel, 8:21-31.
Frey R.W., Howard J.D., Pryor W.A. 1978. Ophiomorpha: its
morphologic, taxonomic and environmental signiicance. Palaeogeography, Palaeoclimatology, Palaeoecology, 23:199-229.
Gamboa L.A.P., Rabinowitz P.D. 1981. The Rio Grande Fracture Zone in the western South Atlantic & its tectonic implications. Earth & Planetary Science Letters, 52:410-418.
Gibbard P.L., Cohen K.M. 2009. Global chronostratigraphical correlation table for the last 2.7 million years. Episodes, 31:243-247.