FUNDAÇÃO GETULIO VARGAS ESCOLA DE ECONOMIA DE SÃO PAULO
EDYPO SOARES DE OLIVEIRA
DO BONDHOLDERS VALUE CORPORATE HEDGING? EVIDENCE FOR BRAZIL, CHILE AND MEXICO
SÃO PAULO 2016
EDYPO SOARES DE OLIVEIRA
DO BONDHOLDERS VALUE CORPORATE HEDGING? EVIDENCE FOR BRAZIL, CHILE AND MEXICO
Dissertação apresentada à Escola de Economia de São Paulo da Fundação Getulio Vargas como requisito para obtenção do título de Mestre em Economia.
Campo de conhecimento: Finanças
Orientadora: Profa. Dra. Mayra Ivanoff Lora
SÃO PAULO 2016
Oliveira, Edypo Soares de.
Do bondholders value corporate hedging? Evidence for Brazil, Chile and Mexico / Edypo Soares de Oliveira. - 2016.
43 f.
Orientador: Mayra Ivanoff Lora
Dissertação (MPFE) - Escola de Economia de São Paulo.
1. Derivativos (Finanças). 2. Risco financeiro. 3. Sociedades comerciais - Dívidas. 4. Sociedades comerciais - Finanças. 5. Taxas de juros. I. Lora, Mayra Ivanoff. II. Dissertação (MPFE) - Escola de Economia de São Paulo. III. Título.
EDYPO SOARES DE OLIVEIRA
DO BONDHOLDERS VALUE CORPORATE HEDGING? EVIDENCE FOR BRAZIL, CHILE AND MEXICO
Dissertação apresentada à Escola de Economia de São Paulo da Fundação Getúlio Vargas como requisito para obtenção do título de Mestre em Economia.
Campo de conhecimento: Finanças
Orientadora: Profa. Dra. Mayra Ivanoff Lora
Data de aprovação: / /
Banca Examinadora:
Profa. Dra. Mayra Ivanoff Lora (Orientadora)
FGV-EESP
Prof. Dr. Hsia Hua Sheng FGV-EAESP
Profa. Dra. Daniela Verzola Vaz UNIFESP
Aos meus pais, Eurico e Sonia, e irmãos, Júnior e Erick, pelo incentivo e apoio incondicional aos meus estudos por toda a minha vida.
À Jéssica, pelo carinho, paciência e compreensão ao longo de toda graduação e mestrado.
AGRADECIMENTOS
À professora doutora e orientadora Mayra Ivanoff Lora e ao professor doutor Hsia Hua Sheng pelo apoio, paciência, tempo dedicado e valiosas sugestões para a elaboração da tese.
Aos meus amigos da GV pela parceria ao longo dos dois anos de aula.
Aos amigos de infância, escola e faculdade e aos colegas do mercado financeiro pelas inúmeras conversas e discussões sobre assuntos diversos que estimularam a minha curiosidade intelectual.
Ao Citibank, pelo auxílio financeiro.
RESUMO
Há uma extensa literatura examinando como o uso de derivativos afeta o valor e o custo de capital da firma, porém sua relação com o custo da dívida (spread de crédito) é menos estudada, especialmente para os países da América Latina. Esta dissertação, a partir dos dados do mercado secundário dos títulos (bonds) emitidos por 66 empresas não financeiras de Brasil, Chile e México no período entre 2005 e 2015, analisa o impacto do uso de derivativos sobre o spread de crédito. Para testar a hipótese de que hedging reduz o spread de crédito pago pelas companhias, rodamos diferentes regressões baseadas no estudo de Cheng e King (2014). Encontramos resultados significativos apenas para a interação entre hedging e alavancagem no período posterior a 2008, em linha com o que foi reportado por Coutinho, Sheng e Lora (2012), que investigam a relação entre hedging e custo de capital. Resultado corrobora as hipóteses de que (1) empresas estariam utilizando derivativos para especular antes da Crise Financeira e (2) conforme Chen e King (2014), as empresas mais alavancadas (maior stress financeiro) são as que mais se beneficiam do uso de derivativos.
ABSTRACT
Literature has often examined how hedging affects firm value and cost of capital, but its relation with cost of debt is less studied, especially for Latin American firms. This dissertation examined the impact of derivatives usage over credit spread of the bonds issued by 66 non-financial companies from Brazil, Chile and Mexico, based on the secondary market transactions from 2005 to 2015. To test the hypothesis that hedging reduces credit spread, we performed different regressions based on Chen and King (2014) study. We only found a significant coefficient for hedging and leverage interaction for the post-2008 period, supporting Coutinho, Sheng and Lora (2012) findings that companies were not using derivatives for hedging purpose before the financial crisis and also corroborates Chen and King (2014) hypothesis that more leveraged firms obtain higher benefits from hedging.
LIST OF TABLES
Table 1 Bond rating conversion to numerical values based on S&P and Moody’s
agencies ... 17
Table 2 Industry categories, number of firms and observations ... 20
Table 3 Variables construction: names, definition, predicted sign and literature references ... 21
Table 4 Number of different firms – breakdown per country and per year ... 22
Table 5 Hedging and non-hedging firms’ statistics ... 23
Table 6 Descriptive statistics ... 24
Table 7 Regression results: Basic Model under Pooled OLS, firm fixed effect and with no systematic factors – dependent variable: ln (yield spread) ... 27
Table 8 Regression results: Adding lagged and squared variables and sample selected after 2008 year – dependent variable: ln (yield spread) ... 29
Table 9 Regression results: Adjusted Model adding different explanatory variables – dependent variable: ln (yield spread) ... 32
INDEX
1 INTRODUCTION ... 8
2 LITERATURE REVIEW ... 11
2.1 HEDGING AND CASH FLOW VOLATILITY AND IMPACTS ON THE FIRM’S MARKET VALUE AND COST OF CAPITAL ... 12
2.2 STUDIES ON DETERMINANTS OF CREDIT SPREAD ... 13
3 DATABASE AND DESCRIPTIVE STATISTICS ... 16
3.1 DEPENDENT VARIABLE: Yield spread ... 16
3.1.1 Control Variables – Bond characteristics ... 16
3.1.2 Control Variables – Firms’ characteristics ... 18
3.1.3 Systematic Control Variables and Dummies ... 19
3.2 DESCRIPTIVE STATISTICS ... 22
4 METHODS AND RESULTS ... 25
4.1 METHODS ... 25
4.2 RESULTS ... 25
4.2.1 Basic Model: Regression similar to Chen and King (2014) ... 26
4.2.2 Model with Lagged, Non-linear Variables and Sample After 2008 ... 28
4.2.3 Adjusted Model ... 30
5 FINAL CONSIDERATIONS ... 34
REFERENCES ... 36
REFERENCED BIBLIOGRAPHY ... 39
1 INTRODUCTION
The relation between the use of derivatives and wealth creation has been the study object of many authors. According to the theory derived from the classic work of Modigliani and Miller (1958), under perfect capital markets, company decisions on investments and financing are independent, and risk management should not affect firm value since an investor could synthetically reproduce the hedge individually (homemade risk management). However, the existence of market failures - bankruptcy costs, taxes, information asymmetry, imperfect competition, conflicts of interest among managers, shareholders and bondholders, restrictions on financing - favors the discussion on the potential impacts of hedging policies.
One of the main focuses of the literature has been how the use of derivatives and cash-flow volatility impact firm value and cost of capital. Regarding articles focused on Brazilian firms, Tsuji (2011) studies the relationship between cash flow volatility on firm value, Serafini and Sheng (2009) analyze the impact of the use of derivatives and firm value, and Coutinho, Sheng and Lora (2012) investigate the use of derivatives and cost of capital. Nevertheless, no known study has analyzed the impact of derivatives on the credit spread paid by Latin American firms.
Thus, the aim of this study is to answer the following question: do bondholders consider the use of derivatives in credit spread? The analysis is based on negotiations on the secondary market of USD denominated bonds issued in the international market by non-financial companies from Brazil, Chile and Mexico – according to Bastos et al. (2015), the three countries represents 93% of the volume of bonds issued in Latin America. Additionally, our paper also contributes to the analysis on how other independent variables impact the cost of debt, which is largely studied in developed markets but very rarely in emerging countries.
This theme is even more relevant when considering that Latin American companies, due to the economic and financial development of the region and the international liquidity conditions after the 2008 crisis, are increasingly substituting traditional bank financing by capital market as the main long-term source of funds – bond issuance rose sharply from USD 15 billion in 2003 to USD 77 billion in 2013 (BASTOS; KAMIL; SUTTON, 2015). Hale (2007) summarizes the two main reasons for a company to prefer bond market financing: (1) companies with extreme credit reputation - in the best or the worst credit situation - do not benefit from the
9
monitoring services of the banks and thus tend to avoid these costs, and (2) by issuing a bond, information on the firm is disseminated to a large number of creditors, reducing the “information monopoly” of banks, which subsequently reduces its spreads. It is worth noticing that besides issuing in the international market, which is the object of this study, companies from Brazil, Chile and Mexico also have the option to finance themselves through their domestic capital markets, usually governed by local regulations and indexed to the local currency. According to Galindo (2015), Brazilian firms are proportionally the ones that most access international markets, representing 72% of total issues (the sum of international and domestic issues), followed by Mexico (52%) and Chile (28%).
An additional hypothesis is that the impact of hedging policies might be even more relevant in emerging countries, whose firms, exposed to local currency – usually more volatile –, could show more extreme volatility in their balance sheets. In the selected sample, we used data starting from 2005, when the studied countries had already been using floating exchange rates – Mexico since 1994 and Brazil and Chile since 1999.
We observe a lack of studies analyzing the bond secondary market of Latin American firms, possibly due to scarcity of data. Throughout this work, we will show that most data are from 2012 or later, which would make this study impossible a few years ago. The main source of information on the secondary market is Bloomberg, based on Trade Reporting and Compliance Engine (TRACE), a mechanism developed in 2002 with the initial aim to increase transparency in the negotiations that took place in the US over-the-counter market. There is also a relatively recent movement for firms to start disclosing more details on derivatives usage in their balance sheets – the Securities and Exchange Commission of Brazil (CMV), for example, established this requirement in 2008 for publicly traded companies through Law nº 11.638.
Several tests and regressions are made in our investigation: first we tested a model similar to the one used by Chen and King (2014), in which yield spread is regressed against a derivatives dummy variable (and its interactions) and various control variables. Next, many changes are proposed and tested to validate the results – for example, we tested the model with lagged variables, different functional forms, including other control variables and controlling the sample for the period after 2008.
The empirical results obtained showed significant coefficients for the hedging variable only post-2008 period, when interacted with leverage variable.
This work is structured as follows: in Literature Review, we summarized the main studies on the theme, focusing on those relating hedging policies and cash-flow volatility to firm value and cost of capital as well as credit spread and the explanatory variables; in Database, we described how the sample was selected, the variables were calculated and present the descriptive statistics; in Methods and Results, we justified the models used and present and discuss the results obtained; in Final Considerations, we summarize this work and present ideas that may be explored and improved in a future study.
11
2 LITERATURE REVIEW
Stulz (1984) was one of the first authors to present a currency hedging model in which firms maximize their value conditioned to risk-averse agents. Afterward, several works investigated the reasons for companies to adopt derivatives, such as improving the tax efficiency of firms presenting convex tax functions (SMITH; STULZ, 1985).
According to Chen and King (2014), the Corporate Finance theory determines the value of a firm as the present value of future cash flows. Thus, hedging could act on firm value, reducing the volatility of the expected cash flow, and/or on the firm’s cost of capital, affecting discount rates. As for bonds, authors summarize that derivatives could act on the reduction in credit spreads through the following mechanisms:
a) Decreasing default risk, thus reducing bankruptcy cost: the greater the cash flow volatility, the greater the firm’s probability of bankruptcy. By smoothing out cash flow oscillations, hedging reduces the probability of bankruptcy and its associated costs.
b) Improving the level of information symmetry: since there are costs associated with information disclosure and managers might be encouraged to withhold or even distort it, the investor does not receive all the information necessary to appropriately value company assets and future cash flows. Hedging mitigates volatility and makes cash flow projections more predictable, thus reducing information asymmetry.
c) Mitigating agency problem between manager/shareholder and bondholders: managers and shareholders may refuse a project with a positive net present value (NPV) if part or all of the investment benefits are transferred to creditors in the event of a negative future scenario. A hedging policy minimizes the probability of a negative scenario, reducing the agency problem. Additionally, using derivatives also reduces the risk-shifting problem by reducing the probability of the firm suffering financial distress. The risk-shifting problem occurs when managers of firms with a high probability to go into default are encouraged to invest in high risk projects with negative NPV, with the shareholder benefiting from a positive scenario while all costs are incurred by the creditor in a negative scenario. Since
Latin America has a predominance of firms with concentrated ownership (Núñez and Oneto (2015)), the conflict with creditors tends to be even more pronounced.
Next, we categorize the literature into (1) works investigating how the use of derivatives and/or cash flow volatility impact firm value or cost of capital and (2) studies analyzing which variables can explain the fluctuations in the credit spread of loans (including bonds), also essential to the theoretical basis of our model.
2.1 HEDGING AND CASH FLOW VOLATILITY AND IMPACTS ON THE FIRM’S MARKET VALUE AND COST OF CAPITAL
A few studies analyze the effect of cash flow volatility and volatility in the accounting profit on companies’ value. Rountree, Weston and Allayannis (2008), using a sample of US companies, find that investors value the cash flow over their accounting profit (net profit), i.e., an increase in cash flow volatility reduces firm value more significantly than a increase in the volatility of the accounting profit. Tsuji (2011) finds similar (although not statistically significant) results when conducting the study with Brazilian companies.
Regarding the literature addressing directly the use of derivatives, Allayannis and Weston (2001) analyze the impact of currency hedging on 720 American non-financial companies and find a positive significant relationship between hedging and firms’ market value. Serafini and Sheng (2009), in a similar study applied to the Brazilian market, use a sample of 48 firms for the period from 1999 to 2007 but find no statistical evidence that hedging increases firm market value. Similar results are found by Steagall (2009), who also analyzes the interaction between derivatives and Corporate Governance.
One hypothesis is that results may contain noise if the investors have problems determining whether the derivative negotiation is used for hedging, speculation or just to benefit the manager. Allayannis, Lel and Miller (2012) use a sample of American Depositary Receipts (ADRs) of 372 companies from 39 countries and, assuming that the firms with the best Corporate Governance practices would be those using derivatives exclusively for hedging, find strong evidence that the positive effect of use of derivatives on firm value is more significant in those with better governance. The authors also find that the positive impact of using derivatives is
13
more relevant in countries with better investor protection legislation, concluding that it is more beneficial to firms with better corporate governance rules and in countries with institutions that protect the investor.
The impact of using derivatives on the firm’s cost of capital is also studied in the literature. Shimpi (2002) expands the traditional Weighted Average Cost of Capital (WACC) by introducing the concept of Total Average Cost of Capital (TACC), in which firms protecting themselves through derivatives and/or insurance can release the capital reserved to maintain the company’s liquidity. Therefore, a third component is added to the cost of equity (own capital) and cost of debt (third-party capital): the cost of hedging instruments (risk capital). Coutinho, Sheng and Lora (2012) investigate the impact of use of derivatives on the cost of capital for 47 Brazilian firms, but the results corroborate the theory only for the period after the 2008 crisis – the positive relationship between hedging and cost of capital before this period makes the authors presume that some companies were using derivatives for speculation purpose. Loyola (2013) complements their study by analyzing 72 Brazilian firms from 2009 to 2011, with results corroborating the hypothesis that using derivatives for hedging purpose reduces cost of capital.
2.2 STUDIES ON DETERMINANTS OF CREDIT SPREAD
Merton (1974), in one of the pioneer works on structural models for debt pricing, mentions that corporate bond spreads depends essentially on three factors:
a) interest rate of risk-free bonds;
b) characteristics and provisions of the bond (maturity date, coupon rate, seniority in the event of default, etc.);
c) company’s probability of default.
The concept is simple: after discounting the risk-free rate in a given currency, the remaining spread should reflect only the firm’s financial health and the risks of the bond itself. Therefore, systematic risks unrelated to the company’s default risk should not impact bond pricing. However, there is extensive literature indicating the existence of a “credit spread puzzle” (CHRISTENSEN, 2008): only a relatively small percentage of the variation in credit spread is explained by variables linked to the firm’s default risk. Most fluctuations can be explained by systematic variables, as the
level and slope of the US government securities (“Treasury”) yield curve, or by differences in taxes and liquidity between corporate and Treasury bonds.
In line with the “credit spread puzzle”, a study by Collin-Dufresne, Goldstein and Martin (2001) uses a sample of 688 US firms, and its results indicate that the variables related to probability of default and recovery value (value recovered by the creditor in case of default) explain only 25% of the variation in credit spread. Duffee (1998) shows that the level and slope of the Treasury yield curve alone explain almost 20% of the fluctuations in credit spread for bonds of similar ratings and maturity. Campbell and Taksler (2003) find that equity volatility is at least as powerful to explain bond spreads as credit ratings. The work of Chen and King (2014) incorporates the systematic variables and also shows a significant increase in explanatory power: the adjusted R-squared rises sharply from 0.55 to 0.70. An investigation of the period from 1997 to 2003 by Amato and Remolona (2003) indicates that the credit spread paid by a BB issuer is three times higher than the expected losses due to default, and the difference is even bigger when considering better rated firms. The authors suggest that the difference can be partially explained by the investors’ difficulty in risk diversification in the credit market, where the probability of great losses in the event of default is not matched by a possibility of significant comparable gain.
One of the explanations for the existence of the “credit spread puzzle” would be the liquidity risk – the lower the liquidity, the greater the risk premium required by the investor. Houweling, Mentink and Vorst (2005) analyze nine variables as proxies for liquidity and find that issued amount, volatility and bond age are the main determinants of the liquidity premium, but that it also varies over time. Later, Sheng and Saito (2008) conduct a similar study testing the liquidity of domestic bonds in the Brazilian market.
Notwithstanding, other academic works contradict the idea of “credit spread puzzle”. A recent study by Feldhütter and Schaefer (2016) applies an adapted Merton (1974) model using default rates for a longer period (92 years) and reaches results contrary to the “credit spread puzzle” hypothesis. King and Khang (2005) also find that, after controlling regression for default risk variables and bond features, systematic variables present limited explanatory power.
The number of studies on the relationship between cost of borrowing and hedging policies is more limited. Campello et al. (2011) analyze the effect of hedging
15
on the cost of private loans (syndicated loans) and find evidence that firms with hedging policies reduce cost of borrowing and can negotiate looser covenants. Chen and King (2014) are the first known authors to study the relationship between derivatives and the bond market. They use a sample of 1,832 US non-financial companies, and the basic model shows that hedging leads to a drop of 24bps in credit spread, with an even more expressive effect for non-investment grade firms (27bps).
The number of studies on the secondary bond market in emerging countries is scarce, probably due to lower liquidity and less information availability. In the case of Brazil, most studies investigate the primary market of domestic bonds (“debentures”). – Sheng and Saito (2005) and Paiva and Savoia (2009), for instance, investigate the credit spread of primary issues in local market. Ribeiro (2014) questions if Brazilian firms issue domestic and international bonds to protect themselves from the exposure to interest and exchange rates, respectively. The author finds no statistical evidence to support this relationship, but the investigation shows that firms already use derivatives to protect themselves from exchange risk while protection from interest risk is less frequent.
3 DATABASE AND DESCRIPTIVE STATISTICS
The database was collected from Bloomberg, the Federal Reserve Bank of St. Louis and Dartmouth College websites and financial statements of the firms. All dollar-denominated bonds from 2000 and later were selected on Bloomberg and firms from Brazil, Mexico and Chile were selected filtering by “Country of incorporation” and “Ultimate parent country”. Issues by financial companies and the government were excluded, resulting in 1,668 issues. Of these, many bonds had no information available on the negotiations in the secondary market and/or the firms failed to disclose financial data, resulting in a final sample of 359 bonds from 66 firms.
Next, further details on the variables used are given. A complete summary of the variables, references in the literature and expected relationship with the dependent variable are found in Table 3.
3.1 DEPENDENT VARIABLE: Yield spread
The dependent variable yield spread was calculated according to the methods by Klock, Mansi and Maxwell (2005) and Chen and King (2014). It is the difference between the interest rate of the corporate bond negotiated on the secondary market and of the US government (Treasury) security of the same modified duration. The yield spread for a given year was calculated using the volume negotiated in the period as the weight. Following Campello et al. (2011), we applied the natural logarithmic of yield spread as a measure to mitigate data skewness.
3.1.1 Control Variables – Bond characteristics
Duration and convexity data were collected from Bloomberg using the last business day of the year.
As proxy for liquidity, we used two variables: the natural logarithm of the total volume of bonds outstanding per company and bond age. Bond age measures the years since the issue date; the more time goes by, the higher the percentage of bonds held to maturity by investors, and thus the smaller the volume available to be negotiated in the market.
17
We used the variable coupon – the annual interest rate paid to investors – as a proxy for tax incentive (Chen; King, 2014), since higher coupon bonds are more taxed throughout their lives.
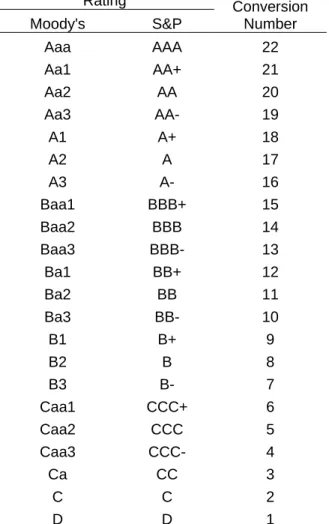
Following the methods by Klock, Mansi and Maxwell (2005) and Cheng and King (2014), the average rating was estimated by converting ratings from Moody’s and S&P into numerical values, e.g., Aaa/AAA into 22, Aa1/AA+ into 21 and so on, as shown in Table 1. All bonds in the sample were rated by at least one of the agencies and, in case they were rated by both of them, the arithmetic mean was calculated.
Table 1 – Bond rating conversion to numerical values based on S&P and Moody’s agencies Rating Conversion Number Moody's S&P Aaa AAA 22 Aa1 AA+ 21 Aa2 AA 20 Aa3 AA- 19 A1 A+ 18 A2 A 17 A3 A- 16 Baa1 BBB+ 15 Baa2 BBB 14 Baa3 BBB- 13 Ba1 BB+ 12 Ba2 BB 11 Ba3 BB- 10 B1 B+ 9 B2 B 8 B3 B- 7 Caa1 CCC+ 6 Caa2 CCC 5 Caa3 CCC- 4 Ca CC 3 C C 2 D D 1
Source: Klock et al. (2005), prepared by the author
The sample does not have convertible or put bonds. For callable bonds, i.e., those that can be redeemed by the issuers prior to their maturity, we used a dummy
variable that assumed the value one if the firm had at least one callable bond outstanding that year. As in the callable bond the bondholder implicit sells an option to the issuer, it is expected to have a positive impact on yield spread.
Once all control variables related to bond characteristics were collected, the values were consolidated into a single annual observation per firm, as proposed by Klock, Mansi and Maxwell (2005) and Chen and King (2014) – if an issuer had more than one bond outstanding in a given year, the variable was calculated using the bond outstanding volume as the weight.
3.1.2 Control Variables – Firms’ characteristics
Following the methods employed by Chen and King (2014), the hedging dummy variable, the focus of this study, was constructed using the financial statements of every company from every year and searching for the keywords: derivative, swap, NDF and hedge. If the word was found, the context was analyzed and values were assigned: 1 if the company had outstanding or negotiated foreign-exchange derivatives, interest or commodities for hedging that year and 0 otherwise. We noticed that nearly all the companies using derivatives make sure they mention this use is strictly for hedging and not speculative purpose. None of the firms in the sample has begun or finished a hedging program throughout the analyzed years.
The variable leverage, computed as total debt (sum of short-term and long-term debts) divided by total assets, should be positively related to yield spread since more leveraged companies are more likely to default.
The interest coverage ratio is calculated dividing earnings before interest, taxes, depreciation and amortization (EBITDA) by interest expenses and literature indicates a negative impact on yield spreads.
The variable profitability is calculated as EBITDA divided by total assets, and more profitable companies are expected to pay a lower credit spread.
Earnings volatility is the standard deviation of the last four years of EBITDA variation divided by total assets – the more volatile the cash flow, the greater the company’s default risk.
Firm size is the natural logarithm of total assets in USD deflated by the US consumer price index. In this case, total assets were converted into USD using the
19
year-end foreign exchange rate, in accordance with Bastos, Kamil, and Sutton (2015). The theory predicts that larger firms have a negative effect on yield spreads.
We expect higher debt coverage, measured as total debt divided by EBITDA, to be linked to a higher cost of borrowing.
3.1.3 Systematic Control Variables and Dummies
To incorporate country risk, we used 5-year CDS of Brazil, Chile and Mexico. According to the literature, the level and slope of the US yield curve are also used as systematic variables. Longstaff and Schwartz (1995) explain the expected negative sign for the relation between interest rate level and yield spread.
The three Fama-French factors (equity market premium, SMB, HML), all collected from the Dartmouth College website, control the relationship between the equity market and bond market spreads.
VIX – the implied volatility index calculated by the Chicago Board Option Exchange (CBOT) for S&P 500 companies’ options – is also used as a proxy for volatility. Collin-Dufresne, Goldstein and Martin (2001) mention that in structural credit models an increase in volatility indicates an increase in the probability of default. In the case of bonds from emerging countries, it also serves as a proxy for risk aversion and will be used only in the “Adjusted Model”.
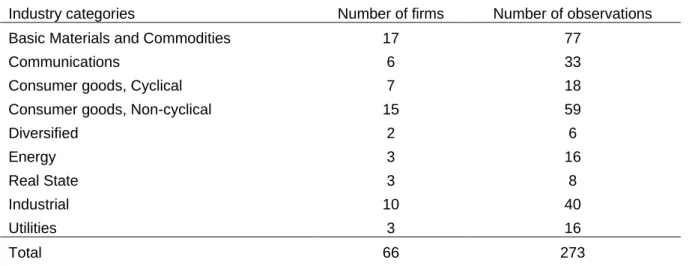
As shown in Table 2, based on Bloomberg’s classification, a dummy for each of the nine different industries was added to the models.
Table 2 – Industry categories, number of firms and observations
Industry categories Number of firms Number of observations
Basic Materials and Commodities 17 77
Communications 6 33
Consumer goods, Cyclical 7 18
Consumer goods, Non-cyclical 15 59
Diversified 2 6 Energy 3 16 Real State 3 8 Industrial 10 40 Utilities 3 16 Total 66 273
Source: Prepared by the author.
We also created a dummy variable to investigate the level of a company’s indexation to US dollar. We assigned the value 1 if the firm exported or had revenues in other countries representing at least 10% of its gross revenue. The aim of inserting the dummy is to identify potential natural hedges and how this could affect the hedging dummy.
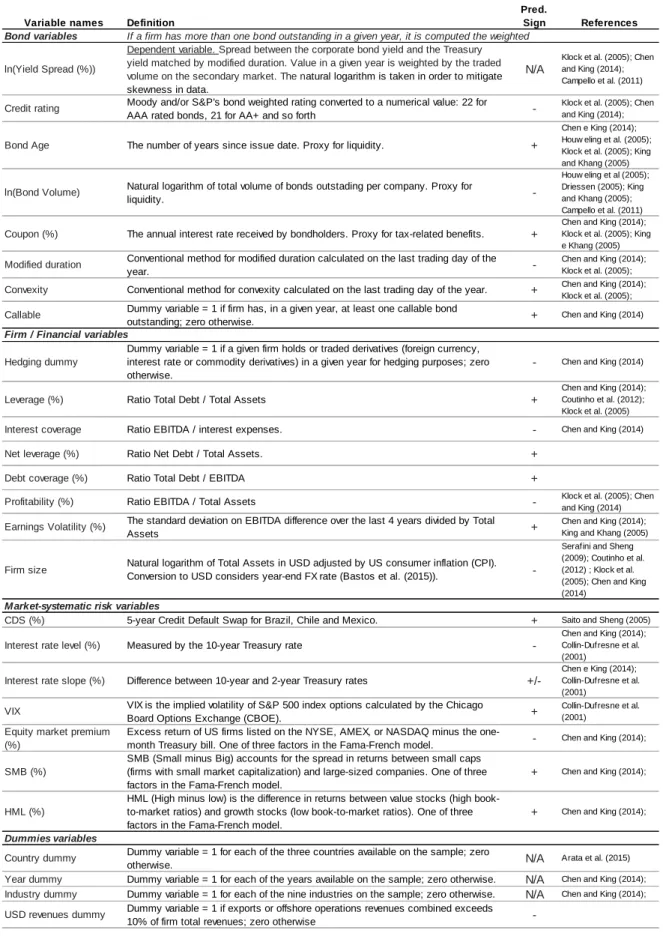
Table 3 describes each of the variables used in this work. It is important to note that not all independent variables are used simultaneously in the regressions.
21
Table 3 – Variables construction: definition, predicted sign and literature references
Source: Prepared by the author based on cited references.
Variable names Definition References
Bond variables
ln(Yield Spread (%))
Dependent variable. Spread between the corporate bond yield and the Treasury yield matched by modified duration. Value in a given year is weighted by the traded volume on the secondary market. The natural logarithm is taken in order to mitigate skewness in data.
N/A
Klock et al. (2005); Chen and King (2014); Campello et al. (2011)
Credit rating Moody and/or S&P's bond weighted rating converted to a numerical value: 22 for
AAA rated bonds, 21 for AA+ and so forth
-Klock et al. (2005); Chen and King (2014);
Bond Age The number of years since issue date. Proxy for liquidity. +
Chen e King (2014); Houw eling et al. (2005); Klock et al. (2005); King and Khang (2005)
ln(Bond Volume) Natural logarithm of total volume of bonds outstading per company. Proxy for
liquidity.
-Houw eling et al (2005); Driessen (2005); King and Khang (2005); Campello et al. (2011)
Coupon (%) The annual interest rate received by bondholders. Proxy for tax-related benefits. +
Chen and King (2014); Klock et al. (2005); King e Khang (2005)
Modified duration Conventional method for modified duration calculated on the last trading day of the
year.
-Chen and King (2014); Klock et al. (2005);
Convexity Conventional method for convexity calculated on the last trading day of the year. + Chen and King (2014); Klock et al. (2005);
Callable Dummy variable = 1 if firm has, in a given year, at least one callable bond
outstanding; zero otherwise. + Chen and King (2014)
Hedging dummy
Dummy variable = 1 if a given firm holds or traded derivatives (foreign currency, interest rate or commodity derivatives) in a given year for hedging purposes; zero otherwise.
- Chen and King (2014)
Leverage (%) Ratio Total Debt / Total Assets +
Chen and King (2014); Coutinho et al. (2012); Klock et al. (2005)
Interest coverage Ratio EBITDA / interest expenses. - Chen and King (2014)
Net leverage (%) Ratio Net Debt / Total Assets. +
Debt coverage (%) Ratio Total Debt / EBITDA +
Profitability (%) Ratio EBITDA / Total Assets - Klock et al. (2005); Chen and King (2014)
Earnings Volatility (%) The standard deviation on EBITDA difference over the last 4 years divided by Total
Assets +
Chen and King (2014); King and Khang (2005)
Firm size Natural logarithm of Total Assets in USD adjusted by US consumer inflation (CPI).
Conversion to USD considers year-end FX rate (Bastos et al. (2015)).
-Serafini and Sheng (2009); Coutinho et al. (2012) ; Klock et al. (2005); Chen and King (2014)
Market-systematic risk variables
CDS (%) 5-year Credit Default Swap for Brazil, Chile and Mexico. + Saito and Sheng (2005)
Interest rate level (%) Measured by the 10-year Treasury rate
-Chen and King (2014); Collin-Dufresne et al. (2001)
Interest rate slope (%) Difference between 10-year and 2-year Treasury rates
+/-Chen e King (2014); Collin-Dufresne et al. (2001)
VIX VIX is the implied volatility of S&P 500 index options calculated by the Chicago
Board Options Exchange (CBOE). +
Collin-Dufresne et al. (2001)
Equity market premium (%)
Excess return of US firms listed on the NYSE, AMEX, or NASDAQ minus the
one-month Treasury bill. One of three factors in the Fama-French model. - Chen and King (2014);
SMB (%)
SMB (Small minus Big) accounts for the spread in returns between small caps (firms with small market capitalization) and large-sized companies. One of three factors in the Fama-French model.
+ Chen and King (2014);
HML (%)
HML (High minus low) is the difference in returns between value stocks (high book-to-market ratios) and growth stocks (low book-book-to-market ratios). One of three factors in the Fama-French model.
+ Chen and King (2014);
Dummies variables
Country dummy Dummy variable = 1 for each of the three countries available on the sample; zero
otherwise. N/A Arata et al. (2015)
Year dummy Dummy variable = 1 for each of the years available on the sample; zero otherwise. N/A Chen and King (2014);
Industry dummy Dummy variable = 1 for each of the nine industries on the sample; zero otherwise. N/A Chen and King (2014);
USD revenues dummy Dummy variable = 1 if exports or offshore operations revenues combined exceeds
10% of firm total revenues; zero otherwise
-Pred. Sign
If a firm has more than one bond outstanding in a given year, it is computed the weighted
3.2 DESCRIPTIVE STATISTICS
Our sample consists of 359 bonds from 66 different firms, 29 of them Brazilian, 11 Chilean and 26 Mexican.
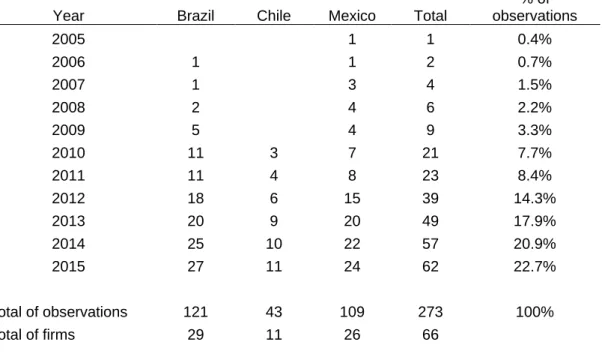
Applying the method to calculate a single annual observation per company, we obtained a total of 273 firm-year observations. The sample is concentrated in the most recent years - the period from 2012 to 2015 represents 75.8% of the database (details in Table 4) - and is significant smaller than the one collected by Chen and King (2014), whose sample amounts 1,832 firms and 10,757 observations.
Table 4 – Number of different firms – breakdown per country and per year
Year Brazil Chile Mexico Total
% of observations 2005 1 1 0.4% 2006 1 1 2 0.7% 2007 1 3 4 1.5% 2008 2 4 6 2.2% 2009 5 4 9 3.3% 2010 11 3 7 21 7.7% 2011 11 4 8 23 8.4% 2012 18 6 15 39 14.3% 2013 20 9 20 49 17.9% 2014 25 10 22 57 20.9% 2015 27 11 24 62 22.7% Total of observations 121 43 109 273 100% Total of firms 29 11 26 66
23
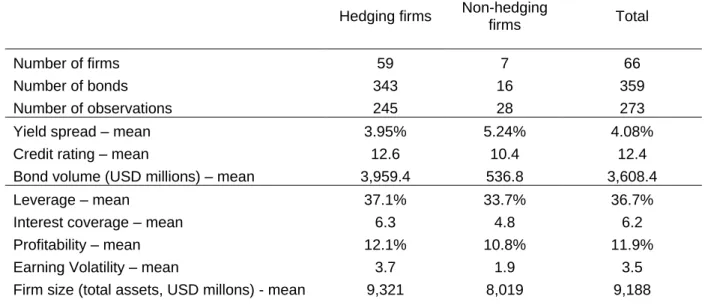
As shown in Table 5, although hedging firms are more leveraged and show higher volatility in cash flow, they present lower credit spread and better interest coverage, profitability ratios and credit rating. Regarding the hedging behavior, a small number of firms do not use derivatives - only 7 firms among the 66 -, in line with Serafini and Sheng (2009) findings for the Brazilian market (11 firms out of 48 do not use derivatives) but considerably different from data used by Chen and King (2014), where 52.8% of sample consists of non-hedging firms.
Table 5 – Hedging and non-hedging firms’ statistics
Hedging firms Non-hedging
firms Total
Number of firms 59 7 66
Number of bonds 343 16 359
Number of observations 245 28 273
Yield spread – mean 3.95% 5.24% 4.08%
Credit rating – mean 12.6 10.4 12.4
Bond volume (USD millions) – mean 3,959.4 536.8 3,608.4
Leverage – mean 37.1% 33.7% 36.7%
Interest coverage – mean 6.3 4.8 6.2
Profitability – mean 12.1% 10.8% 11.9%
Earning Volatility – mean 3.7 1.9 3.5
Firm size (total assets, USD millons) - mean 9,321 8,019 9,188 Source: Prepared by the author.
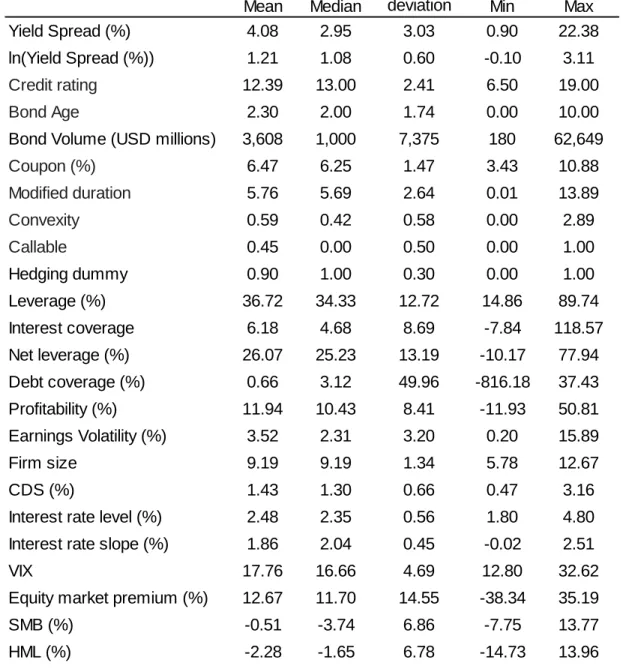
Table 6 consolidates the statistics of all variables used. Every variable is available for the 273 observations. The maximum yield spread observed (22.38%) is from a firm in default – there is a total of 11 observations whose credit spread exceeds 10%, all of them from firms that use derivatives. Since a default event is infrequent and less likely to occur in small samples, none of the non-hedging firms were in this situation.
Table 6 – Descriptive statistics
Source: Prepared by the author.
Mean Median
Standard-deviation Min Max
Yield Spread (%) 4.08 2.95 3.03 0.90 22.38
ln(Yield Spread (%)) 1.21 1.08 0.60 -0.10 3.11
Credit rating 12.39 13.00 2.41 6.50 19.00
Bond Age 2.30 2.00 1.74 0.00 10.00
Bond Volume (USD millions) 3,608 1,000 7,375 180 62,649
Coupon (%) 6.47 6.25 1.47 3.43 10.88 Modified duration 5.76 5.69 2.64 0.01 13.89 Convexity 0.59 0.42 0.58 0.00 2.89 Callable 0.45 0.00 0.50 0.00 1.00 Hedging dummy 0.90 1.00 0.30 0.00 1.00 Leverage (%) 36.72 34.33 12.72 14.86 89.74 Interest coverage 6.18 4.68 8.69 -7.84 118.57 Net leverage (%) 26.07 25.23 13.19 -10.17 77.94 Debt coverage (%) 0.66 3.12 49.96 -816.18 37.43 Profitability (%) 11.94 10.43 8.41 -11.93 50.81 Earnings Volatility (%) 3.52 2.31 3.20 0.20 15.89 Firm size 9.19 9.19 1.34 5.78 12.67 CDS (%) 1.43 1.30 0.66 0.47 3.16
Interest rate level (%) 2.48 2.35 0.56 1.80 4.80
Interest rate slope (%) 1.86 2.04 0.45 -0.02 2.51
VIX 17.76 16.66 4.69 12.80 32.62
Equity market premium (%) 12.67 11.70 14.55 -38.34 35.19
SMB (%) -0.51 -3.74 6.86 -7.75 13.77
25
4 METHODS AND RESULTS
4.1 METHODS
The database created is a panel with unbalanced data. Wooldridge (2007) points out that the main econometric models for this case are fixed effect or random effect.
The assessment on which model is the most appropriate was made by the Hausman test and the hypothesis of homoscedasticity was tested by the White test. We applied the Hausman and White tests every time we altered the analyzed model, i.e., when we added, modified, lagged or changed the functional form of the explanatory variables. The Variance Inflation Factor (VIF) was also applied in order to quantify multicollinearity.
Stata was used to run every regression and test.
Based on the regression below, adapted from Chen and King (2014), we proposed and tested alterations.
ln(𝑌𝑖𝑒𝑙𝑑𝑆𝑝𝑟𝑒𝑎𝑑𝑖,𝑡) = 𝛼0 + 𝛽1𝐷𝑢𝑚𝑚𝑦𝐻𝑒𝑑𝑔𝑖𝑛𝑔𝑖,𝑡+𝛽2𝐶𝑟𝑒𝑑𝑖𝑡𝑅𝑎𝑡𝑖𝑛𝑔𝑖,𝑡+ 𝛽3𝐵𝑜𝑛𝑑𝐴𝑔𝑒𝑖,𝑡+𝛽4𝐶𝑜𝑢𝑝𝑜𝑛𝑖,𝑡+𝛽5𝑀𝑜𝑑𝑖𝑓𝑖𝑒𝑑𝐷𝑢𝑟𝑎𝑡𝑖𝑜𝑛𝑖,𝑡+𝛽6𝐶𝑜𝑛𝑣𝑒𝑥𝑖𝑡𝑦𝑖,𝑡+ 𝛽7𝐷𝑢𝑚𝑚𝑦𝐶𝑎𝑙𝑙𝑎𝑏𝑙𝑒𝑖,𝑡+𝛽8𝐿𝑒𝑣𝑒𝑟𝑎𝑔𝑒𝑖,𝑡 +𝛽9𝐼𝑛𝑡𝑒𝑟𝑒𝑠𝑡𝐶𝑜𝑣𝑒𝑟𝑎𝑔𝑒𝑖,𝑡+ 𝛽10𝑃𝑟𝑜𝑓𝑖𝑡𝑎𝑏𝑖𝑙𝑖𝑡𝑦𝑖,𝑡+𝛽11𝐸𝑎𝑟𝑛𝑖𝑛𝑔𝑠𝑣𝑜𝑙𝑎𝑡𝑖𝑙𝑖𝑡𝑦𝑖,𝑡+𝛽12𝐹𝑖𝑟𝑚𝑆𝑖𝑧𝑒𝑖,𝑡+𝛽12𝐶𝐷𝑆𝑖,𝑡+ 𝛽13𝐼𝑛𝑡𝑒𝑟𝑒𝑠𝑡𝑟𝑎𝑡𝑒𝑙𝑒𝑣𝑒𝑙𝑡+𝛽14𝐼𝑛𝑡𝑒𝑟𝑒𝑠𝑡𝑟𝑎𝑡𝑒𝑠𝑙𝑜𝑝𝑒𝑡+ 𝛽15𝐸𝑞𝑢𝑖𝑡𝑦𝑚𝑎𝑟𝑘𝑒𝑡𝑝𝑟𝑒𝑚𝑖𝑢𝑚𝑡+𝛽16𝑆𝑀𝐵𝑡+𝛽17𝐻𝑀𝐿𝑡+𝐶𝑜𝑢𝑛𝑡𝑟𝑦𝐷𝑢𝑚𝑚𝑖𝑒𝑠𝑖+ 𝐼𝑛𝑑𝑢𝑠𝑡𝑟𝑦𝐷𝑢𝑚𝑚𝑖𝑒𝑠𝑖+𝜀𝑖,𝑡
Where i is the firm and t is the year.
4.2 RESULTS
In the following results, variables were considered statistically significant if their p-value was less than 10%.
Both in Hausman and White tests, the null hypothesis was strongly rejected (p-value less than 0.1% in all tests). Thus, we chose the fixed effect model and, to correct the heteroscedasticity problem, used robust standard errors in all regressions. The R-squared reported on the fixed effect model is the R-squared within.
In line with the reported by Chen and King (2014), we also presented the OLS result for some regressions; however, we believe that the results under fixed effect are the most statistically consistent.
Since the fixed effect model calculates the difference among periods for the same firm, the dummy variables hedging, industry and country, which do not vary over time, are excluded from the regression. To overcome this limitation, we used the interaction between the dummy variables and other explanatory variables.
In the case of hedging, the interaction with the other variables was based on Chen and King (2014). We combined hedging with leverage to test default risk – literature points that the most leveraged firms benefit the most from hedging policies – and used as a proxy for the agency problem the interaction of hedging with interest coverage and earnings volatility.
Although it was tested several different models and specifications, hedging presented, under fixed effect, a statistically significant coefficient only on Model 6, when it was interacted with leverage for the post-2008 period. Models 1 to 8 report results for hedging interaction with leverage and appendix shows results of the interaction with interest coverage and earnings volatility in the Basic Model (models 10 to 13).
4.2.1 Basic Model: Regression similar to Chen and King (2014)
In Table 7 we report the results using a model similar to the main one used by Chen and King (2014). Among the 25 control variables applied in their base regression, three – Altman's Z-score, market-to-book ratio and private debt ratio – were not used due to data unavailability in 14 firms (21.2% of the sample). The variable market credit premium was replaced by the 5-year CDS from Brazil, Mexico and Chile, and a dummy variable was added for each country. We also decided to not use year-dummy variable - the exclusion is also supported by the literature as many authors (COLLIN-DUFRESNE; GOLDSTEIN; MARTIN, 2001; KING; KHANG,
27
2005; KLOCK; MANSI; MAXWELL, 2005; CAMPELLO et al., 2011) do not use year dummies on their regressions.
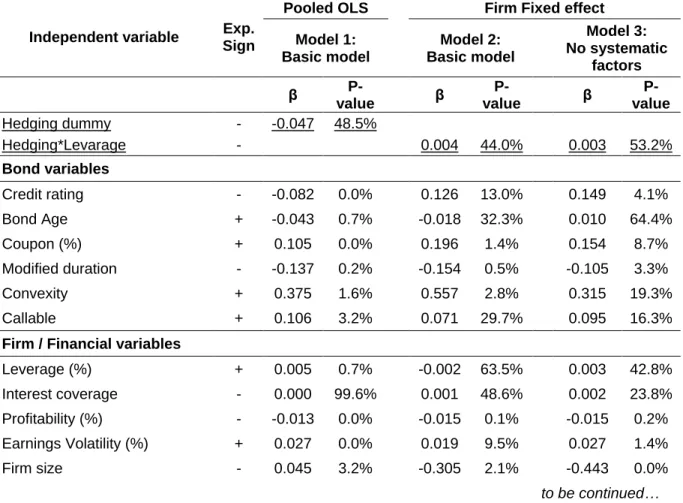
Following these authors, we report the results by pooled OLS (Model 1) and by fixed effect (Model 2). In both models, the variable hedging and the interaction with the leverage dummy failed to show statistically significant results.
Under fixed effect, with the validity of results corroborated by the Hausman test, of the eleven significant variables, only the credit rating coefficient presented a sign different from the predicted by the literature. One of the hypotheses for this result is that, as the rating is assigned at the issuance of the bond, in the fixed effects model the variable credit rating varies only if the firm issues a new bond with a different credit rating, which is relatively scarce in the sample — changes in credit rating were detected in only 59 observations. It is worth noting that, after excluding the interaction with hedging, the variable leverage was statistically significant.
Table 7 ‒ Regression results: Basic Model under Pooled OLS, firm fixed effect and with no systematic factors – dependent variable: ln (yield spread)
Independent variable Exp.
Sign
Pooled OLS Firm Fixed effect
Model 1: Basic model Model 2: Basic model Model 3: No systematic factors β P-value β P-value β P-value Hedging dummy - -0.047 48.5% Hedging*Levarage - 0.004 44.0% 0.003 53.2% Bond variables Credit rating - -0.082 0.0% 0.126 13.0% 0.149 4.1% Bond Age + -0.043 0.7% -0.018 32.3% 0.010 64.4% Coupon (%) + 0.105 0.0% 0.196 1.4% 0.154 8.7% Modified duration - -0.137 0.2% -0.154 0.5% -0.105 3.3% Convexity + 0.375 1.6% 0.557 2.8% 0.315 19.3% Callable + 0.106 3.2% 0.071 29.7% 0.095 16.3%
Firm / Financial variables
Leverage (%) + 0.005 0.7% -0.002 63.5% 0.003 42.8% Interest coverage - 0.000 99.6% 0.001 48.6% 0.002 23.8% Profitability (%) - -0.013 0.0% -0.015 0.1% -0.015 0.2% Earnings Volatility (%) + 0.027 0.0% 0.019 9.5% 0.027 1.4% Firm size - 0.045 3.2% -0.305 2.1% -0.443 0.0% to be continued…
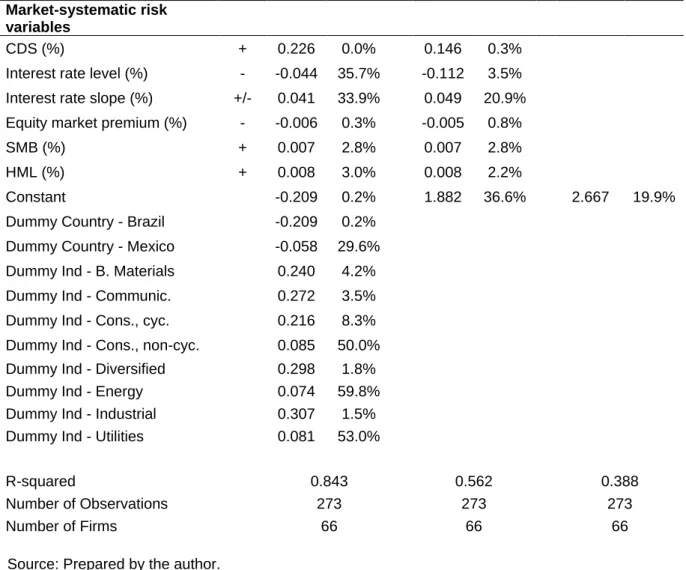
… continuation and conclusion Market-systematic risk
variables
CDS (%) + 0.226 0.0% 0.146 0.3%
Interest rate level (%) - -0.044 35.7% -0.112 3.5% Interest rate slope (%) +/- 0.041 33.9% 0.049 20.9% Equity market premium (%) - -0.006 0.3% -0.005 0.8%
SMB (%) + 0.007 2.8% 0.007 2.8%
HML (%) + 0.008 3.0% 0.008 2.2%
Constant -0.209 0.2% 1.882 36.6% 2.667 19.9% Dummy Country - Brazil -0.209 0.2% Dummy Country - Mexico -0.058 29.6% Dummy Ind - B. Materials 0.240 4.2%
Dummy Ind - Communic. 0.272 3.5%
Dummy Ind - Cons., cyc. 0.216 8.3% Dummy Ind - Cons., non-cyc. 0.085 50.0% Dummy Ind - Diversified 0.298 1.8%
Dummy Ind - Energy 0.074 59.8%
Dummy Ind - Industrial 0.307 1.5% Dummy Ind - Utilities 0.081 53.0%
R-squared 0.843 0.562 0.388
Number of Observations 273 273 273
Number of Firms 66 66 66
Source: Prepared by the author.
In line with the discussion on the “credit premium puzzle”, we also evaluated the importance of systematic variables in the model. We noticed that after excluding the variables related to systematic risk (Model 3), the explanatory power of our model shows a substantial reduction – R-squared goes from 0.562 to 0.388. The interaction between hedging and leverage remained not relevant.
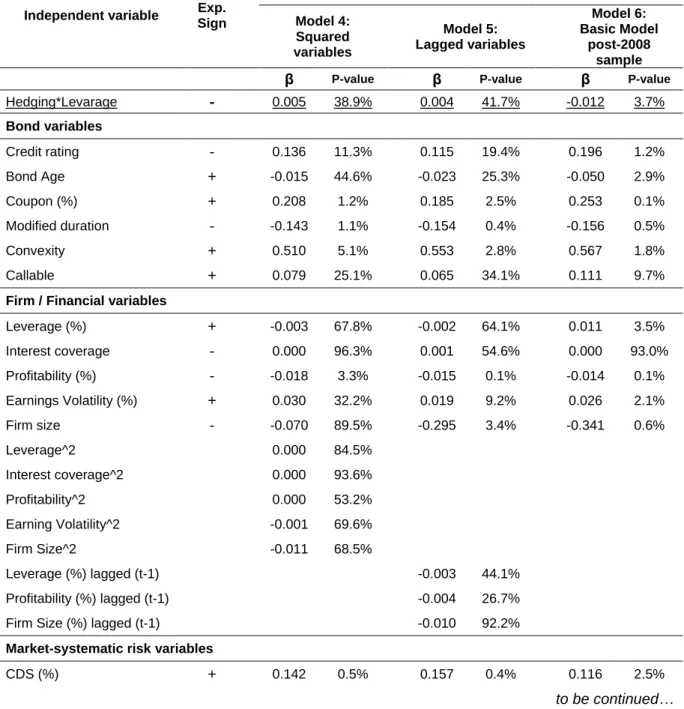
4.2.2 Model with Lagged, Non-linear Variables and Sample After 2008
Table 8 presents the results we obtained by testing the control variables in other functional forms (Model 4), lagged in one period (Model 5) and selecting the sample for the period after 2008 (Model 6).
Collin-Dufresne, Goldstein and Martin (2001) mention that structural credit models can predict that the yield spread is also a function of explanatory variables in
29
other functional forms or time lagged. None of the financial variables in the squared form or lagged (Model 4 and 5) showed statistically significant coefficients. We tested the same variables in logarithmic form, but there was no change in statistical relevance; hence, results were not reported. We did not include lagged earnings volatility because it is already a historical variable, based on the last four years, nor did we lag interest coverage because it is not available for some firms in the sample.
Table 8 – Regression results: Adding lagged and squared variables and sample selected after 2008 year – dependent variable: ln (yield spread)
Independent variable Exp. Sign
Firm Fixed effect
Model 4: Squared variables Model 5: Lagged variables Model 6: Basic Model post-2008 sample
β P-value β P-value β P-value
Hedging*Levarage - 0.005 38.9% 0.004 41.7% -0.012 3.7% Bond variables Credit rating - 0.136 11.3% 0.115 19.4% 0.196 1.2% Bond Age + -0.015 44.6% -0.023 25.3% -0.050 2.9% Coupon (%) + 0.208 1.2% 0.185 2.5% 0.253 0.1% Modified duration - -0.143 1.1% -0.154 0.4% -0.156 0.5% Convexity + 0.510 5.1% 0.553 2.8% 0.567 1.8% Callable + 0.079 25.1% 0.065 34.1% 0.111 9.7%
Firm / Financial variables
Leverage (%) + -0.003 67.8% -0.002 64.1% 0.011 3.5% Interest coverage - 0.000 96.3% 0.001 54.6% 0.000 93.0% Profitability (%) - -0.018 3.3% -0.015 0.1% -0.014 0.1% Earnings Volatility (%) + 0.030 32.2% 0.019 9.2% 0.026 2.1% Firm size - -0.070 89.5% -0.295 3.4% -0.341 0.6% Leverage^2 0.000 84.5% Interest coverage^2 0.000 93.6% Profitability^2 0.000 53.2% Earning Volatility^2 -0.001 69.6% Firm Size^2 -0.011 68.5% Leverage (%) lagged (t-1) -0.003 44.1% Profitability (%) lagged (t-1) -0.004 26.7% Firm Size (%) lagged (t-1) -0.010 92.2% Market-systematic risk variables
CDS (%) + 0.142 0.5% 0.157 0.4% 0.116 2.5%
… continuation and conclusion
Interest rate level (%) - -0.111 5.1% -0.113 3.2% -0.248 11.4% Interest rate slope (%) +/- 0.050 20.2% 0.044 28.7% 0.032 87.4% Equity market premium (%) - -0.005 1.6% -0.005 1.0% 0.003 38.5% SMB (%) + 0.006 3.8% 0.006 4.6% -0.002 62.5% HML (%) + 0.008 3.0% 0.008 2.0% -0.004 30.8% Constant 0.363 91.1% 2.227 29.7% 1.397 47.9% R-squared 0.565 0.565 0.588 Number of Observations 273 273 260 Number of Firms 66 66 65
Source: Prepared by the author.
Regarding sample selection, the results of the study by Coutinho, Sheng and Lora (2012) indicate that Brazilian firms were possibly making use of derivatives until the 2008 crisis for purposes other than hedging and reduction in cash flow volatility. To address this concern, in Model 6 we selected the data since 2009, which caused the sample size to decrease from 273 to 260 observations.
The coefficients for leverage and its interaction with hedging are, for the first time, statistically significant. The negative coefficient for the hedging interaction indicates that firms with higher leverage ratio are the most benefited from the use of derivatives.
Apart from CDS, the systematic factors are not statistically significant. The bond-related variables credit rating and bond age showed significant results but inconsistent signal given literature. The other significant variables – coupon, modified duration, convexity, callable, profitability, earnings volatility, firm size and CDS – reported results in line with theory. The explanatory power of the model with a reduced sample showed a slightly increase when compared with the model with a full sample – R-squared of 0,588 in Model 6, against 0,562 in Model 2.
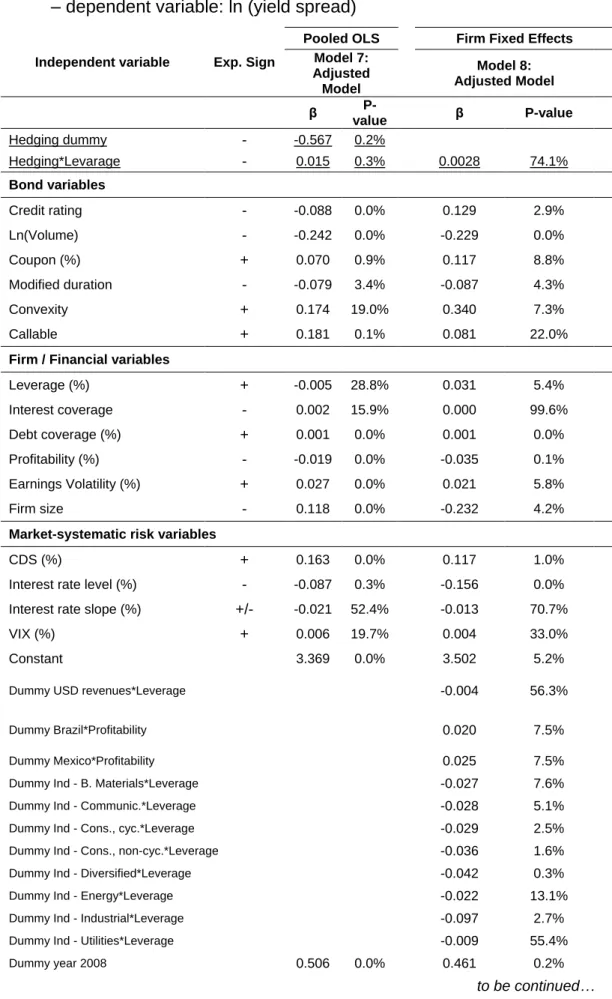
4.2.3 Adjusted Model
In this section, we test different independent variables in order to find the model with stronger explanatory power and check its impact on the hedging variable. As shown in table 9, the interaction between hedging and leverage remained not relevant under fixed effects (Model 8).
31
Among the changes proposed in the Adjusted Model, we replaced the proxy variable for liquidity bond age by log of the volume issued per company, which showed a significant coefficient with the expected sign. As for systematic variables, we excluded the three Fama-French factors, whose coefficients were also not significant, and included the VIX variable. It was also included a year-dummy for 2008 to capture the impact of the Financial Crisis and a dummy variable to control companies with relevant revenues in other currencies.
In addition to the variables reported in the table, we tested other financial ratios – asset turnover (revenues / total assets) instead of profitability, net leverage (net debt / total assets) and long-term leverage (long-term debt/total assets) in place of leverage – that were not reported because they failed to show statistically superior results. The ratio debt coverage (total debt / EBITDA), a financial covenant frequently included on bonds’ documentation, showed strong statistical relevance when added to the model (t-statistic of 4.08).
Unlike previous regressions, in which applying the fixed effect omitted the country and industry dummy variables, these were reinserted in the Adjusted Model through interaction with profitability and leverage, respectively. We chose to combine the country dummy with profitability due to its greater statistical relevance in comparison with interactions with the other financial variables. The preference for interacting the industry dummy with leverage followed the assumption that the industries have different leverage levels,a hypothesis corroborated by the statistically significant leverage coefficient.
Of the eleven significant variables, only the credit rating coefficient presented a sign different from the predicted by the literature.
Again, following Chen and King (2014), we also reported results using pooled OLS (Model 7), although we believe they are not reliable since the Hausman test rejected the null hypothesis once more. It was found a significantly negative relationship between hedging and yield spreads, but the interaction between hedging and leverage shows a sign opposite from that expected by the literature.
Table 9 – Regression results: Adjusted Model adding different explanatory variables – dependent variable: ln (yield spread)
Independent variable Exp. Sign
Pooled OLS Firm Fixed Effects Model 7: Adjusted Model Model 8: Adjusted Model β P-value β P-value Hedging dummy - -0.567 0.2% Hedging*Levarage - 0.015 0.3% 0.0028 74.1% Bond variables Credit rating - -0.088 0.0% 0.129 2.9% Ln(Volume) - -0.242 0.0% -0.229 0.0% Coupon (%) + 0.070 0.9% 0.117 8.8% Modified duration - -0.079 3.4% -0.087 4.3% Convexity + 0.174 19.0% 0.340 7.3% Callable + 0.181 0.1% 0.081 22.0%
Firm / Financial variables
Leverage (%) + -0.005 28.8% 0.031 5.4% Interest coverage - 0.002 15.9% 0.000 99.6% Debt coverage (%) + 0.001 0.0% 0.001 0.0% Profitability (%) - -0.019 0.0% -0.035 0.1% Earnings Volatility (%) + 0.027 0.0% 0.021 5.8% Firm size - 0.118 0.0% -0.232 4.2%
Market-systematic risk variables
CDS (%) + 0.163 0.0% 0.117 1.0%
Interest rate level (%) - -0.087 0.3% -0.156 0.0% Interest rate slope (%) +/- -0.021 52.4% -0.013 70.7%
VIX (%) + 0.006 19.7% 0.004 33.0%
Constant 3.369 0.0% 3.502 5.2%
Dummy USD revenues*Leverage -0.004 56.3%
Dummy Brazil*Profitability 0.020 7.5%
Dummy Mexico*Profitability 0.025 7.5%
Dummy Ind - B. Materials*Leverage -0.027 7.6%
Dummy Ind - Communic.*Leverage -0.028 5.1%
Dummy Ind - Cons., cyc.*Leverage -0.029 2.5%
Dummy Ind - Cons., non-cyc.*Leverage -0.036 1.6%
Dummy Ind - Diversified*Leverage -0.042 0.3%
Dummy Ind - Energy*Leverage -0.022 13.1%
Dummy Ind - Industrial*Leverage -0.097 2.7%
Dummy Ind - Utilities*Leverage -0.009 55.4%
Dummy year 2008 0.506 0.0% 0.461 0.2%
33
… continuation and conclusion
Dummy USD revenues - 0.014 85.6%
Dummy Country - Brazil -0.132 3.8%
Dummy Country - Mexico 0.007 90.1%
Dummy Ind - B. Materials 0.167 13.8%
Dummy Ind - Communic. 0.208 8.5%
Dummy Ind - Cons., cyc. 0.110 33.3%
Dummy Ind - Cons., non-cyc. 0.059 63.5%
Dummy Ind - Diversified 0.167 16.5%
Dummy Ind - Energy 0.053 69.8%
Dummy Ind - Industrial 0.183 10.0%
Dummy Ind - Utilities -0.041 73.0%
R-squared 0.860 0.669
Number of Observations 273 273
Number of Firms 66 66
5 FINAL CONSIDERATIONS
This dissertation examined the impact of the use of derivatives on the credit spread of the bonds issued by 66 non-financial companies from Brazil, Chile and Mexico. The yield spread data were based on the negotiations on the secondary market from 2005 to 2015.
To test the hypothesis that hedging policies reduce yield spread, we performed different regressions: (1) Basic Model, similar to the one used by Cheng and King (2014), with and without the inclusion of systematic variables; (2) some alterations in the Basic Model suggested by the literature, such as including lagged financial control variables and these variables in other functional forms and restricting the sample to the period after 2008; (3) Adjusted Model, combining variables that were statistically significant with other independent variables, including a dummy variable to control companies with relevant revenues in other currencies. Based on fixed effect model, hedging variable was interacted with leverage, interest coverage and earnings volatility. We only found a significant coefficient for hedging and leverage interaction for the post-2008 period, supporting Coutinho, Sheng and Lora (2012) findings that companies were using derivatives for speculative purpose before the financial crisis. Result also corroborates Chen and King (2014) hypothesis that more leveraged firms obtain higher benefits from hedging.
As far as is known, this study is a pioneer in using data from the secondary market for the three countries studied and is also useful to investigate the impact of other explanatory variables on yield spread, which is scarce in the literature. The vast majority of independent variables with significant statistics showed the sign expected by the theory, and the explanatory power of the model (R-squared) is in line with the values found in the literature.
Some hypotheses may justify the results. One is that as default events are relatively rare, as pointed out by Amato and Remolona (2003), a significantly larger sample would be necessary for both firms using and not using derivatives to be in financial distress – in our sample, all observations with yield spreads exceeding 10% (indicative of being close to default) are from firms that hedge, in line with the fact that these firms represent 89.7% of the observations. Another assumption is that bond covenants may be already mitigating agency costs in our sample, reducing the benefit of derivatives usage.
35
For future studies, we hope that the increase in available data enables the incorporation of tests conducted in other investigations such as weighting the use of derivatives by the firm’s governance level, adding the details of bond covenants, testing thoroughly how the hedging policy acts on the three main channels (default risk, information symmetry, agency cost), combining the use of derivatives with the level of exposure of each firm, or even extending the study to the domestic capital market.
REFERENCES
ALLAYANNIS, G.; LEL, U.; MILLER, D. P. The use of foreign currency derivatives, corporate governance, and firm value around. Journal of International Economics, v. 87, n. 1, p. 65-79, May 2012.
ALLAYANNIS, G.; WESTON, J. P. The use of foreign currency derivatives and firm market value. Rev. Financ. Stud., v. 14, p. 243-276, 2001.
AMATO, J. D.; REMOLONA, E. M. The credit spread puzzle. BIS Quarterly Review, p. 51-63, December 2003. Available from:
<http://www.bis.org/publ/qtrpdf/r_qt0312.pdf>. Access in: 2 out. 2016.
BASTOS, Fabiano Rodrigues; KAMIL, Herman; SUTTON, Bennett. Corporate financing trends and balance sheet risks in Latin America: taking stock of “The Bon(d)anza”. IMF Working Paper, 15/10, Jan. 2015.
CAMPBELL, J. Y.; TAKSLER, G. B. Equity volatility and corporate bond yields. J. Financ., v. 58, p. 2321-2349, 2003.
CAMPELLO, M. et al. The real and financial implications of corporate hedging. Journal of Finance, v. 66, p. 1615-1647, 2011.
CHEN, Jun; KING, Tao-Hsien Dolly. Corporate hedging and the cost of debt. Journal of Corporate Finance, v. 29, issue C, p. 221-245, 2014.
CHRISTENSEN, Jens. The Corporate Bond Credit Spread Puzzle. FRBSF Economic Letter, n. 10, March 2008. Available from:
<http://www.frbsf.org/economic-research/publications/economic-letter/2008/march/corporate-bond-credit-spread/>. Access in: 15 jul. 2016.
COLLIN-DUFRESNE, Pierre; GOLDSTEIN, Robert S.; MARTIN, J. Spencer. The Determinants of Credit Spread Changes. Journal of Finance, v. 56, n. 6, p. 2.177-2.207, December 2001.
COUTINHO, J. R. R. S.; SHENG, H. H.; LORA, M. I. The use of Fx derivatives and the cost of capital: evidence of Brazilian companies. Emerging Markets Review, v. 13, n. 4, p. 411-423, 2012.
DUFFEE, Gregory R. The Relation between Treasury Yields and Corporate Bond Yield Spreads. Journal of Finance, v. 53, n. 6, p. 2.225-2.241, Dec.1998.
FELDHÜTTER, Peter; SCHAEFER, Stephen. The myth of the credit spread Puzzle. London: London Business School, 2016.
37
GALINDO, Héctor Pérez, D. Eng. Corporate governance and risk identification for debt instrument issuance in Brazil, Colombia and Mexico: a methodological proposal. In: NÚÑEZ, Georgina; ONETO, Andrés (Coords.). Corporate governance in Brazil, Chile, Colombia, Mexico and Peru: The determinants of risk in corporate debt issuance. [S.l.]: Cepal, 2015. p. 27-62.
HALE, Galina. Prospects for China’s Corporate Bond Market. FRBSF Economic
Letter, n. 7, Mar. 2007. Available from: <http://www.frbsf.org/economic- research/publications/economic-letter/2007/march/china-corporate-bond-market/#subhead2>. Access in: 20 nov. 2016.
HOUWELING, Patrick; MENTINK, Albert; VORST, Ton. Comparing Possible Proxies of Corporate Bond Liquidity. Journal of Banking and Finance, v. 29, p. 1.331-1.358, 2005.
KING, T. H. D.; KHANG, K. On the importance of systematic risk factors in explaining the cross-section of corporate bond yield spreads. Journal of Banking and Finance, v. 29, n. 12, p. 3141-3158, 2005.
KLOCK, Mark S.; MANSI, Sattar A.; MAXWELL, William F. Does Corporate Governance Matter to Bondholders? The Journal of Financial and Quantitative Analysis, v. 40, n. 4, p. 693-719, Dec., 2005.
LONGSTAFF, F.; SCHWARTZ, E. A simple approach to valuing risky fixed and floating rate debt. The Journal of Finance, v. 50, n. 3, p. 789-819, 1995.
LOYOLA, Bruno Mota. O uso de derivativos e o custo de capital total ponderado. 2013. 43 p. Dissertação (Mestrado em Economia) ‒ Fundação Getúlio Vargas, São Paulo, 2013.
MERTON, R. C. On the Pricing of Corporate Debt: The Risk Structure of Interest Rates. The Journal of Finance, v. 29, issue 2, p. 449-470, 1974.
MODIGLIANI, F. & MILLER, M. The cost of capital, corporation finance and the theory of investment. (1958) American Economic Review, 48: 261-297.
NÚÑEZ, Georgina; ONETO, Andrés (Coords.). Corporate governance in Brazil, Chile, Colombia, Mexico and Peru: The determinants of risk in corporate debt issuance. [S.l.]: Economic Commission for Latin America and the Caribbean
(ECLAC); CAF ‒ Development Bank of Latin America; Inter-American Development Bank (IDB), 2015.
PAIVA, Eduardo Vieira dos Santos; SAVOIA, José Roberto Ferreira. Pricing
corporate bonds in Brazil: 2000 to 2004. Journal of Business Research, v. 62, n. 9, p. 916-919, 2009.
RIBEIRO, Paulo Sergio Oliveira. Mitigação de exposição a juros e moedas por meio de instrumento de dívidas corporativas no Brasil. 2014. 30 p. Dissertação (Mestrado Profissional em Economia) ‒ Fundação Getúlio Vargas, São Paulo, 2014.
ROUNTREE, B.; WESTON, J. P.; ALLAYANNIS, G. Do investors value smooth performance? Journal of Financial Economics, v. 90, issue 3, p. 237-251, 2008.
SERAFINI, D.; SHENG, H. H. O uso de derivativos da taxa de câmbio e o valor de mercado das empresas: Um estudo sobre o pass-through no mercado de ações brasileiro. São Paulo: FGV, 2009.
SHENG, H. H.; SAITO, R. Liquidez das debêntures no mercado brasileiro. Revista de Administração (RA-USP), v. 43, p. 1-21, 2008.
SHENG, H. H.; SAITO, R. Determinantes de spread das debêntures no mercado brasileiro. Revista de Administração (FEA-USP), São Paulo, v. 40, n. 2, p. 193-205, 2005.
SHIMPI, Prakash. Integrating Risk Management and Capital Management. Journal of Applied Corporate Finance, v. 14, issue 4, p. 27-40, 2002.
SMITH, C.; STULZ, R. The determinants of firm’s hedging policies. Journal of Financial and Quantitative Analysis, v. 20, p. 391-405, dez. 1985.
STEAGALL JUNIOR, L. A utilização de derivativos aliada às melhores práticas de Governança Corporativa adiciona valor para os Acionistas? 2009. 39 p. Dissertação (Mestrado Profissional em Macroeconomia e Finanças Aplicadas) ‒ Faculdade IBMEC, São Paulo, 2009.
STULZ, R. Optimal Hedging Policies. Journal of Financial and Quantitative Analysis, v. 19, p. 127-140, 1984.
TSUJI, Bruno. Gerenciamento de risco e valor no Brasil: um estudo empírico. 2011. 33 p. Dissertação (Mestrado em Economia) ‒ Fundação Getúlio Vargas, São Paulo, 2011.
WOOLDRIDGE, Jeffrey M. Introdução à Econometria: Uma abordagem moderna. São Paulo: Tompson Learning, 2007.