F
F
financial
risk
exposures
and
risk
management
:
evidence
from
european
nonfinancial
firms
MARIA JOÃO DA SILVA JORGE
Mestra em Economia e Estratégia Industrial pela Faculdade de Economia da Universidade de Coimbra (Portugal). Assistente de 2º triênio do Departamento de Gestão e Economia
do Instituto Politécnico de Leiria (Portugal). Morro do Lena, Alto Vieiro, Azoia – Leiria – Portugal – CEP 2411-901 E-mail: [email protected]
MÁRIO ANTÓNIO GOMES AUGUSTO
69
A B S T R A C T
Previous empirical studies concerning corporate risk management have attemp-ted to show that the use of derivatives as a hedging mechanism can be value enhancing. Implicit to these tests has been the assumption that firms use deri-vatives solely for the purpose of hedging. There is substantial literature con-cerning nonfinancial firms that suggest that changes in financial prices affect firms’ value. Furthermore, it is a common belief that financial price exposures are created via firms’ real operations and are reduced through the implementa-tion of financial hedging strategies. We use monthly returns of 304 European firms traded in Euronext over the period from 2006-2008 to analyse whether risk management practices are associated with lower levels of risk. We pursue Jorion (1990) and Allayannis and Ofek (2001) two stages framework to inves-tigate, firstly, the relationship between firm value and financial risk exposures; subsequently, the risk behaviour inherent to firms’ real operations and to the use of derivatives and other risk management instruments. So, we argue that hedging policies affect the firm’s financial risk exposures; however, we do not discard the fact that the magnitude of a firm’s exposure to risks affects hedging activities. The interaction between financial price exposures and hedging acti-vities is tested by using the Seemingly Unrelated Regression (SUR) procedure. Our major findings are as follows: Firstly, we find evidence that the sample firms exhibit higher percentages of exposure to the three categories of risks analysed when compared to previous empirical studies. Secondly, we find that hedging is significantly associated with financial price exposure. Our results are also consis-tent with the idea that financial risk exposure and hedging activities are endoge-nously related, but only in what respects the exchange risk and commodity risk exposure.
K E Y W O R D S
70
1
M O T I VAT I O N A N D O V E R V I E W
Over the last three decades, we have assisted to an increase in the volatili-ty of the prices of financial and nonfinancial assets. In face of this realivolatili-ty, risk management activities have become standard practices for firms facing financial risks. At first glance, this development seems to highlight the potential bene-fits perceived by corporate agents at the firm’s value level. However, despite the current popularity of risk management, there is a large discussion in academic literature concerning the truthful contribution of risk management to firm value (CARTER; ROgERS; SImkInS, 2006; JIn; JORIOn, 2006).
The vast majority of the existing empirical literature has attempted to show that the use of derivatives as a hedging mechanism can be value enhancing; initially, by trying to uncover which theory of hedging best describes firms’ use of derivatives (BARTRAm; BROWn; FEHLE, 2009; mARSDEn; PREvOST, 2005); later, by testing directly the impact of risk management activities on firm value (gUAy; kOTHARI, 2003; JIn; JORIOn, 2006). Implicit to these tests has been the assumption that firms use derivatives solely for the purpose of hedging. However, despite firms’ pronouncements in favour of derivatives use for hedging purposes, it is not clear whether this is the case.
The view that volatility of financial prices affects a firm’s value and, therefore, the price of its stocks is generally recognized. In this context, there is substantial literature concerning nonfinancial firms that suggests that changes in financial prices (foreign exchange rate, interest rate and commodity prices) affect firms’ value. The main focus is on foreign exchange exposures (HAgELIn; PRAm-BORg, 2004; HE; ng, 1998; JORIOn, 1990) or (less often) on interest rate expo-sures (BARTRAm, 2002; SWEEnEy; WARgA, 1986). In contrast, the impact of commodity price changes on corporations is analysed only in a few studies (BARTRAm, 2005; TUFAnO, 1998). However, these studies have met limited success in documenting significant financial price exposures (BARTRAm, 2005; HAgELIn; PRAmBORg, 2004; JORIOn, 1990).
71
firms of four selected industries, analyse simultaneously the three categories of risks and find that hedging with derivatives is only significantly related to com-modity price exposure. Despite the fact that the majority of existing empirical literature relates to the implicit assumption that firms that do not use derivatives are not hedging, recent research also examines the association between exposure and proxies for firms’ on-the-balance hedging activities (CARTER; PAnTzALIS; SImkInS, 2003; HAgELIn; PRAmBORg, 2004).
Our paper intends to analyse whether firms use risk management instru-ments for hedging or for speculative purposes. We use monthly returns of 304 firms listed in Euronext during the period from 2006-2008. We pursue Jorion (1990) and Allayannis and Ofek (2001) two stages procedure to investigate, firstly, in the field of time series analysis, the relationship between firm value and exchange risk, interest rate risk and commodity price risk factors, all together; and afterwards, the effect of hedging activities and firms’ real opera-tions on financial price exposures estimated in the first stage. Our proxy of hedging activities is, similarly to Judge (2006), a dummy variable that points out to the use/non-use of hedging instruments by category of risk (which includes off-balance sheet and on-balance sheet instruments). Our primary assertion relies on the fact that hedging policies affect the firm’s exposure to changes in financial price factors; however, we do not discard the fact that the magnitude of a firm’s exposure to risks affects hedging decisions.
This paper adds to described areas of research by quantifying the impact of the use of derivative and non-derivative instruments on financial price expo-sures, making use of a broader sample of nonfinancial firms across all indus-tries. Besides, there are few published papers about hedging activities by means of data from Continental Europe, namely with data based on the International Accounting Standards 32 and 39 that require detailed reporting on derivatives, and none that we know use data on a sample formed by Euronext countries. Furthermore, we are motivated by the lack of empirical evidence concerning the interrelationship between financial price exposures and hedging, which we believe is scarcely investigated and limited to the US (CARTER; PAnTzALIS; SImkInS, 2003).
72
2
E M P I R I C A L E V I D E N C E O N F I N A N C I A L
P R I C E E X P O S U R E S O F N O N F I N A N C I A L
F I R M S
Financial risks for nonfinancial corporations consist – broadly defined – of unexpected changes in foreign exchange rates, interest rates and commodity pri-ces. In this sense, financial price exposure can be defined as the influence of financial price changes on the future cash flows of the firm. Since firm value is represented by the present value of future cash flows, financial price exposure is the sensitivity of firm value to financial price changes. Initial research in this area analyses stock returns to provide empirical measures of corporate exposure to financial risks. most of this research has been devoted to exchange rate expo-sure (JORIOn, 1990; WILLIAmSOn, 2001) and while some has tested for inte-rest rate exposure (BARTRAm, 2002), this has been largely for financial firms. Subsequent research investigates the effect of hedging in financial risk expo-sures, predominantly in foreign exchange exposure (HE; ng, 1998; ngUyEn; FAFF, 2003).
The focus of existing empirical exposure studies on foreign exchange rate risk has been justified with the argument that exchange rate risk represents a major source of risk, due to its higher volatility, when compared to other financial prices (JORIOn, 1990). nevertheless, a comparison of the standard deviations of various financial prices (exchange rate, interest rate and commodity price) reveals that in recent years interest rate and commodity price display even higher volatility than foreign exchange rate (BARTRAm, 2005). Therefore, the impact of interest rate and commodity price changes on firm value can be classified as an important issue for corporate risk management.
This section discusses the relationship between financial price risks and stock returns and explores the determinants of exposure, in reviewing the exis-ting empirical literature related to the present study and highlighexis-ting the main conclusions that have emerged.
2 . 1
F O R E I G N E X C H A N G E R AT E E X P O S U R E73
Ri,t = b0,i + b1,i � Rs,t + b2,i � Rm,t + εi,t (1)
where, Ri,tis the rate of return on the ith firm’s common stock in period t, R
s,tis the rate of change in a trade-weighted exchange rate and Rm,t is the rate of return on the Centre for Research in Security Prices (CRSP) value-weighted market index. b1,i represents a firm i’s exchange rate exposure; b2,ia firm i’s return sen-sitivity to market risk andεi,t denotes the white noise error term. Examining the monthly stock returns of 287 US multinationals in the period from 1971-1987, Jorion (1990) finds that only about 5.5% of the firms are significantly exposed to exchange rate risk.
In line with Jorion (1990), several other studies were carried out. For firms on the stock market in the US, researchers have applied various specifications of the Jorion’s framework to investigate the significance of exposure for particu-lar samples of industries or firms, including multinationals firms (AmIHUD, 1994; CHOI; PRASAD, 1995), nonfinancial firms (ALLAyAnnIS; OFEk, 2001), firms in the automotive industry (WILLIAmSOn, 2001) and broader samples of industries (BODnAR; gEnTRy, 1993).
Amihud (1994) finds no significant exchange rate exposure for a sample of 32 US exporters from 1982 to 1988. To some extent, Choi and Prasad (1995) provided strong evidence of significant exposure. They examined a sample of 409 multinational firms that have foreign sales, profits and assets of at least 25% of their respective totals. About 15% of the firms are significantly exposed. Furthermore, Bodnar and gentry (1993) show that roughly 30% of industries in the US, Japan and Canada have significant exposure to exchange rate move-ments. However, they find that the percentage of industries significantly expo-sed is smaller for the US than for Canada and Japan, which puts forward that industries in smaller and more open economies are likely to be more exposed to exchange rate risk. In the case of Williamson (2001), that analyses automotive industry in the US, significant exposure occurs only for certain firms.
74
coefficients. Also, nydahl (1999), analysing the exchange rate exposure of Swe-dish firms with a foreign sales ratio of at least 10%, finds that approximately 26% of the 47 firms in the sample are significantly exposed to exchange rate changes. On the other hand, khoo (1994), examining the foreign exchange rate exposu-re of mining companies in Australia, finds very weak evidence of such exposuexposu-re. He binds this lack of exposure to the extensive use of hedging by mining firms. Summing up, the empirical evidence on the impact of exchange rates on firm value in non-US markets is not conclusive either.
A controversy point in Jorion’s (1990) augmented market model concerns the definition of the exchange risk factor. The empirical literature often employs one of the following proxies: a trade weighted exchange rate or a bilateral cur-rency exchange rate. The aforementioned studies typically use a trade-weighted exchange rate index (BALI; HUmE; mARTELL, 2007; BODnAR; gEnTRy, 1993; JORIOn, 1990). Despite the view of Williamson (2001), among others, that points out lack of power to the tests using a trade weighted of currencies, when the firm is mostly exposed to only a few currencies, nydahl (1999), employing alternatively a trade weighted exchange rate index and a bilateral currency exchan-ge rate, concludes that there are not significant differences. In what respects sampling frequency, the use of monthly data is recurrent (ALLAyAnnIS; OFEk, 2001; BALI; HUmE; mARTELL, 2007; CHOI; PRASAD, 1995; JORIOn, 1990). Allayannis and Ofek (2001) justify this option by the fact that daily and weekly exchange rate indices frequently exhibited problems of misalignment between stock return and exchange rate series.
2 . 2
I N T E R E S T R AT E E X P O S U R EThe majority of interest rate exposure studies are restricted to financial firms which have mainly financial assets and, thus, are expected to exhibit different sensitivity with regard to changes in interest rates, when compared to nonfinan-cial firms. However, changes in interest rates are also important for nonfinannonfinan-cial firms. First, interest rate risk impacts on the value of nonfinancial firms through changes in cash flows generated by operations, which arise due to interest rate direct effect on the cost of capital. In addition, there may be indirect effects of interest rate risk on the competitive position of firms, impacting also on their expected cash flows. Finally, interest rate risk may influence firms’ value due to changes in the value of their financial assets and liabilities.
75
yields clearly affect to a much larger extent electric utilities industry than the nyse firms as a whole. Similarly, research on the interest rate sensitivity of nonfi-nancial firms outside the US is relatively sparse. Prasad and Rajan (1995), using a sample of four industrialized countries in the period from 1981-1989, group individual stock returns data into industry-based portfolios. Their results indi-cate that interest rate risk varies among countries and that there are industries with significant exposure to interest rate risk, specifically in Japan and germany. Confirming these results, Bartram (2002) also reports a significant rate exposu-re in german nonfinancial firms.
According to the existing evidence, most of the empirical studies on interest rate risk are based on a two-index model developed by Stone (1974), which inclu-des an interest rate change factor in addition to the traditional market index.
2 . 3
C O M M O D I T Y P R I C E E X P O S U R EThe effect of unexpected price movements of commodities on firm value is primarily determined by firms’ economic business activity. On the other hand, indirect effects result from the economic interdependence of companies in the economic value chain. In general, a relevance of a commodity as an input (output) factor should lead to a negative (positive) exposure. Despite the fact that changes of all production factors on the range of products have, potentially, a direct economic effect on the firms’ cost and/or revenue, only some inputs and outputs, namely commodities, are traded on the spot/or futures exchanges of international financial markets. nevertheless, the effectiveness of commodity risk management on commodity price exposure reduction seems unquestiona-ble; yet, very little attention to this matter has been attracted to date at the empi-rical literature level.
Exceptions are made to several empirical studies based on American gold mining industry (PETERSEn; THIAgARAnJAn, 2000; TUFAnO, 1998), gas and oil industry (JIn; JORIOn, 2006) and airline industry (CARTER; ROgERS; SImkInS, 2006). This is justified by the fact that companies in those industries turn out fairly homogeneous products, which imply relatively simple exposu-re structuexposu-res. On the other hand, being industries with strictly disclosing rules brings about the conception of high level databases on risk management prac-tices. These studies make use of the common approach assessed in the literatu-re – a two factor augmented market model, which includes a commodity price change factor.
sam-76
ple of 490 german nonfinancial firms, but limits his analysis to the sensitivity of firm value toward commodity price risk. He tests if commodity price risk that has not been hedged may negatively (positively) affect stock prices in industries for which a certain commodity represents an important input (output) factor in the production process. The author reports that the percentage of firms with sig-nificant exposures to commodity price risk is in the range of 4.5% - 15.9%. In the case of the study carried out by Bali, Hume and martell (2007), the focal point is the interaction between firms’ risk exposures, derivatives use and firms’ real operations. Evidence is found that commodity derivatives users have increasingly inherent risk exposure, which may suggest that hedging with derivatives is not always important to a firm’s return rate and may be linked to other nonfinancial and economic factors.
2 . 4
D E T E R M I N A N T S O F F I N A N C I A L P R I C E E X P O S U R E SWith respect to factors that influence exchange rate exposure, several authors, such as Jorion (1990), Bodnar and gentry (1993), Amihud (1994), Allayannis and Ofek (2001), Williamson (2001) and Bali, Hume and martell (2007) have found in their studies that a higher foreign involvement, proxied by ratio of for-eign sales to total sales, implies a stronger correlation between a depreciation (appreciation) of the dollar and an increase (decrease) in stock market values.
When the focus is the interest rate exposure, Bartram (2002) investigates two partial exposure determinants: financial leverage and firm liquidity and finds only a significant relation between the magnitude of interest rate exposure and firm liquidity. Instead, Bali, Hume and martell (2007) consider only finan-cial leverage as a proxy for firms’ real operations.
77
In the field of commodity price exposure, Tufano (1998) considers the hedging activities to be a potential determinant of exposure. Additionally, he tests several other potential determinants strictly related to the gold mining industry. Similarly, Jin and Jorion (2006) investigated the effect of hedging with deriva-tives and of gas and oil reserves on the commodity price exposure of a sample of US oil and gas firms. more recently, Bali, Hume and martell (2007) investigated the effect of derivatives use and of firms’ real operations, represented by the ratio of total inventory to total sales, on commodity price exposure.
Focusing on internal hedging strategies, Williamson (2001) shows that foreign production decreases exchange rate exposure, which is consistent with the idea that an exporter can counteract the sensitivity of the cash flow to exchange rate movements by having costs denominated in the local currency. Cor-roborating conclusions are drawn by Carter, Pantzalis and Simkins (2003) in an unpublished study. Other authors try to empirically link estimated exposure coefficients with data on foreign hedging activities. nydahl (1999), Allayannis and Ofek (2001) and also nguyen and Faff (2003) assess data on foreign exchange derivatives usage; Carter, Pantzalis and Simkins (2003), Hagelin and Pramborg (2004) and Bartram, Brown and minton (2010) consider data on both inter-nal and exterinter-nal hedging activities. Additiointer-nally, Carter, Pantzalis and Simkins (2003) account for the fact that the magnitude of a firm’s exposure to foreign exchange risk affects its hedging decisions. In other words, they recognize that foreign exchange rate exposure and hedging are endogenously determined.
Another set of studies is based on optimal hedging theories, which postulate that non hedging firms should be more exposed to currency movements than hedging companies (HE; ng, 1998; ngUyEn; FAFF, 2003). Particularly, He and ng (1998) use variables that proxy for firms’ incentives to hedge to examine the influence of presumed hedging activities.
3
S A M P L E D E S C R I P T I O N A N D
M E T H O D O L O G Y
3 . 1
S A M P L E D E S C R I P T I O N78
Simultaneous, we required that they have an annual report in English for the same year published on firms’ web site. We did not take into account multiple listings by the same firms, selecting the main market where different alterna-tives arise. This approach left us with 304 firms in our final sample.
Accounting data, with the exception of information on foreign firm sales, originates from the Infinancials database. Data on inside ownership where obtained from Bloomberg database and data on risk management instruments used and on foreign sales was manually collected from firms’ annual reports. In line with Judge (2006), we created a dichotomous variable by category of risk for the use/non-use of hedging instruments.
Following Allayannis and Ofek (2001), the data sets use a firm’s month-ly returns for the three years surrounding 2007 (2006-08). We use a trade-weighted exchange risk index – the Euro effective index1 – to proxy for the foreign
exchange risk factor. The proxy used to represent the interest rate risk factor is the three-month Euro Interbank Offered Rate (Euribor). Both the nominal effective exchange rate and the three-month Euribor data were obtained from the European Central Bank. To represent the commodity price risk factor we consider the Euronext Rogers International Commodity Index (Rici) provided by Uhlmann Price Securities2. The mSCI Euro index provided by morgan
Stan-ley Capital International Barra is used as proxy for equal-weighted returns mar-ket index3. Finally, we use gross national product per capita to measure country
financial development (LEL, 2009) which originates from the World Economic Outlook database (International Monetary Fund).
Firms are ranked into industries according to the Industry Classification Benchmark (ICB) classification codes in the Infinancials database. This proce-dure results in firms’ distribution by nine industries. The largest industry – Industrials – represents 27.6% of the sample, followed by Technology, which represents 18.1% of the sample. The country composition is as follow: Belgium firms represent 23.4% of the sample, French firms 26%, Dutch firms 38.1% and Portuguese firms 12.5%.
1 The trade weighted Euro effective exchange rate index covers 22 currencies. In order of weighting they
are great Britain, USA, Japan, Switzerland, Sweden, China, Hong kong, Taiwan, Denmark, South korea, Poland, Singapore, Czech Republic, Russia, Turkey, Hungary, malaysia, India, norway, Canada, Thailand and Brazil.
2 The Rici represents the value of a basket of commodities employed in the global economy, ranging from
agricultural and energy products to metals and minerals. The value of this commodity basket is tracked via futures contracts on 35 different exchange-traded physical commodities, quoted in four different curren-cies, listed on eleven exchanges in five countries.
3 The mSCI Euro index is a subset of the mSCI Pan-Euro index and includes the largest and most liquid
79
3 . 2
M E T H O D O L O G YWe use a two-step approach procedure to investigate the effect of a firm’s hedging activities and real operations on its exposure to financial risks. This study provides more complete estimates of firms’ financial risk by extending Jorion (1990) and Allayannis and Ofek (2001) exposure models for currency exchange risk, to also include interest rate and commodity price risk. The use of these three categories of risks is also investigated in Bali, Hume and martell (2007). In the first stage, we estimate the stock exposure of each firm in our 2007 data. In the second stage, we examine the relationship between financial price exposures already estimated, hedging activities and firms’ real operations.
3 . 2 . 1
Ti m e s e r i e s a n a l y s i s : m e a s u r i n g s t o c k p r i c e e x p o s u r eAs mentioned in the previous section, the current approach adopted in lite-rature to estimate a firm’s stock exposure to financial price risk is a two factor augmented market model. In line with Bali, Hume and martell (2007), in the first stage regression we provide estimates of individual firms’ exposure by cate-gory of risk using a four-factor augmented market model:
Ri,t = b0,i + b1,i � FXt + b2,i � ∆IRt + b3,i � CPt + b4,i � MSCIt + εi,t (2)
where Ri,t is the stock rate of return for firm i in month t4;
FXt is the rate of return on a moving trade-weighted average exchange rate index (in € per unit of foreign
currency) in period t;∆IRt is the monthly rate of change in the short-term interest rate factor in period t; CPt is the monthly rate of return on a commodity index in period t; MSCI,t is the monthly rate of return on the mSCI Euro index in period t; and εi,t is the noise error term. The coefficient b1,irepresents the exchange rate exposure, b2,irepresents the interest rate exposure,b3,irepresents the commodity price exposure and b4,ifirm i’s return sensitivity to market risk.
3 . 2 . 2
C r o s s s e c t i o n a l a n a l y s i s : d e t e r m i n a n t s o f f i n a n c i a l p r i c ee x p o s u r e
Previous studies (ALLAyAnnIS; OFEk, 2001; CARTER; PAnTzALIS; SIm-kInS, 2003; HAgELIn; PRAmBORg, 2004; HE; ng, 1998; nyDAHL, 1999) analyzed the efficiency of hedging activities by examining the determinants of
80
the financial price exposure in a cross sectional regression with the exposure coefficients estimated for each category of risk as the dependent variable.
Financial risk management and the level of exposure are possibly endogenous (CARTER; PAnTzALIS; SImkInS, 2003). Several authors argue that firms with more exposure have higher probabilities of become hedgers (BARTRAm; BROWn; FEHLE, 2009; LEL, 2009). In that sense, if financial exposures and hedging activities are interrelated, then financial exposures should be a function of hedging activities and of firms’ real operations (BALI; HUmE; mARTELL, 2007; BARTRAm, 2002). Similarly, hedging instruments usage should be a func-tion of the financial price exposures magnitude and of other factors also related with firms hedging decisions. In order to determine whether this is the case, the following system of equations for each category of risk is formulated:
1. For exchange rate exposure:
|b1,i| = a0 + a1 � DUM_FXi + a2 � FS/TSi + ηi (3)
DUM_FXi = δ0 + δ1 � |b1,i| + δ2 � TAXi + δ3 � LEVi + δ4 � CAPEXi + δ5,i � PEi +
δ6 � INSi + δ7 � ASSETi + δ8 � DIVi + δ9 � GDPi + ξi (4)
2. For interest rate exposure:
|b2,i| = a0 + a1 � DUM_IRi + a2 � LIQi + ηi (5)
DUM_IRi = δ0 + δ1 � |b2,i| + δ2 � TAXi + δ3 � LEVi + δ4 � CAPEXi + δ5,i � PEi +
δ6 � INSi + δ7 � ASSETi + δ8 � DIVi + δ9 � GDPi + ξi (6)
3. For commodity price exposure:
|b3,i| = a0 + a1 � DUM_CPi + a2 � TI/TSi + ηi (7)
DUM_CPi = δ0 + δ1 � |b3,i| + δ2 � TAXi + δ3 � LEVi + δ4 � CAPEXi + δ5,i � PEi +
δ6 � INSi + δ7 � ASSETi + δ8 � DIVi + δ9 � GDPi + ξi (8)
81
dummy which is assigned a value of 1 if a firm uses either external or internal foreign exchange hedging instruments, 0 otherwise; DUM_IR is adummy which is assigned a value of 1 if a firm uses either external or internal interest rate hedging instruments, 0 otherwise; DUM_CP dummy which is assigned a value of 1 if a firm uses either external or internal commodity hedging instruments, 0 otherwise; FS/TS is theratio of foreign sales to total sales as a proxy for firms’ real foreign operations; GDP is the natural logarithm of gross national product per capita; INS is the percentage of ordinary shares held by insiders; LEV is the financial leverage, measured by ratio of total debt to total assets; LIQ is the ratio of cash-flow to total assets as a proxy for the expected costs of financial distress; PE is the price earnings ratio; TAX is the net operating losses to total assets, and TI/TS are the revenues from commodity operations, measured by ratio of total inventory to total sales.
In our estimation of equations (3), (5) and (7) we test if a firms’ use of hedging instruments affects its exposure to the underlying risk factor. If firms use risk management instruments’ as a hedge against financial risk exposures, the absolute value of exposure should be negatively related to risk management instruments use. If, on the other hand, firms use risk management instruments, namely derivatives, to speculate, we should expect a positive relation between risk management instruments’ use and the absolute value of inherent financial price risks. Additionally, in equations (3), (5) and (7) we test if a firm’s real operations are important determinants of specific risk exposure. With respect to exchange rate exposure, is expected that net exporter firms exhibit a positive exchange rate exposure when euro appreciates. In contrast, if a firm is a net importer the appre-ciation of the euro should produce a negative exposure. On the other hand, for a given exposure, an increase in revenues from foreign operations should always increase exposure. However, when we take the absolute value of exchange rate exposure, we cannot hypothesize any relation between the absolute value of expo-sure and the ratio of foreign sales to sales (ALLAyAnnIS; OFEk, 2001). Simi-larly, we take the same approach for commodity price exposure, supported on the fact that commodity price exposures can be identified empirically in a particular industry either as an input factor or as an output factor in the production process (BARTRAm, 2005). In what concerns interest rate exposure, we hypothesize, similarly to Bartram (2002), that firms with high level of liquidity have less sig-nificant expected costs of financial distress. As a result, one can expect the interest rate exposure to be negatively related with firms’ liquidity.
82
tested is as follows: the greater the firm’s probability of incurrence in tax loss which will be carried forwards, the greater the probability of the firm’s engage-ment in hedging should be. The second variable is leverage (LEV), which is a proxy for the probability of financial distress (LEL, 2009). We expect firms with greater degree of financial distress to engage more often in hedging activities.
The theory predicts that hedging can enhance firms’ value if it can decrease the agency costs of debt. It was suggested that these agency costs of debt are more evident in firms with more growth options, as these firms could have a high probability of underinvestment or asset substitution. In line with Lin and Smith (2008), we use, to proxy for investment, the ratio of capital expenditures to total assets (CAPEX) and, to proxy for growth opportunities, the price to earnings ratio (PE). In testing managerial risk aversion prediction, we use the percentage of ordinary shares held by insiders (INS) (BARTRAm; BROWn; FEHLE, 2009; mARSDEn; PREvOST, 2005). It is suggested that managers have greater incen-tives to hedge when their wealth is more closely tied to their firms’ well-being.
To control for firm size we use as a proxy the natural logarithm of the total assets (ASSET). We need to control for firm size because the establishment and implementation of a hedging programme involve some fixed costs (nAnCE; SmITH; SmITHSOn, 1993). Larger firms that have access to risk management expertise, or that have economies of scale in hedging costs, are more likely to hedge than smaller firms. However, there are circumstances where smaller firms have more incentive to hedge than larger firms; for instance, smaller firms will hedge more, because they face greater bankruptcy costs. Similarly, we include gross national product per capita (GDP) to control for the availability of derivatives and their costs (LEL, 2009). Finally, we consider that the presence of liquid assets could also reduce the need for hedging with derivatives (mARSDEn; PREvOST, 2005; nAnCE; SmITH; SmITHSOn, 1993). We control for liquidity through divi-dend yield (DIV) and expect that firms with higher dividend payouts are less likely to hedge.
So, consistently with previous studies on optimal hedging theories δ1, δ2,
δ3, δ4, δ5, δ6 and δ9 in equations (4), (6) and (8) are expected to be positive. In contrast, δ8 is expected to be negative andδ7 could be either positive or negative. In a subsequent step, we investigate if an increase in hedging in one category of risk may reduce the exposure to risk in another category. For this test we substitute DUM_FX, DUM_IR and DUM_CP with DUM_ALL. DUM_ALL is assigned a value of 1 if a firm uses either external or internal hedging instru-ments; 0 in the otherwise situation.
83
4
R E S U LT S A N D D I S C U S S I O N
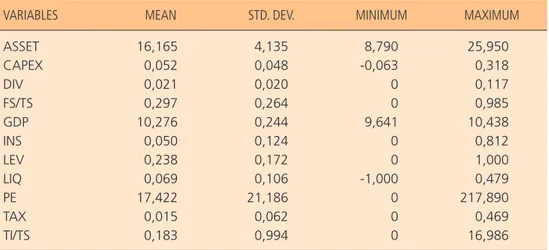
Table 1 shows some descriptive statistics of the above listed variables. In average, about 24% of firms’ total assets are financed by debt. The average value of the size variable is 16.165. This converts in about € 10.480 millions. The
ave-rage percentage of foreign sales is 29.7% and firms’ inventory represents, on average, 18.3% of total sales.
table 1
SAMPLE SUMMARY STATISTICS
VARIABLES MEAN STD. DEV. MINIMUM MAXIMUM
ASSET CAPEX DIV FS/TS GDP INS LEV LIQ PE TAX TI/TS 16,165 0,052 0,021 0,297 10,276 0,050 0,238 0,069 17,422 0,015 0,183 4,135 0,048 0,020 0,264 0,244 0,124 0,172 0,106 21,186 0,062 0,994 8,790 -0,063 0 0 9,641 0 0 -1,000 0 0 0 25,950 0,318 0,117 0,985 10,438 0,812 1,000 0,479 217,890 0,469 16,986
note: The statistics reported are obtained through gretl (version 1.9.1). ASSET = proxy for firm size, measured by the natural logarithm of total assets; CAPEX = proxy for firm investment, measured by the ratio of capital expenditures to total assets; DIv = dividend yield proxy for firm liquidity, measured by the gross dividend per share divided by the closing stock price; FS/TS = proxy for firms’ foreign real operations, measured by the ratio of foreign sales to total sales; gDP = proxy for the availability of derivatives in capital markets, measured by the natural logarithm of gross national product per capita; InS = proxy for the managerial risk aversion, measured by the percentage of ordinary shares held by insiders; LEv = financial leverage proxy for the probability of financial distress, measured by the ratio of total debt to total assets; LIQ = proxy for the expected costs of financial distress, measured by the ratio of cash-flow to total assets; PE = proxy for growth opportunities, measured by the price earnings ratio; TAX = proxy for the convexity of firm tax schedule, measured by net operating losses to total assets; TI/TS = proxy for the need to hedge commodity price, measured by the ratio of total inventory to total sales. All the accounting variables,
with the exception of foreign firms’ sales, originate from the Infinancials database. Data on firms’
foreign sales was manually collected from firms’ annual reports. Data on insider ownership
origi-nates from Bloomberg database and data on gDP originates from World Economic Outlook database
(International Monetary Fund).
84
In Table 2 we report the percentage of hedgers and non hedgers by cate-gory of risk instrument. As may be observed, the percentage of hedgers is gene-rally high, 78.6% for exchange rate hedgers and 61.2% for interest rate hedgers. Exception is made to commodity hedging instruments usage. Only 17.8% of the firms on the sample use commodity hedging instruments, which may be consis-tent with Bartram’s (2005) view that only few corporate cash flows are affected by commodity price changes.
table 2
SUMMARY STATISTICS OF HEDGING BY CATEGORY OF RISK INSTRUMENT
ALL CATEGORIES EXCHANGE RATE INTEREST RATE COMMODITY
OBS. % OF SAMPLE OBS. % OF SAMPLE OBS. % OF SAMPLE OBS. % OF SAMPLE
Hedgers 263 86.5% 239 78.6% 186 61.2% 54 17.8%
Non hedgers 41 13.5% 65 21.4% 118 38.8% 250 82.2%
note:This table reports the use of risk management instruments for the sample of 304 firms.
The second column provides data on the number of hedging and non hedging firms; the fourth, sixth and eighth columns report the number of hedgers and non hedgers by category of risk instrument.
Source: Elaborated by the authors.
4 . 1
T I M E S E R I E S A N A LY S I S : M E A S U R I N G S T O C K P R I C E E X P O S U R EBefore we investigate the firms’ financial price exposure, we investigate the series stationarity properties. The augmented Dickey-Fuller (ADF) test is applied to each time series to discard the existence of the unit root in the series analy-sed. The vast majority of our time series for returns on individual securities is integrated of order zero; 16.1% of the time series are integrated of order one and 1.6% are integrated of superior order. In what concerns the financial price expo-sure factors and the market index, they are all stationary on the levels.
85 table 3
SUMMARY STATISTICS ON FINANCIAL PRICE EXPOSURES
PANEL A. DESCRIPTIVE STATISTICS OF EXCHANGE RATE EXPOSURE COEFFICIENTS
ALL CASES BELGIUM FRANCE THE NETHERLANDS PORTUGAL
Mean Minimum Maximum Std. Dev.
Nº positive/negative cases % significant cases
-0.545 -42.386 8.413 3.204 112/192 28.3% -0.512 -7.149 6.012 2.315 28/43 26.8% -0.600 -4.359 4.351 1.727 37/79 33.6% -0.079 -7.340 6.258 2.232 35/44 26.6% -1.411 -42.386 8.413 7.272 12/26 18.4%
PANEL B. DESCRIPTIVE STATISTICS OF INTEREST RATE EXPOSURE COEFFICIENTS
ALL CASES BELGIUM FRANCE THE NETHERLANDS PORTUGAL
Mean Minimum Maximum Std. Dev.
Nº positive/negative cases % significant cases
-0.186 -5.467 1.066 0.546 108/196 34.9% -0.243 -1.704 1.025 0.559 25/46 31.0% -0.183 -2.411 1.066 0.503 43/73 35.3% -0.035 -0.506 1.042 0.185 33/46 41.8% -0.401 -5.467 0.560 0.943 7/31 26.3%
PANEL C. DESCRIPTIVE STATISTICS OF COMMODITY PRICE EXPOSURE COEFFICIENTS
ALL CASES BELGIUM FRANCE THE NETHERLANDS PORTUGAL
Mean Minimum Maximum Std. Dev.
Nº positive/negative cases % significant cases
-0.044 -1.860 1.395 0.385 164/140 22.4% 0.040 -0.677 1.395 0.333 38/33 21.1% 0.092 -0.745 1.335 0.331 67/49 22.4% 0.100 -0.990 0.968 0.362 47/32 25.3% -0.208 -1.860 0.793 0.554 12/26 18.4%
note:This table reports descriptive statistics of bix – the exchange rate exposure (Panel A), the
interest rate exposure (Panel B) and the commodity price exposure (Panel C) – estimated from the equation (2) for the period from January 31, 2006 until December 31, 2008. The percentage of significant cases is achieved at 10% or lower levels of significance.
Source: Elaborated by the authors.
86
highest significance, with a percentage of 34.9%. Additionally, with regard to the other exposure factors, firms exhibit higher percentages of significant cases when compared with previous empirical studies5.
4 . 2
C R O S S S E C T I O N A L A N A LY S I S : D E T E R M I N A N T S O F F I N A N C I A L P R I C E E X P O S U R EIn a first stage, we estimate the model with the continuous variable (finan-cial price exposure) as a dependent variable in the usual fashion, using OLS, while the model for the binary choice variable (hedging activities) is estimated via Probit. However, DUM_CP Probit model does not achieve mL convergence, that’s why, specifically for this case, we use OLS estimation. Besides, when we perform the normality tests the results highlights that the model disturbance are not jointly normally distributed and this is probably the reason why the mL esti-mator process do not converge. Similar OLS and Probit regressions have been standard in the literature, but they ignore the possible interrelation between financial price exposures and hedging activities. So, in a second stage, this inter-relationship is tested with a system of simultaneous equations, by applying the SUR procedure on the equations (3) - (8) described above. This procedure treats financial price exposure and hedging as endogenous variables. The main reason for using OLS and Probit analysis in the first stage is that the results that are obtained by it are useful for assessing the extent to which the results obtained by using SUR are influenced by the use of the technique. We present the summary of the OLS/Probit and SUR results in Table 4 and Table 5.
• First stage: unlike prior studies, the results of the OLS regression indicate that currency hedging activities and the degree of firms operations do not have a statistically significant influence on the magnitude of exchange rate exposure. moreover, we investigate the fact that an increase in hedging in one category of risk may reduce the exposure to risk in another category; specifically, we substi-tute the variable that represents currency hedging by the variable that proxy for the hedging instruments inherent to all categories of risk (DUM_ALL). This new specification exhibits, as expected, a significant negative effect of hedging on exchange risk exposure. In both hedging specifications, Probit analysis do not display any significant impact of exposure on hedging.
5 Jorion (1990) shows that only 5% of his sample exhibits significant exchange rate exposure. Choi and
87 table 4
SUR AND OLS/PROBIT REGRESSION RESULTS WHEN HEDGING VARIABLE IS ASSIGNED BY CATEGORY OF RISK
INDEPENDENT VARIABLES
DEPENDENT VARIABLES IN THE OLS/PROBIT REGRESSION DEPENDENT VARIABLES IN THE SUR REGRESSION
PREDICTED INFLUENCE |b1|a DUM_FXb |b2|a DUM_IRb |b3|a DUM_CPa |b1| DUM_FX |b2| DUM_IR |b3| DUM_CP
Const 2.272 (6.64)* -13.777 (-3.61)* 2.707 (7.97)* -3.941 (-3.73)*
|b1|
-0.014 (-0.43)* -0.018 (-2.19)* + FS/TS -0.083 (-0.12) 0.036 (0.06) na DUM_FX -0.634 (-1.49) -1.208 (-2.85)* -Const 0.343 (7.50)* -17.636 (-4.20)* 0.350 (7.67)* -3.750 (-3.37)*
|b2|
0.073 (0.38) 0.011 (0.23) + LIQ -0.081 (-0.31) -0.076 (-0.29) -DUM_IR -0.016 (-0.29) -0.027 (-0.48) -Const 0.267 (15.81)* -0.789 (0.75) 0.260 (15.13)* -0.816 (-0.79)
|b3|
0.192 (2.27)*
0.341 (4.13)* +
TI/TS -0.010
(-0.68) -0.010 (-0.63) na DUM_CP 0.078 (1.95)* 0.151 (3.82)* -CONTROL VARIABLES: ASSET 0.062 (2.61)* 0.154 (6.06)* 0.008 (1.44) 0.015 (2.67)* 0.038 (6.70)* 0.008 (1.43) na CAPEX 0.919 (0.52) 2.481 (1.31) -0.424 (-0.92) 0.290 (0.63) 0.623 (1.30) -0.416 (-0.92) + DIV -10.229 (-2.34)* 4.006 (0.95) 1.315 (1.14) -2.805 (-2.46)* 1.187 (0.99) 1.283 (1.14) -GDP 1.364 (3.67)* 1.405 (3.52)* 0.077 (0.75) 0.449 (4.39)* 0.337 (3.13)* 0.075 (0.75) + INS -1.455 (-2.31)* -2.964 (-3.71)* -0.017 (-0.09) -0.389 (-2.21)* -0.736 (-3.97)* -0.016 (-0.09) +
88
INDEPENDENT VARIABLES
DEPENDENT VARIABLES IN THE OLS/PROBIT REGRESSION DEPENDENT VARIABLES IN THE SUR REGRESSION
PREDICTED INFLUENCE |b1|a DUM_FXb |b2|a DUM_IRb |b3|a DUM_CPa |b1| DUM_FX |b2| DUM_IR |b3| DUM_CP
LEV 0.100
(0.19)
4.446 (6.87)*
0.071 (0.50)
0.024 (0.17)
1.101 (7.43)*
0.071
(0.51) +
PE -0.006
(-1.43)
0.001 (0.30)
-9.3e-03
(-0.87)
-0.002 (-1.61)
-1.6e-03
(-0.14)
-9.1e-03
(-0.87) +
TAX -0.742
(-0.51)
-4.591 (-1.70)*
-0.620 (-1.58)
-0.208 (-0.54)
-0.886 (-2.17)*
-0.600 (-1.57) +
R2 0.010 0.134 0.001 0.325 0.014 0.048 --- ---
---a Estimation performed using OLS.
b Estimation performed using Probit.
* Indicates values that the coefficients are significant at 10% or lower levels.
note: The statistics reported are obtained through gretl (version 1.9.1). In the predicted influence
column – na – means that there is no prediction. t-values are in parentheses. |b1|, |b2| and |b3|
rep-resent the magnitude of exchange rate exposure, the magnitude of interest rate exposure and the magnitude of commodity price exposure, respectively; ASSET = proxy for firm size, measured by the natural logarithm of total assets; CAPEX = proxy for firm investment, measured by the ratio of capital expenditures to total assets; DIv = dividend yield proxy for firm liquidity, measured by the
gross dividend per share divided by the closing stock price; DUM_FX, DUM_IR and DUM_CP are
dummies which are assigned a value of 1 if a firm uses either external or internal foreign exchange hedging instruments, interest rate hedging instruments and commodity hedging instruments, respectively; FS/TS = proxy for firm foreign real operations, measured by the ratio of foreign sales to total sales; gDP = proxy for the availability of derivatives in capital markets, measured by the natural logarithm of gross national product per capita; InS = proxy for the managerial risk aver-sion, measured by the percentage of ordinary shares held by insiders; LEv = financial leverage proxy for the probability of financial distress, measured by the ratio of total debt to total assets; LIQ = proxy for the expected costs of financial distress, measured by the ratio of cash-flow to total assets; PE = proxy for growth opportunities, measured by the price earnings ratio; TAX = proxy for the convexity of firm tax schedule, measured by net operating losses to total assets; TI/TS = proxy for the need to hedge commodity price, measured by the ratio of total inventory to total sales.
All accounting variables, with the exception of foreign firm sales, originate from the Infinancials
database. Data on firm foreign sales and on hedging activities was manually collected from firm’s
annual reports. Data on inside ownership was collected from Bloomberg database and data on gDP
originates from World Economic Outlook database (International Monetary Fund).
Source: Elaborated by the authors.
table 4 (conclusion)
89 table 5
SUR AND OLS/PROBIT REGRESSION RESULTS WHEN HEDGING VARIABLE REPRESENTS ALL HEDGING INSTRUMENTS
INDEPENDENT VARIABLES
DEPENDENT VARIABLES IN THE OLS/PROBIT REGRESSION DEPENDENT VARIABLES IN THE SUR REGRESSION
PREDICTED INFLUENCE |b1|a DUM_ALLb |b
2|a DUM_ALLb |b3|a DUM_ALLa |b1| DUM_ALL |b2| DUM_ALL |b3| DUM_ALL
Const 2.680 (6.28)* -15.898 (-3.66)* 3.460 (8.20)* -2.978 (-3.40)*
|b1| -0.021
(-0.56) -0.022 (-3.28)* + FS/TS -0.018 (-0.03) 0.043 (0.07) na DUM_ALL -1.073 (-2.19)* -1.995 (-4.12)* -Const 0.389 (5.11)* -16.555 (-3.79)* 0.433 (5.73)* -3.283 (-3.69)*
|b2|
0.042 (0.22) -0.022 (-0.56) + LIQ -0.089 (-0.34) -0.078 (-0.30) -DUM_ALL -0.063 (-0.79) -0.116 (-1.46) -Const 0.329 (7.89)* -16.121 (-3.74)* 0.368 (8.90)* -3.181 (-3.62)*
|b3|
-0.180 (-0.51)
-0.105 (-1.50) +
TI/TS -0.010
(-0.68) -0.010 (-0.69) na DUM_ALL -0.053 (-1.18) -0.098 (-2.21)* -CONTROL VARIABLES: ASSET 0.099 (3.25)* 0.101 (3.28)* 0.100 (3.27)* 0.014 (3.12)* 0.015 (3.29)* 0.015 (3.23)* na CAPEX 2.402 (1.15) 2.523 (1.21) 2.570 (1.23) 0.487 (1.28) 0.524 (1.37) 0.529 (1.38) + DIV -3.856 (-0.84) -3.953 (-0.87) -3.978 (-0.87) -0.816 (-0.86) -0.843 (-0.88) -0.866 (-0.91) -GDP 1.500 (3.59)* 1.557 (3.71)* 1.520 (3.66)* 0.354 (4.17)* 0.379 (4.39)* 0.371 (4.37)* + INS -1.507 (-2.16)* -1.497 (-2.15)* -1.486 (-2.14)* -0.295 (-2.01)* -0.304 (-2.06)* -0.298 (-2.01)* +
90
INDEPENDENT VARIABLES
DEPENDENT VARIABLES IN THE OLS/PROBIT REGRESSION DEPENDENT VARIABLES IN THE SUR REGRESSION
PREDICTED INFLUENCE |b1|a DUM_ALLb |b
2|a DUM_ALLb |b3|a DUM_ALLa |b1| DUM_ALL |b2| DUM_ALL |b3| DUM_ALL
LEV 1,374 (1,90)* 1,441 (2,09)* 1,484 (2,12)* 0,201 (1,71)* 0,219 (1,86)* 0,223 (1,88)* + PE -0,004 (-0,85) -0,004 (-0,90) -0,004 (-0,91) -0,001 (-1,47) -0,001 (-1,57) -0,001 (-1,58) + TAX -0,573 (-0,39) -0,537 (-0,36) -0,507 (-0,34) -0,227 (-0,70) -0,220 (-0,68) -0,221 (-0,68) +
R2 0,018 0,180 0,002 0,178 0,006 0,179 --- ---
---a Estimation performed using OLS.
b Estimation performed using Probit.
* Indicates values that the coefficients are significant at 10% or lower levels.
note: The statistics reported are obtained through gretl (version 1.9.1). In the predicted influence
column – na – means that there is no prediction. t-values are in parentheses. |b1|, |b2| and |b3|
represent the magnitude of exchange rate exposure, the magnitude of interest rate exposure and the magnitude of commodity price exposure, respectively; ASSET = proxy for firm size, measured by the natural logarithm of total assets; CAPEX = proxy for firm investment, measured by the ratio of capital expenditures to total assets; DIv = dividend yield proxy for firm liquidity, measured by
the gross dividend per share divided by the closing stock price; DUM_ALL is a dummy which is
assigned a value of 1 if a firm uses external and/or internal hedging instruments; FS/TS = proxy for firm foreign real operations, measured by the ratio of foreign sales to total sales; gDP = proxy for the availability of derivatives in capital markets, measured by the natural logarithm of gross national product per capita; InS = proxy for the managerial risk aversion, measured by the percentage of ordinary shares held by insiders; LEv = financial leverage proxy for the probability of financial distress, measured by the ratio of total debt to total assets; LIQ = proxy for the expected costs of financial distress, measured by the ratio of cash-flow to total assets; PE = proxy for growth oppor-tunities, measured by the price earnings ratio; TAX = proxy for the convexity of firm tax schedule, measured by net operating losses to total assets; TI/TS = proxy for the need to hedge commodity price, measured by the ratio of total inventory to total sales. All accounting variables, with the
exception of foreign firm sales, originate from the Infinancials database. Data on firm foreign sales
and on hedging activities was manually collected from firm’s annual reports. Data on inside
owner-ship was collected from Bloomberg database and data on gDP originates from World Economic
Outlook database (International Monetary Fund).
Source: Elaborated by the authors.
Within the scope of interest rate exposure the OLS and Probit analysis do not establish any significant link between exposure and hedging. Lastly, in what concerns the commodity price exposure, OLS results indicate that commodity hedging activities significantly impact absolute exposure, but in sign opposite
table 5 (conclusion)
91
from what is expected. This result indicates that firms’ commodity hedging activities could be driven by reasons others than the management of existing exposures. In what concerns Probit analysis, the magnitude of commodity price exposure, as expected, is positively associated with commodity hedging activities. However, when we consider the use of the DUM_ALL specification, we do not find any significant influence, neither in the scope of interest rate exposure, nor in the commodity price exposure.
In examining the control variables on the equations (4), (6) and (8), we verify that there exists variation for the determinants of each type of hedging instru-ments. The Probit results indicate that size (ASSET) and gross national product per capita (GDP) have a positive and dividend yield (DIV) a negative influence on currency hedging instruments usage. These results are largely consistent with expectations: larger firms that have access to risk management expertise, or that have economies of scale in hedging costs, are more likely to hedge; firms established in countries with more liquid financial markets are more likely to hedge; and, firms with higher dividend yield are less likely to be financially constrained, so hedge less. Also, as expected, the Probit results indicate that size (ASSET), gross national product per capita (GDP) and financial leverage (LEV) have a significant positive effect on interest rate hedging activities. Leverage variable results suggest that firms with greater degree of financial distress engage more often in hedging activities.
92
When we test if the increase in hedging in one category of risk reduce the exposure to risk in another category (DUM_ALL specification), we achieve more consistent results for all the categories of financial risk exposures. Once more, we verify that larger firms, higher levered firms and firms that operate in more liquid financial markets are more prone to hedge. Finally, even though insider ownership negatively influences the probability of hedging, this is in line with the management entrenchment theory.
• Second stage: taking into account a possible interrelation among financial risk exposures and hedging, we estimate the equations (3), (5) and (7) along with equations (4), (6) and (8) respectively, corresponding each pair of equations to an identified category of risk, by applying a simultaneous equations system using SUR procedure. The results of the SUR regression indicate, as expected, that currency hedging instruments’ usage have a negative influence in inherent expo-sure (ALLAyAnnIS; OFEk, 2001). Contrasting with Jorion (1990) conclusions, our results do not corroborate the predicted influence of foreign firms opera-tions on the magnitude of exchange rate exposure. Surprising is the statistically evidence that the magnitude of exchange rate exposure negatively influences hedging with currency hedging instruments. This result indicates that firms’ risk management activities could be driven by reasons others than the manage-ment of existing exposures; eventually derivatives are used for speculative pur-poses. As for the DUM_ALL specification, the results of SUR regression are equivalent. Summing up, our results corroborate the existence of a significant interaction between the magnitude of the exposure and hedging activities in the extent of exchange rate risk.
Within the scope of the interest rate exposure, the SUR results indicate that an interrelation between the magnitude of interest rate exposure and interest rate hedging activities does not exist. In addition, there is no significant effect of liquidity on interest rate exposure.
Again, our SUR results show that commodity hedging activities has, con-trary to the expectations, a statistically positive effect on commodity price expo-sure. Also, we find evidence that the magnitude of commodity exposure posi-tively impact on the inherent hedging activities, which suggests that commodity hedging activities is endogenously related to its commodity price exposure. When DUM_ALL specification is taken into account, we find, in line with Tufano (1998) and Petersen and Thiagarajan (2000), that hedging activities have a significant negative effect on commodity price exposure. However, the positive effect of exposure on hedging activities disappears.
93
5
C O N C L U S I O N S A N D F U RT H E R
D I R E C T I O N S
This paper presents a comprehensive investigation of the financial risk exposures of European nonfinancial firms, based on the analysis of 304 firms during the period from 2006-2008. We built on previous studies that have been used multifactor market models to access the level of financial risk exposures, all together. In addition, taking into consideration the influence of both inter-nal and exterinter-nal hedging instruments, we extend the recent investigation on the determinants of such exposures, recognizing that financial risk exposure and hedging are endogenous.
We document that our sample firms exhibit higher percentages of exposure to the three categories of risk analysed, when compared with previous empirical studies. In addition, we find evidence that hedging activities are an important determinant of firm’s exchange rate and commodity price exposures, explicitly when we consider the interdependence between the three categories of risk and the hypothesis of simultaneous determination of exposure and hedging activi-ties. In fact, we find several reliable results when we consider that the increase in hedging in one category of risk reduces the exposure to risk in another category. As for the association between firm’s real operations and inherent exposures, we do not find any empirical evidence on the matter. Our results are also consis-tent with the assertion that exposure and hedging activities are simultaneously determined, but restricted to exchange rate exposure and commodity exposure analysis.
Finally, we consistently verify that 1. larger firms have a stronger tendency to hedge, which supports the economies-of-scale-in-hedging argument; 2. higher levered firms are more likely to hedge, which indicates that firm’s hedge to redu-ce the probability of financial distress; 3. firms acting in more liquid financial markets are more likely to hedge; and, 4. firms with high insider ownership are less likely to hedge, which is consistent with the management entrenchment hypothesis.
94
A EXPOSIÇÃO AO RISCO FINANCEIRO E A GESTÃO
DO RISCO: O CASO DAS EMPRESAS EUROPEIAS NÃO
FINANCEIRAS
R E S U M O
Estudos recentes têm procurado demonstrar que as empresas que utilizam ins-trumentos derivados com a finalidade de cobrir o risco apresentam valores de mercado superiores. Implícita nessa questão está a suposição de que as empresas utilizam os instrumentos derivados exclusivamente com o propósito de gerir a sua exposição ao risco. no âmbito das empresas não financeiras, verifica-se a exis-tência de vasta literatura que analisa as alterações do valor da empresa impulsio-nadas por alterações nos preços dos ativos financeiros. É consensual que a exposi-ção aos riscos financeiros emerge por via das atividades operacionais da empresa e que pode ser reduzida mediante a implementação de estratégias de gestão do risco financeiro. Assim, consideraram-se as rendibilidades mensais de 304 empresas europeias cotadas na Euronext no período de 2006-2008, de forma a analisar se as práticas de gestão do risco estão associadas a menores níveis de risco. Adotou-se a metodologia em dois estágios proposta por Jorion (1990) e Allayannis e Ofek (2001), de forma a investigar, primeiro, a relação existente entre o valor da empresa e a exposição aos riscos financeiros, e, posteriormente, o impacto das atividades operacionais da empresa e da utilização de instrumentos de cobertura de risco no nível de exposição ao risco. no entanto, não se desconsi-dera a hipótese de que a magnitude da exposição possa afetar a decisão de imple-mentar estratégias de cobertura de risco. Essa hipótese de simultaneidade entre a exposição ao risco e a decisão de implementar estratégias de cobertura de risco é investigada por meio da metodologia Seemingly Unrelated Regression (SUR). Entre as principais conclusões, destacamos: 1. existe evidência de que as empresas da amostra exibem níveis de exposição ao risco superiores, quando comparadas com resultados de estudos anteriores; 2. a gestão do risco influencia, de fato, o nível de exposição ao risco financeiro. Finalmente, os resultados confirmam a existência de simultaneidade entre o nível de exposição ao risco e a decisão de empreender actividades de gestão do risco, mas apenas no que respeita à exposição ao risco de taxa de câmbio e ao risco de variação de preço das mercadorias.
PA L AV R A S - C H AV E
95
LA EXPOSICIÓN AL RIESGO FINANCIERO Y LA
GESTIÓN DE RIESGOS: EL CASO DE LAS EMPRESAS
EUROPEAS NO FINANCIERAS
R E S U M E N
Estudios recientes sobre la gestión de riesgos han intentado demostrar que las empresas que promueven el uso de derivados como mecanismo de cobertura de riesgos tienen mayores valores de mercado. Implícita es la suposición de que las empresas utilizan los derivados solamente con el propósito de gestionar su exposición al riesgo. Alguna literatura concerniente a las empresas no financieras sugieren que las fluctuaciones en los precios de los activos financieros afectan el valor de la empresa. Además, es consensual que la exposición a los riesgos finan-cieros erige de las actividades operacionales de la empresa y que se puede reducir mediante la aplicación de estrategias de gestión del riesgo financiero. Tenemos en cuenta los resultados mensuales de 304 empresas europeas cotizadas en el mer-cado Euronext en el período 2006-2008, para examinar si las prácticas de gestión de riesgos están asociadas con menores niveles de riesgo. Utilizamos la metodo-logía en dos etapas propuesta por Jorion (1990) y Allayannis y Ofek (2001), para investigar, en primer lugar, la relación entre el valor y la exposición a los riesgos financieros y, en última instancia, el impacto de las actividades operativas de la empresa y de lo uso de instrumentos de cobertura en el nivel de la exposición. no obstante, consideramos la hipótesis de que la magnitud de la exposición puede afectar también la decisión de implementar estrategias de cobertura de riesgos. Esta hipótesis de simultaneidad entre la exposición al riesgo y la decisión de imple-mentar estrategias de cobertura es investigada por el método Seemingly Unrelated Regression (SUR). En los resultados destacamos: en primer lugar, evidencia de que las empresas de la muestra revelan porcentajes más altos de exposición al riesgo en comparación con estudios empíricos anteriores; observamos, también, que la gestión de riesgos está significativamente asociada con la exposición al los riesgos financieros. Por último, los resultados confirman la existencia de simultaneidad entre el nivel de exposición al riesgo y la decisión de implementar estrategias de cobertura de riesgos, pero sólo en relación a la exposición al riesgo de cambio y al riesgo de fluctuación de los precios de las mercadorías.
PA L A B R A S C L AV E
96
R E F E R E N C E S
ADLER, m.; DUmAS, B. Exposure to currency risk: definition and measurement. Financial
Management,v. 13, n. 2, p. 41-50, Summer 1984.
ALLAyAnnIS, g.; OFEk, E. Exchange rate exposure, hedging, and the use of foreign currency
derivatives. Journal of International Money and Finance, v. 20, n. 2, p. 273-296, Apr. 2001.
AmIHUD, y. Exchange rates and the valuation of equity shares. In: AmIHUD, y.; LEvICH, R. m.
Exchange rates and corporate performance. new york: Irwin, 1994. p. 49-59.
BALI, T. g.; HUmE, S. R.; mARTELL, T. F. A new look at hedging with derivatives: will firms
reduce market risk exposure? The Journal of Futures Markets,v. 27, n. 11, p. 1053-1083, nov. 2007.
BARTRAm, S. m. The interest rate exposure of nonfinancial corporations. European Finance
Review,v. 6, n. 1, p. 101-125, Jan. 2002.
______. The impact of commodity price risk on firm value: an empirical analysis of corporate
com-modity price exposures. Multinational Finance Journal, v. 9, n. 3/4, p. 161-187, Sept./Dec. 2005.
BARTRAm, S. m.; BROWn, g. W.; FEHLE, F. International evidence on financial derivatives
usage. Financial Management, v. 38, n. 1, p. 185-206, Spring 2009.
BARTRAm, S. m.; BROWn, g. W.; mInTOn, B. A. Resolving the exposure puzzle: the many facets
of exchange rate exposure. Journal of Financial Economics, v. 95, n. 2, p. 148-173, Feb. 2010.
BODnAR, g. m.; gEnTRy, W. m. Exchange rate exposure and industry characteristics: evidence
from Canada, Japan and the USA. Journal of International Money and Finance, v. 12, n. 1, p. 29-45,
Feb. 1993.
CARTER, D. A.; PAnTzALIS, C.; SImkInS, B. Asymmetric exposure to foreign exchange risk:
finan-cial and real option hedges implemented by US multinational corporations. Social Sciences Research
Network Working Paper, n. 387082, Feb. 2003. Available in: <http://ssrn.com/abstract=387082>. Retrieved: march 30, 2010.
CARTER, D. A.; ROgERS, D. A.; SImkInS, B. J. Does hedging affect firm value? Evidence from
the US airline industry. Financial Management, v. 35, n. 1, p. 53-86, Spring 2006.
CHOI, J. J.; PRASAD, A. m. Exchange risk sensitivity and its determinants: a firm and industry
analysis of US multinationals. Financial Management, v. 24, n. 3, p. 77-88, Fall 1995.
FOk, R.; CARROLL, C.; CHIOU, m. Determinants of corporate hedging and derivatives: a revisit.
Journal of Economics and Business, v. 49, n. 6, p. 569-585, nov./Dec. 1997.
gRAHAm, J. R.; SmITH, C. W. Tax incentives to hedge. Journal of Finance, v. 54, n. 6, p.
2241-2262, Dec. 1999.
gUAy, W.; kOTHARI, S. P. How much do firms hedge with derivatives? Journal of Financial
Eco-nomics, v. 70, n. 3, p. 423-461, Dec. 2003.
HAgELIn, n.; PRAmBORg, B. Hedging foreign exchange exposure: risk reduction from
transac-tion and translatransac-tion hedging. Journal of International Financial Management and Accounting, v.15,
n. 1, p. 1-20, mar. 2004.
HE, J.; ng, L. k. The foreign exchange exposure of Japanese multinational corporations. Journal of
Finance, v. 53, n. 2, p. 733-753, Apr. 1998.
JIn, y.; JORIOn, P. Firm value and hedging: evidence from U.S. oil and gas producers. The Journal
97
JORIOn, P. The exchange rate exposure of US multinationals. Journal of Business, v. 63, n. 3,
p. 331-345, July 1990.
JUDgE, A. Why and how Uk firms hedge? European Financial Management, v. 12, n. 3, p. 407-441,
June 2006.
kHOO, A. Estimation of foreign exchange exposure: an application to mining companies in
Aus-tralia. Journal of International Money and Finance, v. 13, n. 3, p. 342-363, June 1994.
LEL, U. Currency hedging and corporate governance: a cross-country analysis. International Financial
Discussion Paper from the Board of governors of the Federal Reserve System, n. 858, 51 p. Dispo-nível em: <http://ssrn.com/abstact=391883ordoi:10.2139/ssrn.391883>. Acesso em: 15 dez. 2009. LIn, C. m.; SmITH, S. D. Hedging, financing and investment decisions: theory and empirical
tests. Journal of Banking & Finance, v. 32, n. 10, p. 1566-1582, Aug. 2008.
mARSDEn, A.; PREvOST, A. Derivatives use, corporate governance, and legislative change: an
empirical analysis of new zealand listed companies. Journal of Business Finance and Accounting,
v. 32, n. 1, p. 255-295, Jan./mar.2005.
mORCk, R.; SHLEIFER, A.; vISHny, R. W. management ownership and market valuation.
Jour-nal of Financial Economics, v. 20, n. 1/2, p. 293-315, Jan./mar. 1988.
nAnCE, D. R.; SmITH, C. W.; SmITHSOn, C. W. On the determinants of corporate hedging.
Journal of Finance, v. 48, n. 1, p. 267-284, mar. 1993.
ngUyEn, H.; FAFF, R. Can the use of foreign currency derivatives explain variations in foreign
exchange exposure? Evidence from Australian companies. Journal of Multinational Finance
Manage-ment, v. 13, n. 3, p. 193-215, July 2003.
nyDAHL, S. Exchange rate exposure, foreign involvement and currency hedging of firms: some
Swedish evidence. European Financial Management, v. 5, n. 2, p. 241-257, July 1999.
PETERSEn, m. A.; THIAgARAJAn, S. R. Risk measurement and hedging. Financial
Manage-ment, v. 29, n. 4, p. 5-30, Winter 2000.
PRASAD, A. m.; RAJAn, m. The role of exchange and interest risk in equity valuation: a
compara-tive study of international stock markets. Journal of Economics and Business, v. 47, n. 5, p. 457-472,
Dec. 1995.
STOnE, B. k. Systematic interest rate risk in a two-index model of returns. Journal of Financial and
Quantitative Analysis, v. 9, n. 5, p. 709-721, June 1974.
SWEEnEy, R. J.; WARgA, A. D. The pricing on interest rate risk: evidence from the stock market.
Journal of Finance, v. 41, n. 2, p. 393-410, June 1986.
TUFAnO, P. The determinants of stock price exposure: financial engineering and the gold mining
industry. Journal of Finance, v. 53, n. 3, p. 1015-1052, June 1998.
WILLIAmSOn, R. Exchange rate exposure and competition: evidence from the automotive industry.