ISSN 0104-530X (Print) ISSN 1806-9649 (Online)
Resumo: O nível crítico das águas dos reservatórios e das hidrelétricas brasileiras representa o rompimento da 1ª condição da sustentabilidade. A soma do volume de afluência menos a soma do volume de defluência, resulta em 6.418 m3 de água por segundo desfavorável, ao sistema nacional. Neste estudo, apresentamos uma metodologia de contabilidade ambiental que mensura o uso de recursos por unidade comum de eMergia solar, com objetivo de avaliar a interação de variáveis de sustentabilidade ambiental nas empresas de abastecimento de água e saneamento listadas na BM&FBOVESPA em 2014. A mensuração foi realizada mediante definição das fronteiras do sistema de cada empresa com as fontes de energia e materiais que a alimentam. Um diagrama de energia do sistema foi construído e resumido em um diagrama agregado dos fluxos de energia. A partir do inventário das entradas de energia e materiais das empresas no exercício de 2013, foram inventariados os recursos R, N e F, em unidades, transformidades e eMergia/unidade. Foi verificado se os consumidores estão pagando, em seJ/J ou seJ/R$, os recursos recebidos dos ecossistemas naturais quando compram produtos e serviços pagos em dinheiro. O cálculo dos indicadores da contabilidade em eMergia (EYR, ELR e SI) e o diagrama ternário em eMergia e suas linhas de sustentabilidade indicaram posições das empresas em relação aos indicadores de sustentabilidade ambiental. Os investidores na BM&FBOVESPA reconhecem e percebem valor positivo das empresas rotuladas como sustentáveis ambientalmente. No período de 2006 a 2015 o ISE obteve uma performance de +131% em relação ao Ibovespa. Os clientes das empresas CASAN, COPASA, SABESP e SANEPAR pagaram nas tarifas de água e tratamento de esgotos, em R$ médios, 72,5% da eMergia total recebida. Há uma relação de desvantagem entre a biosfera e o sistema de tratamento de água e esgotamento sanitário operado pelas empresas avaliadas.
Palavras-chave: Sustentabilidade ambiental; Empresas de abastecimento de água; BM&FBOVESPA; eMergia. Abstract: The critical level of the water reservoirs of the Brazilian hydroelectric power plants represents a breach of the first condition of sustainability. The algebraic sum of the volumes of affluence and diffluence shows an unfavorable result of 6418 m3 of water per second to the national system. In this study, we present an environmental accounting methodology that measures the use of resources per solar eMergy common unit aiming to assess the interaction of environmental sustainability indexes in water supply and sanitation companies listed on the BM&FBOVESPA in 2014. The measurement was performed by defining the boundaries of the system of each company with the sources of energy and materials that feed it. A system energy diagram was constructed and the flows were summarized in an aggregate diagram of the energy flows. From the inventory of energy and material inputs of the companies in 2013, the resources R, N, and F were inventoried in units, transformations, and eMergy/unit. It has been found that consumers are paying, in seJ/J or seJ/R$, for the resources received from natural ecosystems when they buy products and services in cash. The calculation of accounting indicators in eMergy (EYR, ELR, and SI) and the ternary diagram in eMergy and their sustainability lines indicated the companies’ positions in relation to environmental sustainability indicators. Investors of the BM&FBOVESPA acknowledge and perceive positive value in companies labeled as sustainable. Between 2006 and 2015, the ESI obtained a performance index 131% higher than the Ibovespa index. Clients of the companies CASAN, COPASA, SABESP, and SANEPAR pay in their water and sewage treatment bills (average values in R$) for 72.5% of the total eMergy they receive. There is a disadvantageous relation between the biosphere and the water and sewage treatment systems operated by the assessed companies.
Keywords: Environmental sustainability; Water supply companies; BM&FBOVESPA; eMergy.
Assessment of environmental sustainability indexes
of water supply and sewage treatment companies
listed on the BM&FBOVESPA
Avaliação de variáveis de sustentabilidade ambiental nas empresas de abastecimento de água e saneamento listadas na BM&FBOVESPA
Carlos Alberto Di Agustini1 Biagio Fernando Giannetti2
1 Fundação Getulio Vargas – FGV, Praia de Botafogo, 190, 12º andar, CEP 22253-900, Rio de Janeiro, RJ, Brasil, e-mail: agustini@
fgvmail.br
2 Laboratório de Produção e Meio Ambiente – LaProMa, Universidade Paulista – UNIP, Rua Dr. Bacelar, 1212, Mirandópolis,
CEP 04026-002, São Paulo, SP, Brasil, e-mail: biafgian@unip.br Received Sept. 11, 2016 - Accepted Aug. 27, 2017
1 Introduction
Assessing environmental sustainability indexes in the companies is a task of extreme complexity. Scientific knowledge about the business activities interference in the biosphere is still incipient. In this paper, we present an environmental accounting methodology which measures the use of resources and is based on the use of common solar eMergy unit - the amount of power needed directly and/or indirectly - to obtain a particular good, product or service in a process.
According to UN Water report, from the United Nations (UN), our planet is the scene of an offensive, sometimes even warlike, for water. Supply difficulties for the population who needs at least 50 liters of water per day/inhabitant to meet its needs can lead 4 billion people to suffer from water shortages by 2030 (WWAP, 2014).
In Greater São Paulo Region, due to supply shortage through rainfall volume below the historical minimum in 84 years, mainly in Cantareira (It is the largest of the systems managed by SABESP and one of the largest in the world, designed to capture and treat water for Greater São Paulo. It consists of six dams interconnected by a complex system of tunnels, channels, in addition to a high-tech pumping station to overcome the physical barrier of Serra da Cantareira) system, the population of most cities within the metropolitan area supplied by Companhia de Saneamento Básico de São Paulo (SABESP), began receiving in 2014 a 30% discount on the price of used water, subject to a minimum saving of 20% in volume (Sistema Cantareira, 2014).
According to Molinos-Senante et al. (2016), water shortage is one of the main problems faced by many regions in the world in the 21st century and has become one of the most critical factors in the management process of some companies, due to factors such as: climate change, urbanization rate increase and income and industrial production growth.
For Campos et al. (2013), based on a long historical process of human awareness maturation in face of economic development, environmental management began to incorporate several governmental and business initiatives that sought more appropriate management forms to guarantee a better future for society on the planet.
More and more companies have sought to integrate economic indexes with environmental ones. The use of metrics that measure the use of natural resources and the impacts of productive activities broaden the traditional meanings of accounting assets and liabilities, relating them to biosphere preservation, according to balance and accountability (One of the pillars of corporate governance: responsible accountability, ethical reasoning and good accounting and auditing practices) concepts (Kassai et al., 2012).
Among the different investment choices, the actions’ and companies’ value perception is very important for investor’s decision-making, influenced by factors such as liquidity, return and risk, measured with objective and subjective information, coming from the stock exchange and other sources.
The companies’ value perception by investors is influenced by several factors, among them by reasons of environmental nature. Increased use of renewable resources (R) such as water, minimization of the use of non-renewable resources (N) and generated waste, and it could interfere with companies’ profitability and survival (Bertolini et al., 2012).
According to Giannetti (2009 apud Di Agustini, 2009), the stock exchange is the space in which companies can obtain resources, stimulating business activities and generating capital accumulation. Figure 1 shows the investment system key components through a stock exchange.
The main flows of a productive system are shown in Figure 1, where the resources and products flow are parallel to money flows in the opposite direction. The two flows are interdependent: without resources and products, it is not possible to promote money flow, and, in turn, without capital, resource and product flows do not occur. The transaction takes place under control of the price that is the result of the market value, observing ideal conditions to the economic principle of balance between supply and demand.
In 2014, four companies in water supply and sanitation segment were listed on the Stock Exchange, Commodities and Futures: Companhia Catarinense
Figure 1. Representation of capital flows through the stock
capacity for renewal. Within this class are sources of resources such as coal, oil, forests, drinking water, etc.
The overall goal of this work is to assess the interaction of environmental sustainability indexes in water supply and sanitation companies listed on BM&FBOVESPA in 2014, in accordance with the determinations of BM&FBOVESPA Corporate Sustainability Index (ISE) Advisory Board, which starting in 2008 began to classify as critical environmental aspect the companies that intensively use N resources and few R resources.
In order to reach the goal, the system boundaries of each company were defined with the energy and material sources that feed it, a system energy diagram (Odum, 1996) was constructed and the flows were summarized in an aggregate diagram of the energy flows. The energy and material inputs of the assessed companies were transformed into specific transformation or eMergy to inventory R, N and F resources in units, transformations and eMergy/unit.
The verification results whether consumers are paying, in seJ/J or seJ/R$, the resources received from natural ecosystems, calculations of accounting indicators in eMergy (EYR, ELR and SI) and ternary diagram in eMergy and its lines of sustainability are shown in Tables 2 and 3 and Figure 2.
de Águas e Saneamento (CASAN), Companhia de Saneamento de Minas Gerais (COPASA), SABESP and Companhia de Saneamento do Paraná (SANEPAR) (BM&FBOVESPA, 2014a).
For Pontes & Schramm (2004), water supply and sanitation companies are of public utility due to their individual and collective size, as they manage scarce and finite natural resources. They are concessionaires of essential services to population with majority share control of federation units, as presented in Table 1 (Brasil, 2006)
The presence of the state as controller of the water supply activity is marked by a long process that is confused with the history of Brazil.
Here reside six of ours: Four Fathers and two brothers. The Church is not very big. It has fence full of earthy fruits and quinces; and in the cloister a well of good water. José de Anchieta, in a letter of 1585 (Anchieta, 1595).
R resources are withdrawn from the environment and have faster temporal and spatial renewal capacity than their consumption/use. Within this class are solar energy, winds, rain, etc. N resources are stored in nature, but their consumption is faster than their
Table 1. Water supply companies on BM&FBOVESPA in 2015.
Company Majority shareholder Total capital %
CASAN State of Santa Catarina* 67.34%
COPASA State of Minas Gerais 51.13%
SABESP State of São Paulo 50.25%
SANEPAR State of Paraná 58.73%
*Including participation of Centrais Elétricas de Santa Catarina (CELESC). Source: BM&FBOVESPA (2015).
Table 2. Inventory of resources received and paid by companies’ clients. Consumer advantage/disadvantage
Sej/year (%)
SABESP COPASA SANEPAR CASAN
7.04E+22 2.31E+22 1.47E+22 4.01E+21 Emergy paid by clients
7.97E+22 3.59E+22 1.84E+22 7.09E+21 Emergy received by clients (F+R)
88% 64% 80% 58% Paid/received (F+R)
1.13 1.56 1.25 1.73 Received (F+R)/paid by clients
>1 = consumer advantage; <1 = company advantage. Source: Elaborated by the authors (2014).
Table 3. Companies’ eMergy accounting indicators.
Sej/year (%)
SABESP COPASA SANEPAR CASAN
R 5.66E+22 2.52E+22 1.30E+22 4.82E+21
N 1.83E+22 8.63E+21 4.22E+21 1.77E+21
F 4.78E+21 2.16E+21 1.10E+21 4.96E+20
ELR 0.41 0.43 0.41 0.47
EYR 16.67 16.67 16.67 14.29
SI 40.80 38.89 40.80 30.36
the same position, stand or balance. Sustainability comes from the Latin sustentare which means to suster, sustain, support, preserve or maintain.
The scientific work related to sustainability theme mainly addresses the relevance of environmental issues within the scope of questioning the predatory nature of production systems to meet humanity’s consumption needs. In the early 1980s, the UN resumed the debate on environmental issues, when Norway’s Prime Minister, Grö Harlem Brundtland, headed the World Commission on Environment and Development to study the matter. The final document of these studies was called Our Common Future or Brundtland Report. Presented in 1987, it proposes sustainable development, that is, “[…] one that meets the needs of the present without compromising the possibility of future generations to meet their needs” (Comissão Mundial sobre o Meio Ambiente e Desenvolvimento, 1991, p. 114).
Munck & Souza (2013) argue that the concept of sustainable development is fragile by the economic logic that favors the will of the market and that transfers to the environment the misconception of global and uninterrupted economic growth.
According to Miranda (2009), there is no man-nature relation. Being man a social being, there are relations between men through nature - nature is always object of social relationships, not their purpose. With the increase of population on the planet, growth of economic and technological power to meet the consumption needs of mankind, the ecosystems, watersheds, forests, oceans, continents, soil, air and water started to be reached.
Daly (1996), one of the ideologists of the Theory of Sustainability and Ecological Economy, suggested three conditions for defining the sustainable limits that can be applied to business activities.
1st Sustainability Condition: R resource source
use speed should not exceed the regeneration speed of these resources. For example, fishing becomes unsustainable when fishes are caught in an amount greater than their reproductive capacity.
To further examine this issue, according to Barret & Odum (2007), regeneration is the ratio between the processing rate and the content. The regeneration can be expressed as a fraction of the total amount of a substance in a compartment, which is released (or enters) in a given period of time; the regeneration time is its reciprocal, i.e. the time required to replace the amount of substance equal to its quantity in the compartment. For example, if 1,000 units are present in the compartment and 10 exit or enter per hour, the regeneration rate is 10/1,000 (0.01) or 1% per hour. The regeneration time would then be 1,000/10 or
2 Theoretical reference
The environmental degradation intensified since the Industrial Revolution led to actions and initiatives involving various segments of society aiming at raising awareness of population and, consequently, the change of posture of the individuals and companies. The actions and initiatives are numerous, among them: Biosphere Conference (Paris, 1968); United Nations Conference on Environment (Stockholm, 1972); Eco 92 or Rio 92 (Rio de Janeiro, 1992); World Summit on Sustainable Development or Rio + 10 (Johanesburgo, 2002); Intergovernmental Panel on Climate Changes (Paris, 2007), Rio + 20 (Rio de Janeiro, 2012) and Integrated Report promoted by International Integrated Reporting Council (IIRC), an organization that promotes the integration among the financial, sustainability and governance information into corporate reports, launched worlwide on April 16th, 2013, in Brazil by BM&FBOVESPA (Alves & Barbosa, 2013).
2.1 Sustainability
The issues concerning the environment and the biosphere sustainability are not recent. According to Swearer (2004, p. 21), in the fifth century b.C., there are textual records that Buddha warned about the importance of forests under an environmentalist perspective.
The discussions about sustainability-related themes have a multidisciplinary dimension and a diffuse and complex concept. Sustainability is the word of order that has become common in most diverse environments, being appropriated by corporate executives, investors, politicians, social activists, academics, workers and others. According to Ferreira (2001), sustainability is a feminine noun meaning sustainable quality. Sustainable, in turn, is also an adjective, which can be sustained, and sustain, direct transitive verb, is to conserve, maintain, prevent ruin, protect, defend, hold Figure 2. Companies positioning in the ternary diagram in
unfavorable to the national system, as shown in Table 4 (ONS, 2014).
2nd Sustainability Condition: N resource source
use speed should not exceed the development speed of the substitute R. For example, an oil field could be used sustainably if a portion of the financial resources of its exploração were invested in R source power generation and tree planting, so that when oil was exhausted, a sufficient R source of energy would still be available for production activities and consumption. According to McKelvey (1982), N resources cannot be replenished and their reserves can be exhausted by the extraction of productive systems, i.e. what is available and extracted today will no longer be available tomorrow. Thus, if the technological one hundred hours. While a pond may have a rate of
1 day to renovate its tiny plants, longer-living land plants of a pasture may take 100 days and the trees of a forest 100 years.
The withdrawal of water from Cantareira system is an example of non-compliance with the first sustainability condition. The withdrawal speed by increasing use of R finite resource (water) of the reservoirs exceeds the capacity of the ecosystem to regenerate the reservoir (ANA, 2014).
The phenomenon covers the entire national territory. The critical level of Brazilian hydropower plant reservoir waters represents the breaking of the first sustainability condition. According to National Electric System Operator (ONS), the sum of the afluence volume minus the sum of the defluence volume results in 6,418 m3 of water per second
Table 4. Position of Brazilian reservoirs in September 2015.
Basin Reservoir Level* Afluence** (A) Defluence** (D) A-D
Southeast Region
Grande Furnas 23.12 138 518 -380
M. Moraes 47.22 566 858 -292
Marimbondo 15.84 966 1,010 -44
Água Vermelha 20.81 1,520 849 671
Paranaíba Emborcação 29.43 218 603 -385
Nova Ponte 18.01 33 194 -161
Itumbiara 17.92 1,362 1,406 -44
São Simão 21.32 1,790 1,844 -54
Paraná Ilha Solteira 0 3,049 2,850 199
Jupiá 92.38 4,490 4,031 459
Itaipu 79.75 9,831 9,831 0
Tiete Barra Bonita 63.19 193 222 -29
Promissão 29.63 419 252 167
Três Irmãos 0 165 448 -283
Paranapanema Jurumirim 25.08 276 235 41
Chavantes 31.03 406 368 38
Capivara 57.35 1,220 1,275 -55
South Region
Iguaçu G. B. Munhoz 47.13 786 1,006 -220
Salto Santiago 97.78 1,541 1,421 120
Uruguai Machadinho 33.64 988 1,226 -238
Itá 58.43 1,509 1,199 310
Passo Fundo 94.93 79 62 17
Jacuí Passo Real 84.25 249 415 -166
Notheast Region
São Francisco Três Marias 5.55 66 163 -97
Sobradinho 31.09 330 1,129 -799
Luiz Gonzaga 20.12 990 982 8
North Region
Tocantins Serra da Mesa 34.71 81 843 -762
Tucuruí 37.93 2,312 6,751 -4,439
Fechadas de Previdência Complementar (ABRAPP); Associação Nacional de Bancos de Investimentos (ANBID); Associação dos Analistas e Profissionais de Investimentos do Mercado de Capitais (APIMEC); BM&FBOVESPA; Instituto Ethos de Empresas e Responsabilidade Social (ETHOS); Instituto Brasileiro de Governança Corporativa (IBGC); International Finance Corporation - Banco Mundial (IFC); Ministério do Meio Ambiente (MMA) and Programa das Nações Unidas para o Meio Ambiente (PNUMA). Fundação Getulio Vargas (FGV) is the institution responsible for ISE research and methodology, whose portfolio from January 6, 2014 to January 2, 2015 was composed of 40 companies (BM&FBOVESPA, 2014b).
From its creation in December 2005 to December 2015, ISE recorded an accumulated growth rate higher than that of Ibovespa (Indicator of average performance of greater tradability and representativeness shares’ quotations in the Brazilian stock market), according to Table 5.
Table 5 shows that investors seek to invest in stocks and shares of companies commited to sustainable management practices. From 2006 to 2015 ISE achieved a performance of +222% in relation to Ibovespa, proving the positive perception of value by the investors in relation to companies labeled as sustainable.
Out of the four companies assessed, SABESP and COPASA are part of ISE from January 2014 to January 2, 2015 (BM&FBOVESPA, 2014b).
The integration of economic indexes with environmental ones and the use of metrics that measure the use of natural resources for companies listed in ISE are aspects of Agency Theory that contribute to the expansion of the traditional meanings of accounting assets and liabilities, relating them to preservation development of R substitute materials to N ore is
less than the extraction rate, the ore reserves may be exhausted. However, as mentioned in the 1st sustainability condition, R substitute material of N ore must observe the regeneration rate (processing rate and content) and the time required to replace the quantity of substance equal to its quantity in stock (Barret & Odum, 2007).
The existing relationship between N and R resources of biosphere with the production systems is complex. In the process of producing goods and services, not all N resources can be replaced by R resources by the companies. N resources, whose reserves are in extinction, may be replaced by other N resources with larger reserves, such as Ford’s replacement of steel by aluminum in manufacturing pickup trucks (Ramsey, 2012).
3rd Sustainability Condition: The emission
of pollutants (or waste) should not exceed the absorption capacity of the biosphere. For exemple, sewage cannot flow into a river, lake or underground reservoir faster than bacteria and other organisms can absorb their nutrients without themselves pressing and destabilizing the aquatic ecosystem.
For Brown (2009), when analyzing Earth situation against the intense use of natural resources and the economy flows which depend on the ecosystems/environment, he argues that if there is no environment, if everything is destroyed, there is no economy. Thus, the fundamental issue envolving corporate sustainability is directly associated with environmental sustainability (extraction and use of N and R resources in productive systems, waste generation and impacts on ecosystems and people) and the daily activities of human beings (life style and consumption).
2.2 BM&FBOVESPA ISE
Created in 2005, ISE is the fourth indicator in the world and a pioneer initiative in Latin America, and is the result of the efforts of several institutions to make it a benchmark for sustainable investments. It is a tool for comparative performance analysis of companies listed on BM&FBOVESPA, whose purpose is to create an investment environment compatible with the demands of sustainability development of society and stimulate more sustainable practices in companies (Bassetto, 2010).
ISE is a reference shares index for environmentally responsible investments, composed of companies that stand out in sustainability. The Advisory Board is composed of members of the following institutions: Associação Brasileira das Entidades
Table 5. ISE and Ibovespa growth rates. Growth rate (%)
Ibovespa
Year ISE
2006 +37.8 +32.9
2007 +40.4 +43.6
2008 -41.1 -41.2
2009 +66.4 +82.7
2010 +5.8 +1.0
2011 -3.3 -18.1
2012 +20.5 +7.4
2013 +1.9 -15.5
2014 -1.9 -2.9
2015 -10.9 -10.6
Accumulated 108.2 33.6
Annual average 7.6 2.9
Monthly average 0.61 0.24
2.4 R and N resources
From 2008, ISE started to contemplate in the methodology environmental aspects deemed critical by ISE’s Advisory Board: N and R natural resources (Denomination applied to all raw materials (R and N), obtained directly from nature and used by man. They are classified as R or N resources due to the time needed for their replacement. N resources include substances that cannot be recovered in a short period of time, such as, for example, oil and ores in general. R resources are those that can renew themselves or can be recovered with human interference, such as forests, sun light, wind and water. Equation 1 shows the formula) ISE considers as critical, the environmental impact that, due to technical (severity, reversibility, magnitude, spatial range), social or legal criteria, demands specific actions of prevention, control and monitoring by companies.
The decision of ISE’s Advisory Board to classify as a critical environmental aspect, companies that intensively use N resources and use few R resources are in compliance with the terms and conditions for definition of sustainable limits of a production system (Daly, 1996; Barret & Odum, 2007; McKelvey, 1982; Brown, 2009; Giannetti 2009 apud Di Agustini, 2009).
2.5 Assessment in eMergy
The conceptual basis and application on eMergy was developed by Odum (1996), when proposing a consistent methodology, capable of measuring the use of resources of a given system, called environmental accounting. Such accounting is based on the use of the solar eMergy common unit, which is the quantity of energy required, directly and/or indirectly, to obtain a particular good, product or service, in a process.
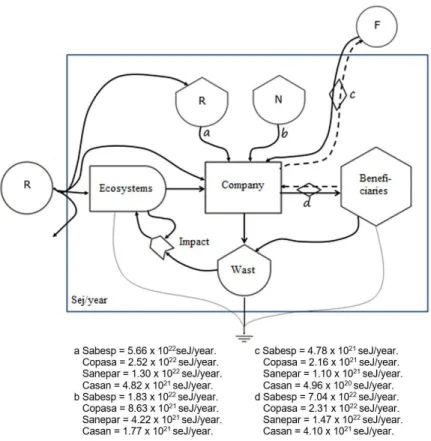
Odum (1996) proposes the construction of flow diagrams for a better visualization of the resources, which travel between the boundaries of the economic (F) and natural ecosystems (R and N resources) environments, using a symbology, that represents the flow of energy in the processes. All the resources used in the processes, natural R and N and those from the economic environment F, are counted by Joule of solar energy (seJ) - standard and common metric in the methodology.
Accounting through assessment methodology in eMergy scientifically measures the interference of a production system in the biosphere, segregating and inventorying N and R resources (Figure 3), in compliance with the measures adopted by ISE’s Advisory Board from 2008.
Figure 3 illustrates that the assessment in eMergy is a methodology with scope of the interference of production systems with natural ecosystems, considering the inventories of R and N resources of the biosphere, F resources of the economy with of all biosphere, according to corporate governance
concepts (Sant’Ana et al., 2016).
The modeling of systems that assess the sustainability of water supply and sanitation companies is addressed as a crucial aspect of corporate governance related to transparency and respect for the various stakeholders in the decision process (Marques et al., 2015).
2.3 Environmental sustainability indexes For Collen et al. (2008), on the measurement of complex indexes, such as environmental and corporate sustainability, the construction of metrics and indicators ends up presenting operational difficulties. They quote, for example, the difficulty to measure the planet’s ecosystems, being necessary attribution of estimates and analogies. The estimates, by nature, are susceptible to controversy and contestation, because they may have an associated degree of subjectivity.
There is a large amount of metrics, indicators and tools for measuring sustainability. According to Kerk & Manuel (2008), there are no metrics that provide a complete insight into all relevant aspects of sustainability in a transparent, simple and easily understood way, although sustainability indicators are increasingly recognized as useful tools in making investment decisions.
According to Pulselli et al. (2008), in analyzing sustainability measurement, given the complexity of the process and the large number of existing indicators, according to UN Commission on Sustainable Development (CSD) (Created on January 29th, 1993, by the UN General Assembly, through Resolution A/RES/47/191 (UN, 1993)) and UN Resolution A/RES/47/191 (Resolution 47/191, of December 22nd, 1992, Institutional arrangements to follow up
United Nations Conference on Environment and Development, A/RES/47/191, 29 January 1993 (UN, 1993)), a sustainability indicator should include the following requirements:
based on a solid scientific base recognized by
the international community;
relevant to encompass the crucial factors of
sustainable development, including local and global aspects;
transparent so that it is understood by an audience non-specialized on the theme;
quantifiable and anchored by data available or
easy to obtain and update; and
limited in quantity, depending on the purpose
the greater the sustainability index, that is, the greater the contribution of the systems to the biosphere sustainability.
SI EYR ELR= ÷ (1)
The SI assumes that for the purposes of environmental sustainability, the higher this index, the more sustainable is the assessed system, because it minimizes the environmental load, that is, it maximizes the ratio between the use of the resources employed (EYR) in relation to the environmental impact (ELR) (Brown & Ulgiati, 1997).
The concept of sustainability, considering the environmental dimension (biosphere), is associated to the maximization of EYR and the minimization of ELR, that is, a sector, a company or product/service should have the maximum use of the investment with a minimum of consumption of the environmental resources.
SI values below 1 are indicative of unsustainable systems (Brown & Ulgiati, 1997). Systems with values greater than 1 indicate sustainable contributions to the environment. Medium-term sustainability can be characterized by a SI between 1 and 5, while long-term sustainability has a SI greater than 5.
2.5.2 eMergy Yield (EYR)
EYR (emergy yield ratio) is an eMergy of output flow Y (product, process, system or service) divided by the sum of eMergies from the economy F. Equation 2 shows the formula.
clients (beneficiaries) and the generation of waste and impacts.
The great innovation proposed by Odum (1996) was to structure a methodology that makes it possible to account for and measure different resources and processes, usually measured by different methods and units, using a common metric (solar energy joule - seJ). For that, Odum (1996) conceived the concept of solar transformity - amount of solar energy used, directly and/or indirectly - in obtaining a joule of a given product/process (seJ/J). In determining transformity of the system under study, it is possible to calculate cumulatively, from the use of the first resources in the system, the indirect solar power required to obtain another product/process (Odum, 1996). Assessment in eMergy allows the measurement of biosphere resources use by corporate production systems using a standard metric - seJ.
From the inventory of all the resources used in the processes, natural R and N and those from F economic environment, accounted for in seJ, it is possible to calculate the following indicators in eMergy.
2.5.1 Environmental sustainability indicator (SI)
According to Brown & Ulgiati (1997), SI represents the ratio between resources use (EYR) and environmental impact (ELR). The better the resource use and the lower the environmental impact,
measure the efficiency of the system for the use of reserves and environmental support capacity, required for its activities; and
compare and monitor the performance of the
system assessed over time (Giannetti et al., 2007b).
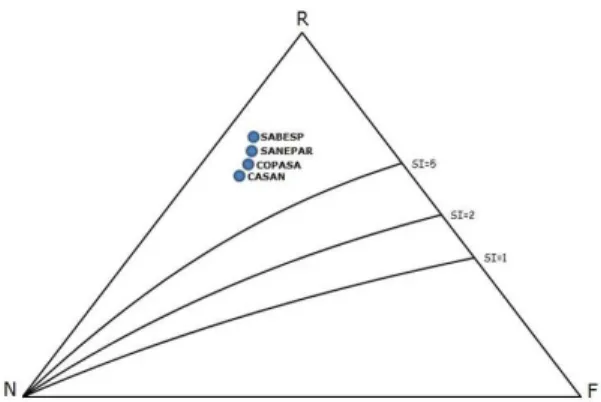
The ternary diagram in eMergy complements Odum’s environmental accounting and extends the methodology to the extent that it allows the establishment and easy viewing of the sustainability lines, comparing processes and identifying more environmental-friendly production systems (Figure 4).
The assessment in eMergy scientifically measures the interference of water and sanitation sector companies listed on BM&FBOVESPA (CASAN, COPASA, SABESP and SANEPAR) in the biosphere, segregating and inventorying N and R resources (Figures 3 and 4), in compliance with the determinations of ISE’s Advisory Board.
3 Methodology
To achieve the goal proposed herein:
The boundaries of the system of each company were defined with the energy sources and materials that feed it, building a system energy diagram, using its own symbology to represent the different components of each company (Odum, 1996), flows were summarized in an aggregate diagram of energy flows.
From the systems energy diagram, a table was built with all the energy and materials inputs of the assessed company, selecting the transformity or specific eMergy for each of these inputs to calculate the eMergy, according to Tables 6 and 7.
The inputs to calculate the eMergy of each company were obtained from the annual financial statements (balance sheets), for the financial year of 2013, published by the assessed companies.
EYR=(R N F+ + )÷F (2)
EYR measures the ratio between the total output eMergy of the system assessed and the economy’s/paid resources not provided, free of charge, by the biosphere (F). It represents the influence of F resources in the assessed system or the use of R and N resources in the process.
2.5.3 Environmental load indicator (ELR) ELR (environmental loading ratio) shows the ratio between the economic investment flows F, N resources and eMergy associated to the R resources flow. Equation 3 shows the formula.
ELR=(N F+ )÷R (3)
ELR assesses the stress of the ecosystems resulting from the activities of the assessed system. High ELR value may indicate a stress of R resources use (Odum, 1996).
Brown & Ulgiati (2002) developed a method to assess the accounting in eMergy with the use of SI, in which the reserves used to obtain the products and the components of the productive system, constitute relations, which are assessed through this index, considering the available local inputs, those imported from outside the system and the fraction of renewable and non-renewable inputs.
Barrella et al. (2005) and Giannetti et al. (2007a) proposed a graphical tool called ternary diagram in eMergy, in which, through an equilateral triangular diagram, the three indexes (R, N and F) used in the object of study are associated with (I was in doubt) percentages of each resource, that is, the sum of R, N and F resources will always be 100%. Thus, it is possible to represent the three indexes in two dimensions, allowing better visualization and understanding of the contribution of environmental (R and N) and economic/paid (F) resources in a system.
R and N resources flows are provided by the biosphere and have no economic value measured by traditional accounting metrics, while R resources can be replenished by the environment at least at the same rate at which they are consumed, N resources can be exploited without time for recovery by the environment. F resources come from the market and have value in currency (Giannetti et al., 2007a).
The ternary diagram in eMergy enables:
identify trends and differences regarding the sustainability of the systems assessed;
verify indexes that can be changed and/or
rearranged to improve the environmental
801
801/806
onmental sustainability indexes...
R$ Brazil transformity
Unit Quantity eMergy
sej/unid. Unit Source
2013 SABESP COPASA SANEPAR CASAN
R resources Ra m3 4,686,347,400 1,478,868,607 1,185,347,038 271,340,745 2.92E+11 Sej/m3 Buenfil (average)
Paid resources (F) - flow
Costs abd expenses R$ 8,399,283,000 3,148,360,000 1,826,049,000 556,643,000 6.22E+12 EmR$/year c
Taxesb R$ 732,040,000 146,363,000 141,226,000 25,037,000 6.22E+12 EmR$/year c
Use of assets (F) - inventories
Current assets R$ 3,254,087,000 1,079,708,000 601,122,000 345,860,000 6.22E+12 EmR$/year c
Long-term assets R$ 896,781,000 1,270,102,000 577,633,000 187,462,000 6.22E+12 EmR$/year c
Permanent assets
Investments R$ 77,699,000 260,000 2,937,000 304,000 6.22E+12 EmR$/year c
Fixed assets R$ 199,496,000 5,334,365,000 5,314,728,000 290,998,000 6.22E+12 EmR$/year c
Intangible assets R$ 23,846,231,000 8,672,619,000 251,607 1,504,284,000 6.22E+12 EmR$/year c
Total used (F) R$ 13,559,386,000 19,651,777,000 8,463,946,607 2,910,588,000
Total used (Buenfil average) Sej/m3 2.27E+12 Buenfil (average)
Drinking water production m3 2,149,100,000 685,476,240 578,751,800 177,627,190 3.20E+11 Sej/m3 Buenfil (2001)
Treated sewage production m3 1,579,100,000 455,626,080 372,570,060 31,096,460 1.05E+11 Sej/m3 Arias & Brown (2009)
Total Y m3 3,728,200,000 1,141,102,320 951,321,860 208,723,650 2.26E+12 Sej/m3 Buenfil (Tampa Bay)
Received from customers R$ 11,315,567,000 3,714,818,000 2,370,179,000 659,952,000 6.22E+12 EmR$/year c
Average rate drink water R$/m3 5.27 5.42 4.10 3.72
(Odum, 1996), the relationship of resources received by clients versus resources paid in eMergy, from the companies’ resource inventory is presented (Table 2).
The accounting indicators in eMergy (EYR, ELR and SI, Table 3) were calculated and the ternary diagram in eMergy and its sustainability lines were constructed to better visualize the companies’ position regarding the environmental sustainability indicators (Figure 2).
4 Results and discussion
4.1 Flow of exchanges between the environment and the companies, in seJ/J or seJ/R$
The relationship resources received by clients versus resources paid in eMergy, from the inventory of companies resources, considering the flow of exchanges between the environment and production/consumption systems (Odum, 1996), is presented in Table 2. Considering that in 2013 the companies did not use
the totality of the resources available, because items of a permanent nature benefit several fiscal years, the inventory of resources in each year contemplated the percentage of use of these items in compliance with the Laws in effect (Brasil, 1976, 1999).
From the inventory of energy and material inputs of companies in fiscal year 2013, R, N and F resources were inventoried in units, transformities and eMergy/unit, according to Table 8.
Figure 5 presents R, N and F summarized resources of the companies SABESP, COPASA, SANEPAR and CASAN inventoried, considering the energy and material inputs, from the data published in the annual financial statements (balance sheets), of the year 2013.
Considering the flow of exchanges between the environment and production/consumption systems, in order to verify if consumers are paying, in seJ/J or seJ/R$, the resources received from natural ecosystems when they buy products and services paid in cash
Table 7. Energy and materials inputs used by the companies in 2013 in Sej/year. R$ Brazil transformity
Unit Economic lifec
Sej/year
2013 SABESP COPASA SANEPAR CASAN
R resources Ra m3 1.37E+21 4.32E+20 3.46E+20 7.93E+19
Paid resources (F) - flow
Costs abd expenses R$ 1 5.22E+22 1.96E+22 1.14E+22 3.46E+21
Taxesb R$ 1 4.55E+21 9.10E+20 8.78E+20 1.56E+20
Use of assets (F) - inventories
Current assets R$ 1 2.02E+22 6.72E+21 3.74E+21 2.15E+21
Long-term assets R$ 5 1.12E+21 1.58E+21 7.19E+20 2.33E+20
Permanent assets
Investments R$ 25 1.93E+19 6.47E+16 7.31E+17 7.56E+16
Fixed assets R$ 25 4.96E+19 1.33E+21 1.32E+21 7.24E+19
Intangible assets R$ 10 1.24E+20 5.39E+21 1.56E+17 9.36E+20
Total used (F) R$ 7.97E+22 3.59E+22 1.84E+22 7.09E+21
Total used (Buenfil average) Sej/m3 8.48E+21 2.60E+21 2.16E+21 4.75E+20
Drinking water production m3 1 6.88E+20 2.19E+20 1.85E+20 5.68E+19
Treated sewage production m3 1 1.66E+20 4.78E+19 3.91E+19 3.27E+18
Total Y m3 8.54E+20 2.67E+20 2.24E+20 6.01E+19
Received from customers R$ 1 7.04E+22 2.31E+22 1.47E+22 4.10E+21
Average rate drink water R$/m3 102.34 105.34 79.60 72.22
aIncludes losses in process; bIncome tax and social contribution; cBrazil: Federak Revenue Normative Instruction/98 and Law 6.404/76
(Brasil, 1976, 1999). Source: Elaborated by the authors (2014).
Table 8. Inventory of R, N and F resources of the companies.
Sej/year (%)
SABESP COPASA SANEPAR CASAN
R 71% 70% 71% 68%
N 23% 24% 23% 25%
F 6% 6% 6% 7%
of companies position regarding environmental sustainability indicators are illustrated in Figure 2.
Table 3 shows that all assessed companies presented long-term sustainability (Brown & Ulgiati, 1997), because they presented SI higher than 5. The companies SABESP and SANEPAR are those with the highest SI, i.e., they operate with better sustainability conditions in the long term. Thus, SANEPAR should integrate ISE in the period from January 2014 to January 2nd,
2015 instead of COPASA.
CASAN has the worst classification in the ranking by SI, greater environmental load (ELR), less use of R resources and greater use of N resources in its operational activities.
5 Conclusions
In order to achieve the goal of assessing the interaction of environmental sustainability indexes in water supply and sanitation companies listed on BM&FBOVESPA in 2014, the boundaries of each company’s system with the energy and materials sources that feed it were defined, an energy diagram of the system was elaborated (Odum, 1996) and the flows in an aggregate diagram of the energy flows were summarized.
Tables 6 and 7 show all energy and material inputs of the companies assessed, selecting the specific Table 2 reveals that the average ratio of the amount
of resources in eMergy received by clients of the companies for eMergy paid is 1.42. The clients received in 2013 an average of 42% more resources in eMergy than they paid in seJ.
Consumers in the state of Santa Catarina (CASAN) are the ones that pay less for water and sewage treatment services. They pay 58% of the eMergy received or receive 73% more in resources in eMergy, indicating a significant advantage for consumers. On the other hand, consumers in the state of São Paulo (SABESP) are the ones that pay the most for water and sewage treatment services. They pay 88% of the eMergy received or receive 13% more in eMergy, also indicating an advantage for consumers.
Companies’ clients paid in water and sewage treatment rates, on average R$, 72.5% of total eMergy received. In eMergy, there is a disadvantage relation between the biosphere and the water and sanitary sewage treatment system operated by the companies assessed herein.
4.2 eMergy accounting indicators
eMergy accounting indicators (EYR, ELR and SI) are shown in Table 3 and the ternary diagram in eMergy and its sustainability lines for better viewing
transformity or eMergy for each of these inputs to calculate the eMergy.
From the inventory of energy and material inputs of the companies in fiscal year 2013, R, N and F resources were inventoried in units, transformities and eMergy/unit, according to Table 8.
The results of the verification whether consumers are paying in seJ/J or seJ/R$, the resources received from natural ecosystems when they buy goods and services paid in cash (Odum, 1996), ratio resources received by clients versus resources paid in eMergy, were presented in Table 2.
The calculation of the accounting indicators in eMergy (EYR, ELR, SI) and the ternary diagram in eMergy and its sustainability lines indicating the positions of companies in relation to environmental sustainability indicators are presented in Table 3 and Figure 2.
Incorporate scientific requirements for physical measurement of N and R resources use from business activities allows investors to direct resources to companies that generate greater environmental sustainability in the long run.
The main limitation of this study is to assess the environmental sustainability indexes of companies anchored by the information of annual financial statements (balance sheets) published.
By way of suggestions for future studies, there are many possibilities for expanding, deepening and developing methodologies and scientific tools, in theoretical and empirical fields, to measure the interference of production activities in the biosphere.
The convergence regarding the need to assess the environmental dimension of companies/business sectors is undeniable. The tools and methodologies of scientific measurement that reach the limits of natural ecosystems and physically measure the interference of productive activities on the biosphere are the safest way to assess sustainability in the environmental dimension.
In the legal field, incorporating scientific requirements for physical measurement of the use of N, R, F resources and their indicators of productive activities into laws, standards and legal attributes of legal protection to natural ecosystems can contribute to minimize the ecosystems degradation.
In the capital investments evaluation are, incorporating scientific requirements for physical measurement of the use of N, R, F resources of productive activities considering the economic scale, allows investors to direct resources for investments that generate greater environmental sustainability in the long term.
Within the scope of business management, incorporating scientific requirements of physical measurement of the use of N, R, F resources of productive activities considering the economic scale in techniques and management tools, can
contribute to internalize in the financial accounting of companies, metrics that expand the traditional meanings of financial assets and liabilities, relating them to the preservation of the entire biosphere, according to concepts of balance and accountability (Kassai et al., 2012).
As stated by Meadows (1998), to measure the immeasurable may have an ambiguous aspect: The indicators may be meaningful or hazardous in the decision taking, mainly when there is subjective super aggregation of a lot of data in a single index. The “environmental dimension indicators” mitigate the subjective aggregation to the indicators because they are anchored in scientific methodologies with physical measurements.
References
Agência Nacional de Águas – ANA. (2014). Abastecimento urbano de água. Brasília. Recuperado em 13 de outubro de 2015, de http://atlas.ana.gov.br/Atlas/forms/Home.aspx Alves, V. C., & Barbosa, A. S. (2013). Práticas de gestão
ambiental das indústrias coureiras de Fraca-SP. Gestão & Produção, 20(4), 883-898. http://dx.doi.org/10.1590/ S0104-530X2013005000006.
Anchieta, J. (1595). Arte de grammatica da lingoa mais usada na costa do Brasil feyta pelo P. Ioseph de Anchieta Theologo e Provincial que foy da Cõpanhia de Iesu nas partes do Brasil, com licença do Ordinário e Prepósito Geral da Companhia de Iesu em Coimbra por Antonio de Mariz, 1595. São Paulo: Biblioteca Brasiliana Guita e José Mindlin. Recuperado em 22 de agosto de 2017, de http://www.brasiliana.usp.br/ handle/1918/00059200#page/5/mode/1up
Arias, M. E., & Brown, M. T. (2009). Feasibility of using constructed treatment wetlands for municipal wastewater treatment in the Bogota Savannah, Colombia. Ecological Engineering, 35(7), 1070-1078. http://dx.doi.org/10.1016/j. ecoleng.2009.03.017.
Barrella, F. A., Almeida, C. M. V. B., & Giannetti, B. F. (2005). Ferramenta para tomada de decisão considerando a interação dos sistemas de produção e o meio ambiente. Revista Produção, 15(1), 87-101. http://dx.doi.org/10.1590/ S0103-65132005000100008.
Barret, G. W., & Odum, E. P. (2007). Fundamentos de ecologia. São Paulo: Thomson Learning.
Bassetto, L. I. (2010). A incorporação da responsabilidade social e sustentabilidade: um estudo baseado no relatório de gestão 2005 da Companhia Paranaense de Energia – COPEL. Revista Gestão & Produção, 17(3), 639-651. http://dx.doi.org/10.1590/S0104-530X2010000300016. Bertolini, G. R. F., Rojo, C. A., & Lezana, Á. G. R. (2012).
BM&FBOVESPA. (2014a). Empresas listadas. Recuperado em 31 de março de 2014, de http://www.bmfbovespa. com.br/Cias-Listadas/Empresas-Listadas/
BM&FBOVESPA. (2014b). Carteira do ISE. Recuperado em 28 de março de 2014, de http://www.bmfbovespa. com.br/pt-br/noticias/2013/BMFBOVESPA-divulga-a-carteira-do-ISE-para-2014-2013-11-28. aspx?tipoNoticia=1&idioma=pt-br
BM&FBOVESPA. (2015). Empresas listadas. Recuperado em 13 de abril de 2015, de http://www.bmfbovespa. com.br/Cias-Listadas/Empresas-Listadas/
BM&FBOVESPA. (2016). Índices. Recuperado em 12 de janeiro de 2016, de http://www.bmfbovespa.com. br/indices/ResumoEvolucaoDiaria
Brasil. (1976, 15 de dezembro). Lei nº 6.404, de 15 de dezembro de 1976. Características e Natureza da Companhia ou Sociedade Anônima. Brasília, DF: Diário Oficial da República Federativa do Brasil.
Brasil. (1999, 7 de janeiro). Instrução normativa SRF nº162, de 31 de dezembro de 1998. Fixa prazo de vida útil e taxa de depreciação dos bens que relaciona. Brasília, DF: Diário Oficial da República Federativa do Brasil. Brasil. Ministério da Saúde, Secretaria de Vigilância em
Saúde. (2006). Vigilância e controle da qualidade da água para consumo humano. Brasília.
Brown, L. R. (2009) Plano B 4.0: mobilização para salvar a civilização. São Paulo: New Content.
Brown, M. T., & Ulgiati, S. (1997). Emergy-based indices and ratios to evaluate sustainability: monitoring economies and technology toward environmentally sound innovation. Ecological Engineering, 9(1-2), 51-69. http://dx.doi.org/10.1016/S0925-8574(97)00033-5. Brown, M. T., & Ulgiati, S. (2002). Emergy evaluations
and environmental loading of electricity production systems. Journal of Cleaner Production, 10(4), 321-334. http://dx.doi.org/10.1016/S0959-6526(01)00043-9. Buenfil, A. (2001). Emergy evaluation of water (Dissertation).
University of Florida, Gainesville.
Campos, L. M. S., Sehnem, S., Oliveira, M. A. S., Rossetto, A. M., Coelho, A. L. A. L., & Dalfovo, M. S. (2013). Relatório de Sustentabilidade: perfil das organizações brasileiras e estrangeiras segundo o padrão Global Reporting Initiative. Gestão & Produção, 20(4), 5. http://dx.doi.org/10.1590/S0104-530X2013005000013. Collen, B.; Goldfinger, S.; Kalter, R.; McRae, L.; Kitzes,
J., Wackernagel, M. (2008). 2010 and beyond rising to the biodiversity challenge. Gland: WWF.
Comissão Mundial sobre o Meio Ambiente e Desenvolvimento. (1991). Nosso futuro comum (2. ed.). Rio de Janeiro: Fundação Getulio Vargas.
Marques, R. C., Cruz, N. F., & Pires, J. (2015). Measuring the sustainability of urban water services. Environmental
Science & Policy, 54, 142-151. http://dx.doi.org/10.1016/j. envsci.2015.07.003.
Daly, H. E. (1996). Beyond growth. Boston: Beacon Press Books.
Di Agustini, C. A. (2009). Mercado de capitais e análise de ações. São Paulo: Globus Editora.
Ferreira, A. B. H. (2001). Novo dicionário da língua portuguesa. Rio de Janeiro: Nova Fronteira.
Giannetti, B. F., Barrella, F. A., Bonilla, S. H., & Almeida, C. M. V. B. (2007a). Aplicações do diagrama emergético triangular na tomada de decisão ecoeficiente. Revista Produção, 17(2), 246-262. http://dx.doi.org/10.1590/ S0103-65132007000200003.
Giannetti, B. F., Neis, A. M., Bonilla, S. H., & Almeida, C. M. V. B. (2007b) Decisões e sustentabilidade ambiental. In P. L. O. Costa No. (Ed.), Qualidade e competência nas decisões (1. ed., Vol. 1, pp. 315-336). São Paulo: Edgarg Blücher.
Kassai, J. R., Feltran-Barbieri, R., Carvalho, L. N., Foschine, A., Cintra, Y. C., & Afonso, L. E. (2012). Balanço contábil das nações: reflexões sobre os cenários de mudanças climáticas glocais. Brazilian Business Review, 9(1), 65-109.
Kerk, G., & Manuel, A. (2008). Contribution to Beyond GDP “Virtual Indicator Expo“Sustainable Society Index (SSI): a new comprehensive index for world wide use. In Proceedings of the International Conference of Beyong GDP: Measuring Progress, True Wealth, and the Well Being of Nations (pp. 14). Brussels, Belgium. McKelvey, B. (1982). Organizational systematics:
traxonomy, evolution, classification. Berkeley: University of California Press.
Meadows, D. (1998). Indicators and information systems for sustainable development. Hartland: The Sustainability Institute.
Miranda, E. E. (2009). Natureza, conservação e cultura. São Paulo: Metalivros.
Molinos-Senante, M., Mocholí-Arce, M., & Sala-Garrido, R. (2016). Estimating the environmental and resource costs of leakage in water in a distribution systems: a shadow price approach. The Science of the Total Environment, 568, 180-188. http://dx.doi.org/10.1016/j. scitotenv.2016.06.020. PMid:27289397.
Munck, L., & Souza, R. B. (2013). Compreensão do desenvolvimento sustentável em contextos organizacionais a partir do estabelecimento de tipos ideais. Revista O&S, 20(67), 651-674.
Odum, H. T. (1996). Environmental accounting: emergy and environmental decision making. New York: John Wiley & Songs.
Paulo. Recuperado em 3 de abril de 2014, de http:// sistemacantareira.com.br/
Swearer, D. K. (2004) Buddhism and ecology: challenge and promisse. Yale: Yale School of Forestry & Environmental Studies.
United Nations World Water Assessment Programme – WWAP. (2014). The United Nations World Water Development Report 2014: water and energy. Paris, UNESCO.
United Nations – UN. General Assembly. (1993, 29 de janeiro) Forty-seventh session: agenda item 79. Resolution adopted by the General Assembly [on the report of the second Committee (A/47/719)]47/191: Institutional arrangements to follow up the United Nations Conference on Environment and Development. Recuperado em 13 de outubro de 2015, de http://www. un.org/documents/ga/res/47/ares47-191.htm/
University of Florida. United Nations Environment Programme – UNEP. (2014). Environmental Accounting and Systems Synthesis of Land Management Interventions at Multiple Scales in the Sahel Region of West Africa: Database Resources: Brazil (2000). Florida. Recuperado em 18 de fevereiro de 2014, de http://sahel.ees.ufl.edu/ database_resources.php?search_type=basic&contry=BRA 2014, de http://www.ons.org.br/resultados_operacao/
boletim_diario/index.htm
Pontes, C. A. A., & Schramm, F. R. (2004). Bioética da proteção e papel do Estado: problemas morais no acesso desigual à água potável. Cadernos de Saude Publica, 20(5), 1319-1327. http://dx.doi.org/10.1590/S0102-311X2004000500026. PMid:15486675.
Pulselli, M. F., Bastianoni, S., Marchettini, N., & Tiezzi, E. (2008). The road to sustainability. Boston: WIT Press. Ramsey, M. (2012, 26 de Julho). Built Ford tough, with
Aluminum? The Wall Street Journal. Recuperado em 26 de julho de 2012, de http://online.wsj.com/article/ C46E47E2-CD54-4132-AAC6-6E56544E9A23. html#!C46E47E2-CD54-4132-AAC6-6E56544E9A23 Sant’Ana, N. L. S., Medeiros, N. C. D., Silva, S. A. L.,
Menezes, J. P. C. B., & Chain, C. P. (2016). Concentração de propriedade e desempenho: um estudo nas empresas brasileiras de capital aberto do setor de energisa elétrica. Revista Gestão & Produção, 23(4), 718-732. http:// dx.doi.org/10.1590/0104-530x2576-15.