www.ambi-agua.net E-mail: [email protected]
Rev. Ambient. Água vol. 11 n. 2 Taubaté – Apr. / Jun. 2016
Life cycle assessment of four potable water treatment plants in
northeastern Colombia
doi:10.4136/ambi-agua.1759
Received: 18 Sep. 2015; Accepted: 29 Mar. 2016
Oscar Orlando Ortiz Rodriguez1*; Raquel Amanda Villamizar-Gallardo2; Rafael Guillermo García3
1Universidad de Pamplona, Facultad de Ingenierías y Arquitectura, Pamplona, Norte de Santander, Colombia
Departamento de Ingeniería Industrial
2Universidad de Pamplona, Facultad de Ciencias Básicas,
Pamplona, Norte de Santander, Colombia Departamento de Microbiología
3Universitaria Agustiniana (Uniagustiniana),Bogotá, D.C, Colombia
Departamento de Vicerectoría de investigaciones *Corresponding author: e-mail:[email protected], [email protected], [email protected]
ABSTRACT
There is currently great concern about the processes that directly or indirectly contribute to the potential for global warming, such as stratospheric ozone depletion or acidification. In this context, and provided that treated water is a basic public utility in urban centers around the world as well as in some rural areas, its impact on the environment is of great interest. Therefore, this study applied the environmental methodology of Life Cycle Assessment (LCA) to evaluate the environmental loads of four potable water treatment plants (PWTPs) located in northeastern Colombia following the international guidelines delineated in ISO 14040. The different stages of the drinking water process were thoroughly assessed, from the catchment point through pumping to the distribution network. The functional unit was defined as 1 m3 of drinking water produced at the plant. The data were analyzed through the database Ecoinvent v.3.01, and modeled and processed in the software LCA-Data Manager. The results showed that in plants PLA-CA and PLA-PO, the flocculation process has the highest environmental load, which is mostly attributable to the coagulant agent, with a range between 47-73% of the total impact. In plants PLA-TON and PLA-BOS, electricity consumption was identified as the greatest impact source, with percentages ranging from 67 to 85%. Treatment processes and techniques, bioclimatic conditions and culturally driven consumption behavior varied from region to region. Furthermore, changes in treatment processes and techniques are likely to affect the environment during all stages of a plant’s operational cycle.
Rev. Ambient. Água vol. 11 n. 2 Taubaté – Apr. / Jun. 2016
Avaliação do ciclo de vida de quatro estações de tratamento de água
potável localizado no nordeste da Colômbia
RESUMO
Atualmente, existe uma grande preocupação com os processos que direta ou indiretamente contribuem para as alterações climáticas, destruição da camada de ozônio ou acidificação, entre outros impactos ambientais. Neste contexto, e desde que a água tratada constitui um serviço público básico em centros urbanos de todo o mundo e em algumas áreas rurais, o impacto de suas emissões no meio ambiente tem sido considerado de grande interesse. Assim, na pesquisa atual foi aplicada a metodologia ambiental de avaliação do ciclo da vida (LCA) para avaliar os impactos ambientais de quatro estações de tratamento de água potável (PWTPs), localizadas no nordeste da Colômbia seguindo diretrizes internacionais da ISO 14040. As diferentes etapas do processo de purificação a partir do ponto de captação por meio de bombeamento para a rede de distribuição foram completamente avaliadas. A unidade funcional foi definida como 1 m3 de água potável produzida na fábrica. Os dados foram analisados com base no banco de dados Ecoinvent v.3.01 e processados no software LCAData Manager. Os resultados possibilitaram determinar que em plantas PLACA e PLA -POR, o processo de floculação tem a maior carga ambiental, o que é principalmente atribuível ao agente coagulante, com uma percentagem entre 47 e 73% do impacto total. Em plantas PLA-TON e PLA-BOS, o consumo de energia eléctrica foi identificado como sendo a maior fonte de impacto, com percentagens que variam de 67 a 85%. Os processos e técnicas de tratamento, condições bioclimáticas e comportamento de consumo culturalmente impulsionado variam de região para região. Além disso, mudanças nos processos e técnicas de tratamento podem afetar o meio ambiente durante todos os estágios do ciclo de operação de uma planta.
Palavras-chave: água tratada, impacto ambiental, mudança climática.
1. INTRODUCTION
Beyond 2015, in order to fulfill the 7th objective of the Millennium Development Goals (MDGs) it will be necessary to both incorporate sustainable development principles into national policies and programs and to reduce the loss of environmental resources (United Nations, 2012).
For this purpose, it has been estimated that Colombia needs to invest approximately 4 billion dollars in order to improve unsatisfied basic needs in guaranteeing good drinking water service, which is vital to public health and human life (UNICEF, 2006). The same study revealed that, of 1027 Columbian municipalities, 70% had Potable Water Treatment Plants (PWTPs) in urban areas and 20% in rural areas.
These PWTPs are typically supplied by surface waters (mainly rivers) and utilize gravity, pumping and/or mixed systems to move the water from the catchment point, where the first stage of the drinking water process occurs. Subsequently, a series of conventional methods are applied, consisting of a more or less standardized sequence of physicochemical and, sometimes, biological treatment processes which vary depending on the quality of the water that enters the plant (Stackelberg et al., 2007). These processes require energy and chemical supplies in order to guarantee an adequate product for human consumption (Friedrich 2002).
Rev. Ambient. Água vol. 11 n. 2 Taubaté – Apr. / Jun. 2016
improving environmental indicators throughout the entire water management life cycle (Vince et al., 2008; Amores et al., 2013), and at obtaining cleaner and more sustainable processes in order to provide a better quality of life for the consumer of the final product (El-Sayed Mohamed et al., 2010).
Environmental methodologies such as Life Cycle Assessment (LCA), which follows ISO 14040 guidelines (ISO, 2006), allow assessing the environmental loads generated by a process and/or product during its life cycle, with the aim of reducing environmental loads, thereby improving sustainability indicators.
The scientific literature on water science and technology includes important international studies which have applied LCA during the last five years. These studies have increasingly gained more attention as they have been applied to the processes of potable water treatment plants in developed and developing countries (Kulay et al., 2015; Ahmadi and Tiruta-Barna 2015; Bonton et. al., 2012; Hyunju et al., 2015; Igos et al., 2013; Meneses et al., 2010; Pasqualino et al., 2011; Ribera et al., 2014).
During this decade in Latin America, countries such as Argentina, Brazil, Colombia and Mexico have been making progress in the application and capacity building of LCA in different economic sectors. Although this application has included both private companies and governments, it must still develop specifically targeted programs as well as financial support and technical assistance, in order that it may become a fundamental policy and, as such, the cornerstone of any industrial process (Güereca et al., 2015; Swarr et al., 2015).
The current research therefore constitutes one of the first applications of LCA to PWTPs in Colombia. As such, it represents a significant contribution to the domain of water science and technology in fostering the use of LCA in developing countries, using a combination of promotion among both natural science and engineering experts. In this context, the main objective of the present research was to apply LCA to four PWTPs located in northeastern Colombia and, based upon the results, propose strategies that allow mitigating the environmental impact of the potable water processes currently used in these PWTPs.
2. METHODOLOGY
The LCA methodology consists of four stages (Ortiz-R et al., 2014): 2.1. Objective definition and scope
This stage defines the limits of the system and the level of detail of the study. The four studied PWTPs are located in northeastern Colombia and deliver potable water to approximately 4 million inhabitants. These plants were selected from the municipal development plans. They are located in different cities and each one draws water from different catchment points. Due to confidentiality concerns, the PWTPs are labeled hereafter as plant PLA-CA, PLA-POR, PLA-TON and PLA-BOS, respectively. Each plant was analyzed in terms of the different stages of the drinking water process, (e.g. catchment point, de-sanding, coagulation, flocculation, sedimentation, filtration, disinfection, storage before the distribution network). A general scheme of the four PWTPs is shown in Figure 1.
For example, PLA-CA (i) has a pretreatment process meanwhile PLA-POR (ii), PLA-TON (iii) and PLA-BOS (iv) complete the flocculation process by using hydraulic and
mechanical systems. For all cases, the water source was surface water with levels of turbidity equal to 6.58 NTU (Nephelometric Turbidity Unit), Dissolved Oxygen (DO) 4.8 mg L-1, pH 7.67, BOD 5 2.38 mg L-1, COD 4,34 mg L-1, uncountable bacteriological pollution. All values were considered according to the Colombian national standard (Colombia, 2000).
Rev. Ambient. Água vol. 11 n. 2 Taubaté – Apr. / Jun. 2016
produced at the plant”.
Figure 1. System boundaries of the process at the PWTPs studied.
The following assumptions were considered:
• Electric power generation corresponds to an energetic mix of 78% hydro-electrical plants, 7% carbon, 12% gas and 3% other sources, adapted from Ortiz-R and García-Cáceres (2013).
• Environmental loads due to the maintenance of the sedimentation zone have been calculated using sodium hypochlorite and tap water.
• The infrastructure was assumed to last 50 years.
Transportation of coagulants and other reagents was not considered. It was assumed that these raw materials are disposed of at the plant. Also, the distribution network has not been included in this research. The transportation and distribution phases will be included and discussed in future studies.
2.2. Inventory analysis
This stage developed an inventory of inputs and outputs of the water treatment system based not only on information regarding power consumption and chemical supplies required in the drinking water process, but on the equivalent contaminating factor as well. Both primary and secondary information sources were employed for this inventory.
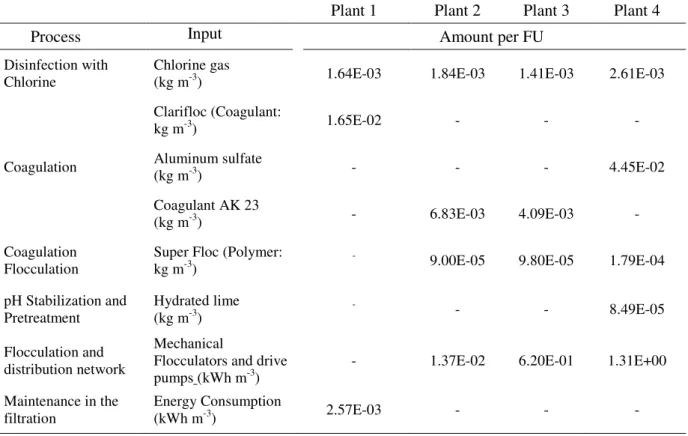
The primary source corresponded to data provided by the technical personnel of the studied plants, who collected information about the plants’ processes during an operational period of twelve (12) months, from January to December of 2014. The secondary source corresponded to the database Ecoinvent v3.01(Ecoinvent, 2013), which was intended to provide background generic data about the products and processes employed in the PWTPs. Table 1 shows the inventory of chemical supplies and energy flow at each of the studied plants.
2.3. Impact assessment
Rev. Ambient. Água vol. 11 n. 2 Taubaté – Apr. / Jun. 2016
methane, N2O and other greenhouse gas emissions were aggregated into CO2 equivalent
emissions in accordance with their respective global warming potential).
Table 1. Inventory of the four PWTPs expressed in the functional unit (FU) “1 m3 of drinking water
produced at the plant.
Plant 1 Plant 2 Plant 3 Plant 4
Process Input Amount per FU
Disinfection with
Chlorine Chlorine gas (kg m-3) 1.64E-03 1.84E-03 1.41E-03 2.61E-03
Coagulation
Clarifloc (Coagulant:
kg m-3) 1.65E-02 - - -
Aluminum sulfate
(kg m-3) - - - 4.45E-02
Coagulant AK 23
(kg m-3) - 6.83E-03 4.09E-03 -
Coagulation
Flocculation Super Floc (Polymer: kg m-3) - 9.00E-05 9.80E-05 1.79E-04
pH Stabilization and
Pretreatment Hydrated lime (kg m-3) - - - 8.49E-05
Flocculation and distribution network
Mechanical
Flocculators and drive
pumps (kWh m-3) - 1.37E-02 6.20E-01 1.31E+00
Maintenance in the filtration
Energy Consumption
(kWh m-3) 2.57E-03 - - -
In the present research, Global Warming Potential (GWP) (kg CO2-Eq) was chosen as
the main environmental impact because of its worldwide effect, which makes it the greatest environmental challenge presently facing the sustainable water management of the world (Russo et al., 2014). Some other environmental impacts corresponded to acidification (kg SO2-Eq), and stratospheric ozone depletion (SOD/kgCFC-11-Eq). Finally, the software
LCA-Data Manager® (an environmental management tool developed by SIMPPLE S.L.) was used to create and modify the scenarios under study as well as to develop the material balances and the inventory (SIMPPLE SL, 2013).
2.4. Interpretation of results
The last stage is the interpretation of the results, not only in terms of environmental load assessment, but also through the generation of alternative proposals for mitigating the environmental impacts associated with the process (Ortiz-R et al., 2010).
3. RESULTS AND DISCUSSION
Table 2 presents the overall results obtained by applying the environmental impact indicators to the four studied plants. The results show a similar order of magnitude to those reported by Amores et al., (2013) and Ribera et al. (2014) in terms of the application of aluminum sulfate and chlorine gas to the drinking water process. It can also be observed that PLA-BOS has the highest impact of all of the environmental impacts studied. With respect to GWP, this plant emitted indirect emissions of 3.83E-01 kg CO2-Eq, of which 86%
Rev. Ambient. Água vol. 11 n. 2 Taubaté – Apr. / Jun. 2016
volumes forced by the use of the chemical agents required for the flocculation and disinfection processes. Contrastingly, the plant that emitted the least emissions was PLA-TON, with 1.39E-02 kg CO2-Eq, resulting from low energy consumption and from the
particular nature of the treated hydric source. In effect, water in this case only needs to travel a short distance from its source to the catchment point, thus accounting for the low potable water chemical agent requirements of this plant.
Table 2. Results of the environmental impact assessments of the four potable water treatment plants.
Environmental Indicator PLA-CA PLA-TON PLA-POR PLA-BOS
Abiotic resource depletion (kg Antimony eq) 1.39E-04 8.06E-05 6.11E-04 1.46E-03 Acidification potential (kg SO2 eq) 2.28E-04 1.12E-04 5.90E-04 1.48E-03
Eutrophication (kg PO4 eq) 5.03E-05 3.16E-05 1.93E-04 5.05E-04
Global warming potential (kg CO2 eq) 2.21E-02 1.39E-02 1.73E-01 3.83E-01
Stratospheric ozone depletion (kg CFC-11 eq) 4.14E-09 3.22E-09 9.56E-09 2.23E-08 Human Toxicity (kg 1,4-DCB eq) 8.04E-03 4.72E-03 4.31E-02 9.81E-02
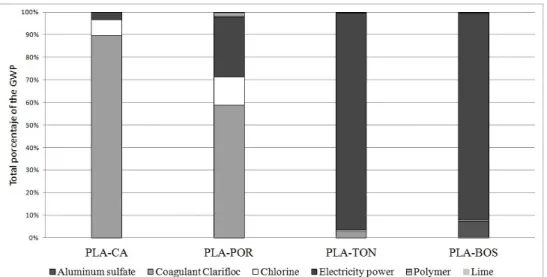
Previous results show that in PLA-CA and PLA-TON the highest impact was due to the use of the coagulant agent, respectively accounting for 82% and 46% of the total impact of each of these plants. The second greatest impact in these plants was caused by chlorine gas, which is employed in the disinfection process, with total emission percentages of 13% and 21% for CA and POR, respectively. Energy consumption contributed 4% in PLA-CA, resulting from processes like pumping, flocculation and filter re-washing (locally named retrolavado). In PLA-POR, power consumption accounted for 30% of total emissions, while 3% was attributed to a polymer employed as coagulation coadjutant. Regarding PLA-TON, the greatest impact was due to energy consumption, since the plant uses a water suction supply system. This was also the case with PLA-BOS, where the use of monitoring systems, flocculation, engines (moto-redactors), compressors for the pneumatic gates system, and electric drive pumps was found to emit 2.83E-01 kg CO2 eq., all of which makes up 92% of
the total emissions relating to GWP. Such an elevated percentage results from the need to move large volumes of water and the unfavorable location of the plant with respect to the population it services. The emissions of both PLA-TON and PLA-BOS are less intense due to the application of coagulant substances such as AK23 and aluminum sulfate, which respectively accounted for 1% and 7% of total emissions (Figure 2).
Rev. Ambient. Água vol. 11 n. 2 Taubaté – Apr. / Jun. 2016
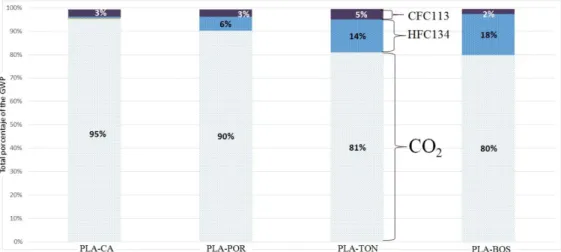
Regarding the environmental impact of GWP, CO2 emissions resulting from fossil fuel
combustion cause the greatest impact on the atmosphere. Ethane (HFC) accounted for 3 to 18% of total GEGs (Greenhouse Effect Gases) (Figure 3).
Figure 3. Total of GEG percentages based on 1 m3 of drinking water produced at the
plant.
The compared effects of the studied plants across environmental impacts shows a basic trend, according to which BOS has the greatest impact, followed by CA and PLA-TON, while the smallest impact corresponds to PLA-POR. However, in the case of ozone layer depletion, the latter three plants exhibit close values.
The largest environmental impact due to contaminant additives corresponded to the use of chlorine gas in PLA-CA and PLA-POR, with 79% and 89% of the overall impact, respectively. The second largest impact was caused by the coagulant agent Clarifloc, which was applied in PLA-CA and accounted for 21% of the overall impact, and by the coagulant agent AK23, used in PLA-POR, where it generated 9% of said impact.
In PLA-CA, the largest impact was caused by Clarifloc (82%), followed by chlorine gas (13%) and energy consumption (4%). In PLA-POR, the largest impact corresponded to AK23 (46%), followed by electricity consumption (30%), chlorine gas (21%) and polymer addition (3%). Contrastingly, the most outstanding impact in PLA-BOS was electricity consumption, with 92%, followed by aluminum sulfate (7%) and chorine gas (0.18%). Finally, energy consumption also dominated in PLA-TON, with 74%, contrasting with the low counts registered by the other environmental impacts.
These indicators reveal that there are processes and energy flows in each of these plants that have indirectly adverse environmental effects. For this reason, the companies involved in the sustainability of the drinking water service should ideally reduce these environmental loads during the entire process.
For example, the use of Clarifloc can be reduced by applying coadjutants or other coagulant agents. Also, the preservation of the hydric source that supplies the treatment plant is an important factor, since its deterioration contaminates the water that is to be treated. This contamination involves color, turbidity and suspended material, all of which directly affect the amounts of coagulant that are needed to purify the water. The best scenario might be reached by analyzing the viability of a pretreatment process intended to improve the physicochemical characteristics of the water that enters the plant, thus reducing the need for coagulant.
Rev. Ambient. Água vol. 11 n. 2 Taubaté – Apr. / Jun. 2016
eliminate all pathogens. This is likely to reduce the application of chlorine to the residual dose stipulated by the corresponding Colombian normative system through Resolution 2115 of 2007. Yet this alternative also has disadvantages, since it requires higher investments and power consumption during the process of membrane filtration (Villamizar et al., 2015).
In those PWTPs producing unfavorable impacts due to the use of the coagulant agent, environmental loads can be reduced by 5-20% by analyzing the necessary dose. For example, pilot tests can be conducted to assess the efficiency of the coagulant as compared to that of other substances with weaker environmental impact. It is also possible to reduce the use of coagulant by introducing flocculation coadjutants with better performance than the polymers currently employed. The effect of increasing the polymer dose in order to reduce the necessary amount of coagulant may also be studied.
Finally, regarding elevated power consumption due either to water transport over long distances (from the catchment point to the plant, from the plant to the distribution network, or from any point to altitudes above 200 m from where the plant is located) or processes such as flocculation, more efficient energy alternatives must be considered.
4. CONCLUSIONS
In this study, we applied LCA to four PWTPs located in northeastern Colombia. In conclusion, it can be said that the use of Clarifloc can be reduced by applying coadjutants or other coagulant agents. Also, the preservation of the hydric source that supplies the treatment plant is an important factor, since its deterioration contaminates the water that is to be treated. Treatment processes and techniques, bioclimatic conditions and culturally driven consumption behavior vary from region to region. Furthermore, changes in treatment processes and techniques are likely to affect the environment during all stages of a plant’s operational cycle. Therefore, any improvement is generally oriented to raw materials and energy use, always keeping in mind that a treatment plant must be both environmentally and socio-economically feasible. The different types of treatment techniques vary substantially depending on the geographic location of the plant.
Climate, technological, cultural and socio-economical differences clearly define a plant’s standards in any context and region. However, the function is always the same: providing good water quality for the people it serves. To a great extent, variations in results are due to the different conditions under which the process is conducted. One of the most important variables is the hydric source that supplies the plant, depending on the particular supply types and amounts may be used in the potable water process.
5. ACKNOWLEDGMENTS
To the Colombian Administrative Department of Science, Technology and Innovation – COLCIENCIAS reference project #112156934429. The first author would also like to thank the partial financial support from the internal open call 2015 of the Universidad de Pamplona.
6. REFERENCES
Rev. Ambient. Água vol. 11 n. 2 Taubaté – Apr. / Jun. 2016
AMORES, M. J.; MENESES, M.; PASQUALINO, J.; ANTÓN, A.; CASTELLS, F. Environmental assessment of urban water cycle on Mediterranean conditions by LCA approach. Journal of Cleaner Production, v. 43, p. 84-92, 2013. http://dx.doi.org/10.1016/j.jclepro.2012.12.033
BONTON, A.; BOUCHARD, C.; BARBEAU, B.; JEDRZEJAK, S. Comparative life cycle assessment of water treatment plants. Desalination, v. 284, p. 42-54. 2012. http://dx.doi.org/10.1016/j.desal.2011.08.035
COLOMBIA. Ministerio de Vivienda. Reglamento técnico del sector de agua potable y saneamiento básico: título C sistemas de potabilización. Bogotá, 2000. Available in: http://www.minvivienda.gov.co/Documents/ViceministerioAgua/Titulo%20C%20-%20Dic%204%202013.pdf. Access: mar. 2016.
DE SOUZA, J. B.; QUEIROZ, F.; JERANOSKI, R.; DE SOUSA, C.; SOARES G. Water and wastewater disinfection with peracetic acid and uv radiation and using advanced oxidative process PAA/UV. International Journal of Photoenergy, v. 2015, 2015. http://dx.doi.org/10.1155/2015/860845
ECOINVENT CENTRE. Ecoinvent Data v 3.01. St. Gallen: Swiss Centre for Life Cycle Inventories, 2013.
EL-SAYED MOHAMED, M.; VAN DER STEEN N. P.; ABU-ZEID, K.; VAIRAVAMOORTHY, K. Towards sustainability in urban water: a life cycle analysis of the urban water system of Alexandria City, Egypt. Journal of Cleaner Production, v. 18, n. 10–11, p. 1100–1106, 2010. http://dx.doi.org/10.1016/j.jclepro.2010.02.009 FRIEDRICH, E. Life-cycle assessment as an environmental management tool in the
production of potable water. Water Science Technology, v. 46, n. 9, p. 29-36, 2012. GUINÉE, J. B. E. Handbook on life cycle assessment: operational guide to the ISO
Standards. Dordrecht: Kluwer Academic Publishers, 2002.
GÜERECA, L. P.; OCHOA, R.; GILBERT, H. E.; SUPPEN, N. Life cycle assessment in Mexico: overview of development and implementation. The International Journal of Life Cycle Assessment, v. 20, n. 3, p. 311-317, 2015. http://dx.doi.org/10.1007/s11367-014-0844-9
HYUNJU, J.; ELIZABETH, M.; JOHN, C. C. Life cycle assessment of the City of Atlanta, Georgia's centralized water system. International Journal of Life Cycle Assessment, v. 20, n. 6, p. 880-891, 2015. http://dx.doi.org/10.1007/s11367-015-0874-y
IGOS, E.; BENETTO, E.; BAUDIN, I.; TIRUTA-BARNA, L.; MERY, Y.; ARBAULT, D. Cost-performance indicator for comparative environmental assessment of water treatment plants. Science of the Total Environment, v. 443, p. 367–374, 2013. http://dx.doi.org/10.1016/j.scitotenv.2012.11.010
INTERNATIONAL ORGANIZATION FOR STANDARDIZATION - ISO. ISO 14040: environmental management – life cycle assessment principles and framework. Geneva, 2006.
Rev. Ambient. Água vol. 11 n. 2 Taubaté – Apr. / Jun. 2016
sistemas para fornecimento de água quente para uso doméstico. Revista Ambiente & Água, v. 10, n. 2, p. 386-401, 2015. http://dx.doi.org/10.4136/ambi-agua.1364
MENESES, M.; PASQUALINO, J. C.; CASTELLS, F. Environmental assessment of urban wastewater reuse: Treatment alternatives and applications. Chemosphere, v. 81, n. 2, p. 266-272, 2010. http://dx.doi.org/10.1016/j.chemosphere.2010.05.053
MERY, Y.; TIRUTA-BARNA, L.; BENETTO, E.; BAUDIN I. An integrated "process modelling-life cycle assessment" tool for the assessment and design of water treatment processes. International Journal of Life Cycle Assessment, v. 18, n. 5, p. 1062-1070, 2013. http://dx.doi.org/10. 1007/s11367-012-0541-5
ORTIZ-R, O. O.; CASTELLS, F.; SONNEMANN, G. Sustainability assessment within the residential building sector: a practical life cycle method applied in a developed and a developing country. Saarbrücken: VDM Publishing, 2010.
ORTIZ-R, O. O.; GARCÍA-CÁCERES, R. G. Assessing sustainability within the construction industry by means of a composite indicator. Dyna, v. 80, n. 182, p. 15-24, 2013.
ORTIZ-R, O. O.; VILLAMIZAR, R.A.; RANGEL, J.M. Applying life cycle management of colombian cocoa production. Food Science and Technology, v. 34, n. 1, p. 62-68, 2014. http://dx.doi.org/10.1590/S0101-20612014005000006
PASQUALINO, J. C.; MENESES, M.; CASTELLS, F. Life cycle assessment of urban wastewater reclamation and reuse alternatives. Journal of Industrial Ecology, v. 15, n. 1, p. 49-63, 2011. http://dx.doi.org/10.1111/j.1530-9290.2010.00293.x
RIBERA, G.; CLARENS, F.; MARTÍNEZ-LLADÓ, X.; JUBANY, I.; MARTÍ, V.; ROVIRA, M. Life cycle and human health risk assessments as tools for decision making in the design and implementation of nanofiltration in drinking water treatment plants. Science of the Total Environment, v. 466–467, p. 377–386, 2014. http://dx.doi.org/10.1016/j.scitotenv.2013.06.085
RIBERA G.; CLARENS F.; MARTÍNEZ-LLADÓ X.; JUBANY I.; MARTÍ, V.; ROVIRA M. Life cycle and human health risk assessments as tools for decision making in the design and implementation of nanofiltration in drinking water treatment plants. Science of the Total Environment, v. 466, p. 377-386, 2014. http://dx.doi.org/10.1016/j.scitotenv.2013.06.085
RUSSO, T.; ALFREDO, K.; FISHE, J. Sustainable water management in urban, agricultural, and natural systems. Water, v. 6, n. 12, p. 3934-3956, 2014. http://dx.doi.org/10.3390/w6123934
SHON, H. K.; PHUNTSHO, S.; CHAUDHARY D. S.; VIGNESWARAN, S.; CHO, J. Nanofiltration for water and wastewater treatment – a mini review. Drinking Water Engineering Science, v. 6, p. 47–53, 2013. http://dx.doi.org/10.5194/dwes-6-47-2013 STACKELBERG, P. E.; GIBS, J.; FURLONG, E. T.; MEYER, M. T.; ZAUGG, S. D.;
LIPPINCOTT, R. L. Efficiency of conventional drinking-water-treatment processes in removal of pharmaceuticals and other organic compounds. Science of the Total
Environment, v. 377, p. 255-272, 2007.
Rev. Ambient. Água vol. 11 n. 2 Taubaté – Apr. / Jun. 2016
SWARR, T. E.; ASSELIN A. C.; MILÀ, I.; CANALS, L.; DATTA, A.; FISHER, A. et al. Building organizational capability for life cycle management. In: KLÖPFFER, W.; CURRAN, N. A. (Eds.). LCA compendium – the complete world of Life Cycle Assessment. Chapter 17. Cham: Springer, 2015. p. 239-256. http://dx.doi.org/10.1007/s11367-016-1041-9
UNITED NATIONS. Millennium development goals (Mdgs). New York, 2012.
UNITED NATIONS CHILDREN'S FUND – UNICEF. La infancia, el agua y el saneamiento básico en los planes de desarrollo departamentales y municipales: la planeación local, una oportunidad para que los niños, las niñas y los adolescentes del país tengan un medio ambiente adecuado para su desarrollo. Bogotá, 2006. 162 p. VILLAMIZAR, R. A.; ORTÍZ, O. O.; AQUILES-DARGHAN, E. Quick and easy
methodology to determine somatic coliphages as indicators of fecal contamination in a water treatment plant located in northeastern Colombia. Universidad y Salud, v. 17, n. 1, p. 57-68. 2015.
VINCE, F.; AOUSTIN, E.; BRÉANT, P.; MARECHAL, F. LCA tool for the environmental evaluation of potable water production. Desalination, v. 220, n. 1–3, p. 37–56, 2008. http://dx.doi.org/10.1016/j.desal.2007.01.021