Article
Printed in Brazil - ©2018 Sociedade Brasileira de Química*e-mail: tatiana@ufg.br
#Current address: Instituto Federal de Educação, Ciência e Tecnologia de Goiás, Campus Morrinhos, P.O. Box 92, 75650-000 Morrinhos-GO, Brazil §Current address: Universidade Federal do Tocantins, Campus Gurupi, P.O. Box 66, 77410-530 Gurupi-TO, Brazil
Photoluminescence
of
Solvent-Selected
Fluorescent
Moieties
in
MEH-PPV
Solutions
and
Films
AntonioC.C.Ribeiro,a,#HenriqueS.Camargo,aDouglasH.Pereira,b,§
RogérioCustódiobandTatianaD.Martins*,a
aInstituto de Química, Universidade Federal de Goiás, Campus II - Samambaia, P.O. Box 24242, 74690-970 Goiânia-GO, Brazil
bInstituto de Química, Universidade Estadual de Campinas, P.O. Box 6154, 13083-970 Campinas-SP, Brazil
In this work, we examined how photoluminescence in poly[2-methoxy-5-(2-ethylhexyloxy)-1,4-phenylenevinylene] (MEH-PPV) is affected by morphology, dictated by the mode of preparation. For that, MEH-PPV dilute solutions in good and non-solvents, thick cast films with poly[methylmethacrylate] (PMMA) as inert matrix and spin-coated thin films were prepared. These systems were studied by steady-state and time-dependent fluorescence spectroscopy and electronic microscopy. Unexpected photoluminescent behavior was detected in solutions and films and it was related to different excitons modulated by MEH-PPV conformation. By semi empirical calculations we obtained the singlet and triplet state energies of an MEH-PPV model system and, from time-resolved fluorescence spectroscopy, the existence of short-lived excited states was revealed, enabling us to infer on possible singlet fission in MEH-PPV-based systems.
Keywords: photoluminescence, morphology, thin films, time-resolved fluorescence,
computational calculations
Introduction
Since poly(phenylene-vinylene) (PPV) derivatives were found to be electroluminescent,1 the search for a systematic
method to determine their applications has been of great interest. Their mechanical, morphological and optical properties have been widely discussed and findings related these properties to preparation methods. Although there are many aspects regarding the effects of preparation methods on optical response, authors seem to agree that preparation method influences molecular conformation, enabling or inhibiting aggregation and, consequently, affecting inter and intrachain interactions. Processing parameters are believed to modify the conformation and assembling mechanisms of polymeric materials, resulting in a memory effect of the structural information that is replicated from solutions to solid films. Therefore, to understand the role
of chain conformation in solution is of major importance for applications such as device fabrication, since properties can be tuned, enhancing the desired characteristics and suppressing the undesired ones.2,3
For instance, it is well known that photoluminescence of PPV derivatives show prominent red-shift due to the enhancement of energy transfer as the π-electron delocalization increases.4 As pointed out in an earlier
work,5 this red-shift indicates aggregation driven by π-π
interactions as the conjugation length increases.
In polymeric systems, several occurrences are responsible for chain torsions that impose limits to the length of conjugated segments, affecting the highest occupied molecular orbital (HOMO)-lowest unoccupied molecular orbital (LUMO) energy gaps. They are interpreted as stabilization and/or destabilization of HOMO and LUMO levels.6 These occurrences may be related to the presence
of impurities, molecules of solvent that strongly interact with the polymer chains and a distribution of torsion angles promoted by molecular interactions of any nature.6 In this
of segment lengths and are characteristic of determined systems, composed by a polymer and the solvent, which interacts with the polymeric chains, imposing torsions restrictions through its general and specific properties.7
Also, electrostatic and π-stacking interactions are responsible for aggregation in conjugated polymers. In a competition between these interactions, intrachain and interchain aggregates are formed, each presenting a distinct density of states and, therefore, distinct allowed electronic transitions. Also, the surroundings influence the spectral region from which luminescence of conjugated polymers is observed. As stated by Köhler et al.,8 in some
conjugated polymers, including PPV derivatives, this change in photoluminescence region is due to distinct electronic coupling between molecular units. Specifically in poly-(2-methoxy-5-(2’-ethylhexyl)oxy 1,4-phenylene vinylene) (MEH-PPV), there is a bimodal distribution of emission maxima.9-11 Also, they assigned the two main
observed emission regions to two chain conformations, referred by them as “blue phase” and “red phase”. They showed that a transition may occur between phases, enabled by intrachain and interchain interactions, which results in more ordered structures. Emission of these structures would occur from the red phase, which is the lower energy state. If more disorder is added to the polymer, then, emission is observed from the blue phase, the higher energy state. Interestingly, Köhler and co-workers12 found that the
observed blue phase luminescence is related to a disorder that is a result of a variety of conjugation lengths determined by chain torsions.12 In their studies, the correlated energetic
disorder of the blue phase emission is due to conjugation lengths of 4.5-5.5 repeat units in absorption, determined by the geometry in the ground state, and 6.5-7.5 in emission, which is due to a spectral diffusion to lower energy emitting entities.8 In this perspective, choosing between a good
solvent and a bad solvent, distinct aggregates are formed, the disorder is affected and, thus, the photoluminescent behavior changes.
As stated by Spano and Silva,13 there are two main
types of aggregates in conjugated polymers, which can be either J-aggregates or H-aggregates, as defined by Kasha.14
For them, J-aggregates are responsible for a red-shift in the absorption spectrum. They are formed by polymeric chains aggregation following a head-to-tail configuration, which enables a more efficient intrachain interaction. The H-aggregates are interchain aggregates with polymeric chains oriented side-by-side, resulting in a spectral blue-shift. They also stated that, in solution, spectral broadening is due to variations in the conjugation length caused by distinct local polarization, since polymeric chains are differently solvated in distinct solvents. These interactions
also influence the excited states stability, and they observed that the excited-state lifetime is enhanced in J-aggregates and shortened in H-aggregates.13 In accordance with
these findings, Köhler et al.8 also affirm that these distinct
conjugation lengths are, at some degree, a result of chain torsions that lead to disorder.
Although conformational issues are closely related to the photophysical behavior of PPV derivatives, some electronic and energetic aspects are also governing their luminescence efficiency.
Many are the theories that base a discussion on solvent selection for fluorescent moieties of MEH-PPV, relating its several singlet electronic excited states to effects involving energy migration even to triplet states.15-21
Fluorescence lifetime measurements are useful, among other applications, to identify a single or multiple emitting species in a solid sample or in liquid solution. Bi-exponential decay curves usually indicate the occurrence of faster decays along with slower ones, which suggest the contribution of some non-radiative deactivation processes. Some works22-24 relate bi or multi-exponential decays to
interchain exciton formation in PPV derivatives, favored under high energy excitation conditions. It is expected that, at higher excitation densities (greater than 1018 cm-3,
as proposed by Dogariu et al.),22 bimolecular decays
result from distinct aggregates, which can be selectively excited. Their origin can be dipole-dipole interaction, excitation diffusion or quantum delocalization, since Förster energy transfer is not expected to be effective at such intermolecular distances.22
Although MEH-PPV generates several types of aggregates, especially in the film form, it can also present isolated chain segments with distinct fluorescence, contributing to the total emission observed. In this regard, some aspects of polymeric systems preparation must be taken into account: aggregated chains are always present in bulk films and they have distinct effects on the luminescence; dilute solutions present to some extent, isolated chains, which are numerous in even more dilute solutions, and small amounts of isolated chains are found embedded in an inert matrix. An intermediate situation containing a mixture of undefined proportions of all the aforementioned species at distinct quantities is possible, and would be similar to the situation of having aggregates with a distribution of conjugation lengths in the system.25 Theoretical calculations
affects the precision of results; nevertheless, this precision must be evaluated considering computational costs and the size of system in study.26-34
In this contribution, we studied the photoluminescence of MEH-PPV in solution prepared in a variety of good and non-solvents, as well as thin films and solid solutions. Steady-state and time-resolved fluorescence spectroscopy were used to determine the total photoluminescence as a sum of contributions from several fluorescent moieties present in such systems. Fluorescence, confocal and transmission electronic microscopy were used to determine the micromorphology of these systems. Theoretical calculations of the optimal geometry of MEH-PPV in vacuum, in the presence of solvent molecules and continuum representation of the solvent reaction field, were performed by AM1 (Austin model 1) method. MEH-PPV singlet and triplet excited states energies were determined by ZINDO/S (Zerner’s intermediate neglect of differential overlap) method. With these combined tools, distinct emitting species in MEH-PPV-based systems were distinguished, enabling us to infer about the dependence of the total optical response with the fluorescent moiety identity, and the role of sample preparation on its modulation.
Experimental
Sample preparation
Solution preparation
MEH-PPV of Mw (weight-average molecular weight) = 125 kDa, Mw/Mn (number-average molecular weight) = 5 purchased from Sigma-Aldrich was used as received. It was dissolved in acetic acid (AcOH), chloroform (CHCl3),
dichloromethane (DCM), tetra-hydro-furan (THF), acetonitrile (MeCN), methanol (MeOH) and ethanol (EtOH). All spectroscopic grade solvents were purchased from Tedia, exclusion to ChCl3, which was purchased from
Sigma-Aldrich, and used to prepare polymeric solutions at 10-4 mol L-1 concentration that was further diluted to
10-6-10-8 mol L-1 concentration range, in terms of repeat
units. Solutions prepared with non-solvents were sonicated for 30 min in a 40 °C bath. Non-dissolved polymer masses were separated, dried and weighted to accurately determine the final concentration of each solution. All solutions were purged with N2(g) flow for 14 min for deoxygenate the samples,
sealed and kept under refrigeration and protected from light. Figure 1 shows the chemical structure of MEH-PPV.
Cast films preparation
Polymeric blends of poly(methyl-methacrylate) (PMMA), 98% pure, Mw = 15 kDa, purchased from
Sigma-Aldrich, and MEH-PPV were prepared by dissolution of the polymer matrix in the same solvent in which MEH-PPV solutions were prepared. The matrices were then doped with a volume of the previous MEH-PPV solutions to achieve a homogeneous mixture in the proportion of 0.03 to 0.1% m/m in distinct solvents. Each mixture was deposited over silanized glass dishes and placed in an oven with dynamic vacuum for 72 h at 40 °C to complete removal of solvents.
Spin-coating films preparation
200 µL of 10-7 mol L-1 MEH-PPV solutions were
spin-coated in quartz substrates by a SCS Spincoat G3 P-8 (Specialty Coating Systems). Each solution was deposited by a two-steps spinning process, comprising of a first step of spinning at 2000 rpm for 20 s, followed by a second step at 800 rpm for another 30 s. Uniform, transparent thin films were obtained as a result.
Photophysical characterization
UV-Vis absorption spectra
UV-Vis absorption spectra were recorded in a PerkinElmer Lambda 45 UV/VIS scan spectrophotometer, equipped with deuterium and tungsten-halogen lamps. Spectra were recorded in the range of 200 to 750 nm.
Steady-state fluorescence spectroscopy
Steady-state excitation and fluorescence spectra were recorded in a Fluorolog 3-221 Horiba Jobin Yvon spectrophotometer, with a 450 W Xe arc-lamp, connected to a double monochromator and a sample holder adapted for solid samples, in which films were placed at a 45° right-angle with respect to the incident radiation. Emission was detected at 90° by a Hamamatsu photomultiplier, operating at the range of 250 to 850 nm. Narrow slits were employed to guarantee resolution of 0.50 nm in measurements. All liquid samples were purged with N2(g)
flow for 14 min to promote deoxygenation prior to spectra measurements.
Time-resolved emission spectroscopy (TRES)
TRES experiments were performed in a CD-920 time-correlated single photon counting (TCSPC) spectrophotometer from Edinburgh Instruments, operating with a picosecond pulsed LED (light emitting diode), model EPLED-360, with pulse width of 843.6 ps and bandwidth of 13 nm, emitting at 366.8 nm and with distinct, picosecond pulsed diode lasers, also from Edinburgh Instruments. Diode lasers used were models EPL 445, with pulse width of 65.9 ps, emitting at 444.0 nm, and EPL 485, emitting at 482.6 nm, with pulse width of 96.2 ps. They were used to register fluorescence lifetimes in a range of wavelengths from 385 to 615 nm, with some variations due to excitation wavelength change. Samples were submitted to dynamic vacuum and sealed in quartz cuvettes. They were placed in the sample holder to register the fluorescence lifetimes. Data of the sample signal over the instrumental response were deconvoluted and analyzed by the exponential series method.35
Ludox® (Sigma-Aldrich) was used as scatterer. Experimental data correspond to expected theoretical values when χ2 is close to 1.
Morphological characterization
Epifluorescence microscopy
Epifluorescence micrographs of MEH-PPV embedded in PMMA inert matrix, the PMMA/MEH-PPV blends, were recorded by a Leica Dm IRB inverted microscope, with an HBO 100 W lamp and excitation filters of 330-380 nm and 450-500 nm. Fluorescence images were recorded by an SDC-311 ND Samsung camera and analyzed by the Linksys v.2.38 software. Objectives of 2.5, 10, 20 and 50× were used to acquire images. Total zoom involved 10 fold increase from the digital camera. In order to visualize the PMMA matrix upon fluorescent excitation, it was doped with N,N’-bis(2-naphtalenyl)-N-N’-bis(phenylbenzidine)
(ADS), adding 200 µL of 1 × 10⁻⁵ mol L-1 of its solution in
chloroform to the PMMA solution.
Transmission electronic microscopy (TEM)
High resolution transmission electronic microscopy (HRTEM) was performed in samples produced by depositing a small volume of polymer solutions in distinct solvents over a membrane sample holder of 3 mm of diameter, covered by a 3 nm carbon layer and dried at 40 °C for 48 h. Micrographs were recorded by a JEOL 2100 microscope equipped with energy dispersive spectroscopy (EDS), at an accelerating voltage of 200 kV.
Confocal fluorescence microscopy
Micrographs were obtained in a Leica SP5 microscope,
using 488 nm as excitation wavelength. Images were obtained in xyz mode, with physical lengths of 310.0 µm for the x axis, 310.0 µm for the y axis and 0 µm for z axis, employing the objective N PLAN H 50.0 × 0.50 DRY. The smart gain was used to adjust the signal gain to 400 V and the laser line intensity was kept in a low range to protect the samples from bleaching. The emission bandwidth used was 504-682 nm.
Computational details
Calculations were performed using MEH-PPV trimer as model. Ground state geometry was optimized using the AM1 semi-empirical method and the results were characterized by vibrational frequencies. Hessian matrices were positive and well defined, confirming the obtained structures as energy minima. Implicit and explicit solvent effects were included in the optimization. Polarized continuum model (PCM) was used for implicit effects,36 and explicit effects were obtained by adding
four molecules of solvent around the MEH-PPV trimer to illustrate systems in ethanol and chloroform and two acetonitrile molecules to illustrate the system in acetonitrile. Single point calculations were performed in absorption studies by ZINDO/S semi-empirical method in the same conditions adopted for PCM implicit solvent model. For explicit solvent effects, it was performed in Gaussian 09 software.37
Results
Photophysical behavior
UV-Vis absorption spectra
From the electronic absorption spectra and the extinction coefficient of MEH-PPV (3 × 10⁴ mol-1 cm-1),38
concentrations of the polymeric solutions were in the 3.2 × 10⁻⁸ to 1.2 × 10⁻⁴ mol L-1 range. When in dilute
solution of good solvents such as Ch3Cl, DCM and THF,
MEH-PPV UV-Vis spectra (Figure 2) present a broad band centered at around 500 nm for most solvents. Nevertheless, when in non-solvents of larger dipole moment and dielectric constant, such as MeCN and EtOH, absorptions are blue-shifted and of low intensity. However, when in a protic solvent, such as AcOH, the polymer is poorly soluble, and a blue-shifted low intense absorption is detected, even though AcOH dielectric constant and dipole moment are similar to those of a good solvent, such as THF (Table 1).39 MEH-PPV
Steady-state fluorescence measurements
Solutions
In order to thoroughly investigate the photophysical behavior of MEH-PPV, considering the influence of environmental aspects, and describe the specific interactions between the polymer and solvent molecules, as well as interactions between polymer chains themselves, steady-state and time-resolved fluorescence spectroscopic investigations were performed. Figure 3 presents the steady-state excitation and fluorescence spectra obtained for MEH-PPV solutions in distinct solvents.
Excitation spectra of MEH-PPV dilute solutions (i.e., 10-7 mol L-1) in good solvents, such as THF, CHCl
3 and
DCM occur in similar regions, presenting their maximum at 496 nm, with a weaker peak at 330 nm, while their fluorescence spectra are very similar in shape, although
few nanometers red-shifted from THF to CHCl3. In
contrast, fluorescence and excitation spectra of solutions in non-solvents, such as AcOH and MeCN are similar to each other, but with a stronger blue-shift and low intensity, comparing to the spectra recorded for the latter solutions. They present the maximum excitation at 430 nm, with a shoulder at 360 nm and the maximum of fluorescence
at around 460 nm. In EtOH, MEH-PPV excitation and fluorescence spectra are even more blue-shifted, presenting the maximum excitation at 360 nm, with a shoulder at 330 nm. Its maximum of fluorescence is at 430 nm.
Films and solid solutions
To better understand the discrepancies of MEH-PPV fluorescence when in solution and film, blends of PMMA/MEH-PPV 0.03 to 0.1% m/m and 2.52 ± 0.14 µm thickness and spin-coated 180 ± 28 nm thin pure MEH-PPV films were prepared from dilute solutions in three distinct solvents: ethanol, acetonitrile and chloroform. The inert Table1. Physical properties of solvents used in this work39
Solvent Dielectric constant (ε) Dipole moment (µ) / D Refractive index (nD) Viscosity (η) / cP
MeCN 37.50 3.20 1.342 0.38
EtOH 22.40 1.70 1.359 1.08
AcOH 6.20 1.70 1.370 1.13
THF 7.60 1.75 1.404 0.55
DCM 9.10 1.80 1.421 0.44
CHCl3 4.80 1.10 1.446 0.57
Figure2. UV-Vis electronic absorption spectra of MEH-PPV solutions
in distinct solvent, at concentrations of 10-7 mol L-1.
Figure3. (a) Excitation and (b) fluorescence spectra of MEH-PPV
matrix of PMMA was chosen to prepare these solid solutions in a good solvent and a non-solvent, in order to promote distinct aggregation and therefore enable the investigation of the photophysical behavior of the blends produced under distinct preparation conditions. They were determined by steady-state and time-resolved fluorescence measurements.
Figure 4 presents the steady-state fluorescence spectra of thick PMMA/MEH-PPV blends and thin films of the same source solution. Fluorescence spectra of MEH-PPV films are blue-shifted with respect to the source dilute solutions, which is expected,2,4,40,41 since distinct aggregates
and non-aggregated chains are expected to be present in solution. Fluorescence spectra of thin films and blends originated from solutions of the same solvent show some spectral similarities. For instance, fluorescence spectra occur at the same spectral region and have similar shapes, i.e., fluorescence of thin film and blend prepared from ethanol solution is more blue-shifted, presenting its maximum at 390 nm and a low intense shoulder at 520 nm, whereas film and blend prepared from acetonitrile solution is still blue-shifted, with its maximum fluorescence at around 425 nm with a shoulder also in 520 nm, with very low intensity. Thin films present less intense spectra, which is expected due to their thickness, which prevent the identification of a second peak at 442 nm in the acetonitrile-based thin film, as evident in the spectrum of the blend. On the other hand, thin films originated from solutions in good solvents present some divergences in spectral shape with respect to the fluorescence spectra recorded for the correspondent blends, although they occur in similar spectral regions. For instance, blends produced from chloroform solutions presented fluorescence very similar in shape and in region of emission to that of the source solution (Figure 3b), with a maximum at 580 nm and a shoulder of low relative intensity at 635 nm, whereas the thin film presented the maximum of fluorescence also at 580 nm, but with a high intense shoulder at 529 nm and the low intense shoulder at 635 nm, corroborating with earlier studies.7,42
The overall spectrum, however, is at the same region of emission of the blend and the source solution.
Morphological characterization
TEM, epifluorescence and confocal microscopy
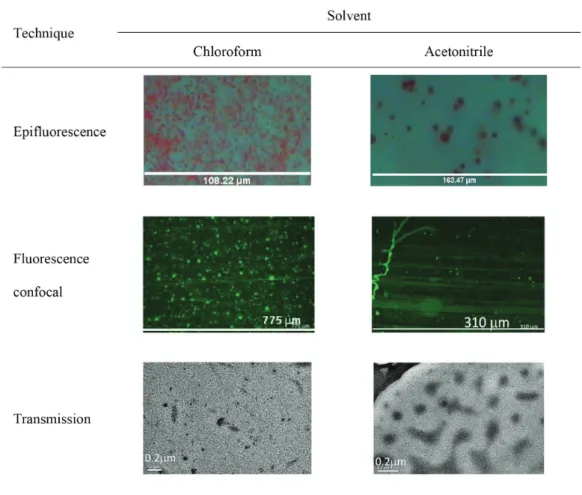
Figure 5 presents epifluorescence, fluorescence confocal and electronic transmission micrographs of PMMA/MEH-PPV cast blends from chloroform and acetonitrile solutions, a good solvent and a non-solvent for MEH-PPV polymer, respectively. Images were obtained to better understand the distribution pattern of MEH-PPV into PMMA matrix and to infer about their
miscibility. PMMA matrix was doped with a fluorescent dye, N,N’-bis(2-naphtalenyl)-N-N’-bis(phenylbenzidine).
In Figure 5, for any microscopy technique applied, smaller and better distributed MEH-PPV domains in PMMA matrix were observed in blends prepared from chloroform solution, in contrast with larger domains poorly distributed in blends produced from acetonitrile solution.
Time-dependent fluorescence measurements
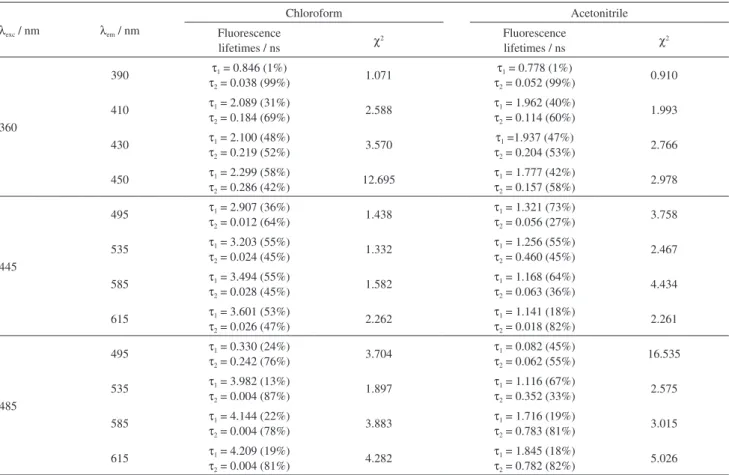
Fluorescence lifetimes were recorded for thin films produced from solutions of distinct solvents at several emission wavelengths, in an excitation-dependent TRES experiment. Data were recorded at the emission range from 385 to 615 nm, corresponding to the total MEH-PPV fluorescence spectral region. Excitations were performed at 360, 445 and 485 nm, the latter corresponding to the usual excitation wavelength for MEH-PPV, and the shorter wavelengths were chosen upon the absorption spectra of MEH-PPV solutions in acetonitrile. Table 2 shows a selection of the most illustrative data, from which behavior and changes, if they exist, are presented. TRES decay Figure4. Fluorescence spectra of (a) thick PMMA/MEH-PPV blends
curves and the time-resolved emission spectra are presented in Supplementary Information (see Figures S2 and S3). These data showed that, at any fluorescence wavelength, decay curves are better fitted by bi-exponential expressions. Tri-exponential fits were performed with no expressive changes on the resulting χ2. For a fact, MEH-PPV and
several other organic electroluminescent polymers present a fluorescence decay behavior that cannot be fitted by simple expression because they are composed of several emitting moieties, formed due to environmental conditions that influence morphological alterations. These alterations often lead to aggregation and, therefore, to segments of distinct conjugation lengths, each segment presenting a distinct dynamic behavior. If a narrow excitation source is used, some segments of very short fluorescence lifetime can be well distinguished, for instance, in Kersting et al. work,43
they found that there are several processes of deactivation occurring at the femtosecond timescale, which would only be assigned through a femtosencond laser as excitation source. Markov and Blom44 found the MEH-PPV lifetimes
as being tri-exponential decays, as well as to another PPV derivative, the poly[2-4-3J,7J
-dimethyloctyloxyphenyl-co-2-methoxy-5J,7J-dimethyloctyloxy-1,4-phenylene
vinylene] (NRS-PPV). In Yan et al. work,45 they found the
bi-exponential behavior as the more adequate fit for their data, as result of exciton diffusion and quenching defects. Nevertheless, when they performed the tail component subtraction from the data they found a multi-exponential behavior, with 5 to 6 lifetimes. They explained that behavior as being due to a slow exciton diffusion of long chain segments, occurring after the subpicosecond diffusion observed from shorter to longer segments, which occurs by Forster mechanism. In this work, we performed several data analyses, considering several models of interactions, to adopt those with physical meaning to our systems. The value of reduced χ2 is used to provide information on the
goodness-of-fit because it is related to random errors and if the standard deviations, which by Poisson statistics is the square root of the photon counts, its value is close to unity. Nevertheless, deviations due to random errors result in χ2
values that occur with probabilities that can be determined and are found in tables of reduced χ2 distribution. In TCSPC
measurements, not always the best reduced χ2 is obtained
for the best fit to the data. The best way to determine which Figure5. Epifluorescence micrographs obtained from thick MEH-PPV/PMMA blends; fluorescence confocal and transmission electron micrographs
are the parameters that effectively is describing the data is to examine the χ2 surfaces. For that, one parameter value
must be changed from that where que χ2 is a minimum
and execute the least square fit once again, keeping this parameter constant in that value. This gives a new χ2 that
must be reduced to an acceptable value to characterize that parameter value as consistent with the data. This change is repeated until the χ2 value exceeds the acceptable value,
which is evaluated by F-test. The confidence interval is given by fixing the parameter χ2 and comparing it to the
minimum χ2 value determined earlier. This results in a curve
(χ2/χ2 minimum) that shows a minimum, a parabolic curve.
If it is narrow, it evidences that the parameter is determined with good precision.46
For our data, although the reduced χ2 values obtained by
bi-exponential approach are not ideal, they are not improved when applying the tri-exponential expression. We obtained the reduced χ2 surfaces for our data to test their validity
and the goodness of the fit we preformed. Generally, the reduced χ2 surfaces of χ2/minimum χ2 versus lifetimes
obtained for bi-exponential were parabolic (statistical analyses were not shown), presenting a minimum, showing that the bi-exponential expression is adequate to describe
the behavior of our experimental data. On the other hand, the χ2/minimum χ2 versus lifetimes obtained for the
tri-exponential analysis did not show a minimum of the χ2
with lifetimes, informing that the tri-exponential approach does not describes the systems’ behavior. Therefore, their behavior is bi-exponential. This result is also corroborated by Di Paolo et al.47 findings, in which decays for
MEH-PPV trimer are either mono-exponential, bi-exponential or multi-exponential, depending on the emitting moieties that are accessed by selective excitation. Yet, the longer lifetimes they found corroborate our findings as well.
The two lifetimes determined at all excitation wavelengths correspond to a shorter and important lifetime in several decays, and another longer lifetime. Although most of the fluorescence decays are fitted by a bi-exponential function, the decays obtained with emissions monitored at 385 nm, when excitation is carried out at 360 nm, are mono-exponential, with a shorter lifetime of 40-50 ps. The decays recorded with excitation at 360 nm and emission monitored at 390 nm, are again mono-exponential and with very short lifetimes. It is noteworthy that, at the experimental conditions, these lifetimes have no physical meaning, since they are shorter than the pulse width of
Table2. Excitation-dependent fluorescence lifetimes and χ2 parameter of MEH-PPV thin films produced from chloroform and acetonitrile dilute solutions. Each lifetime contributions to the total decay curve are given as percentages in brackets
λexc / nm λem / nm
Chloroform Acetonitrile
Fluorescence
lifetimes / ns χ2
Fluorescence
lifetimes / ns χ2
360
390 τ1 = 0.846 (1%)
τ2 = 0.038 (99%)
1.071 τ1 = 0.778 (1%)
τ2 = 0.052 (99%)
0.910
410 τ1 = 2.089 (31%)
τ2 = 0.184 (69%)
2.588 τ1 = 1.962 (40%)
τ2 = 0.114 (60%)
1.993
430 τ1 = 2.100 (48%)
τ2 = 0.219 (52%)
3.570 τ1 =1.937 (47%)
τ2 = 0.204 (53%)
2.766
450 τ1 = 2.299 (58%)
τ2 = 0.286 (42%)
12.695 τ1 = 1.777 (42%)
τ2 = 0.157 (58%)
2.978
445
495 τ1 = 2.907 (36%)
τ2 = 0.012 (64%)
1.438 τ1 = 1.321 (73%)
τ2 = 0.056 (27%)
3.758
535 τ1 = 3.203 (55%)
τ2 = 0.024 (45%)
1.332 τ1 = 1.256 (55%)
τ2 = 0.460 (45%)
2.467
585 τ1 = 3.494 (55%)
τ2 = 0.028 (45%)
1.582 τ1 = 1.168 (64%)
τ2 = 0.063 (36%)
4.434
615 τ1 = 3.601 (53%)
τ2 = 0.026 (47%)
2.262 τ1 = 1.141 (18%)
τ2 = 0.018 (82%)
2.261
485
495 τ1 = 0.330 (24%)
τ2 = 0.242 (76%)
3.704 τ1 = 0.082 (45%)
τ2 = 0.062 (55%)
16.535
535 τ1 = 3.982 (13%)
τ2 = 0.004 (87%)
1.897 τ1 = 1.116 (67%)
τ2 = 0.352 (33%)
2.575
585 τ1 = 4.144 (22%)
τ2 = 0.004 (78%)
3.883 τ1 = 1.716 (19%)
τ2 = 0.783 (81%)
3.015
615 τ1 = 4.209 (19%)
τ2 = 0.004 (81%)
4.282 τ1 = 1.845 (18%)
τ2 = 0.782 (82%)
the LED used for the excitation. At the emission range of 400 to 450 nm, decays are bi-exponential, with shorter lifetimes of approximately 200 ps, which is attributed to the S1-S0 fluorescence, and longer ones of approximately
2 ns, the latter contributing with, on average, 40% to the total decay. The longer lifetimes are slightly distinct for samples produced from solutions in distinct solvents. For chloroform-based films, the lifetimes are from 2.0 to 2.3 ns and for acetonitrile-based films, from 1.7 to 2.0 ns.
With excitation performed at 445 nm, the nanosecond-scaled lifetimes recorded for chloroform-based films are longer than the previous decays, with excitation at 360 nm, varying from 2.9 ns at emission of 495 nm to 3.6 ns for emission at 615 nm. On the other hand, the lifetimes decrease for acetonitrile-based films as the emission wavelength is longer, varying from 1.3 ns for emission at 495 nm to 1.1 ns at 615 nm. The shorter lifetimes in both samples are, again, too short to be accurately measured. Nevertheless, it is important to consider them as evidence for the existence of shorter lifetimes in these samples, even though they were not obtained, since it is not possible to fit a mono-exponential behavior to these samples.
With excitation performed at 485 nm, close to the maximum excitation for MEH-PPV, the lifetimes for both samples increase as the emission is monitored at longer wavelengths. Nevertheless, the lifetimes are very distinct among the samples. For chloroform-based film, the lifetimes vary from 4.0 ns, for emission at 535 nm, to 4.2 ns for the emission at 615 nm, whereas lifetimes are 2 to 3 times shorter for acetonitrile-based films, varying from 1.1 ns emission monitored at 535 nm to 1.8 ns at 615 nm.
On the other hand, acetonitrile-based films show a bi-exponential behavior at excitations of 445 and 485 nm, with the shorter wavelength varying from 300 to 800 ps, contributing with 50 to 80% to the total decay.
Computational simulations
Computational simulations of MEH-PPV trimers in vacuum, ethanol, chloroform and acetonitrile were performed by AM1 method in Gaussian 9 software, to obtain the optimal conformations and frequencies. ZINDO/S method was applied to obtain ground and excited states energies. Simulations were performed to find the MEH-PPV trimer low energy states and to obtain the vertical energy transitions states, including HOMO-LUMO transitions. Results were compared to steady-state fluorescent spectra to identify singlet and triplet electronic states that would be involved in exciton fission processes in these systems, if they occur.
Implicit solvent calculations - PCM model
Figure 6 shows that in vacuum or in any implicit solvent, molecular orbitals HOMO and LUMO are centered on the aromatic rings.
Figure 7 presents the energies of the first twenty lowest excited electronic states at each solvent and in vacuum. In any environment, the excited states reach an energy plateau at 3.1 eV, with five isoenergetic excited states, four of them being triplets and one singlet. From this energetic plateau, in solvents, the energy of the following excited states increases gradually. In vacuum, however, there is
a jump in energy from 3.1 to 3.7 eV, and from there, the energies are slightly higher than those observed in solvents. The calculated electronic energies (Figure 8) revealed the existence of triplet excited states with half the energy of a particular singlet for MEH-PPV, in the presence of any solvent or in vacuum.
Explicit solvent calculations
To reinforce the reliability of the experimental results, calculations using explicit solvents were performed. The analyses of the HOMO and LUMO molecular orbitals
calculated by this strategy were similar to those obtained using implicit solvents. Figure 6 presents the resulting HOMO and LUMO molecular orbitals, centered on the aromatic rings.
Figure 8 presents the lowest twenty excited states obtained for MEH-PPV trimer in explicit solvent approach. Four explicit molecules of ethanol were added to the ZINDO/S ethanol system implicit calculations, and two explicit acetonitrile molecules were added to the system. The explicit approach for chloroform system was not performed due to the absence of chlorine parameters on Gaussian software. The first eleven states are virtually the same for both systems. In agreement with the result of the implicit approach, the explicit approach resulted in a plateau at 3.1 eV, showing five isoenergetic excited states in both solvents. From this energetic plateau, again, the energy increases gradually, however exhibiting larger differences between solvents.
Discussion
Microscopy of thin films and blends
In Figure 5, samples prepared from chloroform present a more significant interchain connection than acetonitrile ones, indicating that it is important to consider the choice of solvent when preparing films for a desired application.
Some works corroborate the effect of solvents on the aggregation nature in the film. In their work, Hao et al.48 used time-resolved emission microscopy to
evidence regions in MEH-PPV film with several types of aggregation. They observed a long-lived blue-shifted emission from a monomer-like regions and a short-lived, red-shifted emission, due to aggregates. Their observations agree with Peteanu et al.49 work who used fluorescence
lifetime imaging microscopy (FLIM) to access aggregates in films of oligomers produced by reprecipitation which are models for MEH-PPV films. They were able to identify two main emitting moieties: one close to a monomer, presenting the emitting characteristics of a monomer, and one similar to an aggregate, presenting faster decays and red-shifted emission. Their findings corroborate with the model of a core-shell, in which the core consists of aggregated surrounded by monomer-like chains. Huser et al.50 studied the several types of aggregates in
films cast from solutions of distinct solvents, which are the reason for the multicolored fluorescence they observed. Also, Duhamel et al.51-54 demonstrated that intermolecular
interactions can be quantitatively described by steady-state and time-resolved fluorescence spectroscopy, since the distinct aggregates present distinct photophysics.
Figure8. Energies of the lowest twenty excited electronic states of MEH-PPV trimer in ethanol and acetonitrile, calculated by PCM, with four ethanol explicit molecules and two acetonitrile explicit molecules surrounding the trimer.
Figure7. Energies of the lowest twenty excited electronic states of
Photophysical behavior
UV-Vis absorption spectra
In non-solvents, the stronger blue-shift and the low intensity of the absorption are evident. It is noteworthy that in non-solvents such those, as showed by Padnamaban and Ramakrishnan,55 the intensities of absorption and emission
spectra are drastically decreased due to polymeric chain aggregation and a more efficient intermolecular interaction in such dilute solutions.
Spectra obtained in non-solvents such as EtOH, MeOH or MeCN, although similar in shape to those obtained in good solvents, are 2700 cm-1 blue-shifted (they are centered
at around 440 nm, while in good solvents, they are centered at 480-500 nm), which is a considerably large shift and must be explained considering solvent characteristics and photophysical behavior of MEH-PPV.
Fluorescence measurements
Steady-state spectroscopy measurements showed in Figure 3 evidenced the dependence of the optical response of dilute solutions with solvent general characteristics. Steady-state excitation and fluorescence spectra present a stronger dependence of shape, intensity and spectral shift with solvent identity and solution concentration. Excitation and emission spectra show prominent Stokes shifts in solutions of higher dielectric constants and of smaller refractive indexes solvents (Table 1), while it is smaller in solutions of more refractive solvents.
Solvents influence the photophysics of conjugated polymers by inducing lower or higher disorder, depending on the efficiency of salvation, driven by the polarizability (∆f) of the solvent and the coulombic interactions that occur between chromophore and solvent. In this regard, general properties of solvents, such as dielectric constants and refractive indexes highly influence the optical behavior. Although it is evident that solvent polarizability (∆f) exerts great influence on spectral bathochromic shifts, it may not be only due to solvents general effects. By applying the Lippert-Mataga46 approach, in which Stokes
shifts are plotted against polarizability (∆f), a linear relation evidences that shifts are due to general effects of solvents. A non-linear behavior is evidence of a more important contribution of specific interactions between solvent and the chromophore that result in the shifts. The Lippert-Mataga equation (equation 1) that originates the plot in Figure 8 is:
(1)
where is the Stokes shift; is the
polarizability of the solvent, µE is the dipole moment of the
excited state, µG is the dipole moment of the ground state
and a is the cavity radius.
Lippert-Mataga56 plots for 10-7 mol L-1 solutions are
presented in Figure 9. Data show that solvents’ physical-chemical properties do not influence the Stokes shifts as much as specific interactions between solvent and polymer molecules do. In fact, MEH-PPV solutions in non-solvents present the highest Stokes shifts, while the lower shifts are observed for solutions produced in good solvents. This effect is related to the occurrence of an aggregation collapse that enables interchain interaction in non-solvents, while intrachain interaction is more pronounced in solutions of good solvents.55 Even among the good solvents, solution
in THF presents the lowest Stokes shift, indicating that aggregation in such solvents is distinct. A reason for the distinct spectral shifts in good solvents is due to a distinct aggregation collapse, as predicted by Padmanaban and Ramakrishnan.55 It is expected that, in chloroform, the
red-shift is due to a more efficient intrachain aggregation than in THF.55 Viscosity of solvent is also known to affect
the photophysical behavior of conjugated polymers. Although the magnitude of the influence of viscosity on the Stokes shifts observed is not clear, Galvão et al.57
related the local viscosity with the distinct chain sizes and the reduced cohesion between polymer chains and the solvent, as the chain length is increased. Since the chain length is determined by aggregation, herein the effect in the photophysics is better interpreted as a function of aggregation.
In such cases, when general properties of solvents are not crucial to reveal MEH-PPV solutions luminescent
behavior, it is expected that Hildebrand’s solubility parameter would be helpful to interpret these events, since it is based on the cohesive energy density needed to break all intermolecular physical forces in the compound’s volume unit. Hansen’s proposal of three contributions to the total Hildebrand solubility parameter is also relevant, which considers dispersive forces, polar forces and the hydrogen bond formation. Unfortunately, as showed by Cossiello et al.,58 Hildebrand’s solubility parameter is not
adequate to explain Stokes shifts of MEH-PPV solutions. Indeed, as showed by Chang et al.,59 MEH-PPV spectral
behavior is due to the superposition of electronic spectra on a distribution of MEH-PPV’s oligomers with distinct chain lengths, possibly due to MEH-PPV’s property of small range of torsion angle. Also, Nguyen et al.2 found
that luminescence of PPV derivatives is dependent on conformation restrictions imposed by the solvent, as a result of distinct interactions between solvent molecules and polymeric chain, considering that some solvents can strongly interact with polymer chains, while others cannot. Interestingly, they also found evidence for replication of the photophysical behavior of MEH-PPV solution to cast films, which agree with our findings, to be shown later on.
Fluorescence of thin films and blends
From Figure 4, it was observed that thin film and blend produced from chloroform solution presented distinct fluorescence spectra. The reason for that may be that in thin films, intrachain aggregates present more important luminescent contributions than interchain aggregates, while the interchain aggregates are more perceptible in blends. It is well-known that fluorescence of MEH-PPV aggregates is red-shifted with respect to the intrachain and non-aggregates fluorescence.2,60 Although the work of Samuel et al.,60 in
which MEH-PPV films presented red-shifted fluorescence with respect to solution fluorescence, does not agree with the results presented here, it also considers that there are interchain aggregates in MEH-PPV films, although in a smaller amount, when compared to other PPV derivatives. In addition, Heeger and co-workers61,62 considered the
inexistence of intrachain aggregates, although with low probability of formation, and Mirzov and Scheblykin7
observed the spectral blue-shift in films as a result of restrained MEH-PPV backbone torsions.
Since the MEH-PPV used is of Mw = 125 kDa and polydispersity index (PDI) of 5, this compound presents a variety of chain sizes and is susceptible to chain size
effects.5,42,63-66 In the PMMA blend, the MEH-PPV
fluorescence blue-shifts are related to the suppress of interchain excitons formation,67 or to conformational
changes on the polymer backbone.7 In a previous work,68
we have demonstrated that although MEH-PPV and PMMA are immiscible, there is some degree of miscibility enabling the interaction between branches of MEH-PPV segments and the PMMA matrix, in the distance of 65 Å.68
Lin et al.25 presented fluorescence micrographs of
distinct proportions of MEH-PPV embedded in PMMA matrices, obtaining distinct fluorescent emissions due to distinct emitting moieties. In particular, their system
composed of 10-5 m/m of MEH-PPV in PMMA showed
a green colored (530 nm) fluorescence with some orange colored (580 nm) spots, which they related to the green emission of isolated MEH-PPV chains and the red-shifted emissions, due to other aggregates. This is similar to our findings, regarding the MEH-PPV thin film from chloroform solution. Lin et al.15 showed that the bulk
presents several emitting moieties with distinct orientations, all contributing to the total fluorescence spectrum. This indicates that MEH-PPV photophysical behavior is dependent on morphology, as an effect of chosen solvent on chain organization, which promotes blue or red-shifts originated from exciton hopping process. Based on the study of Padmanaban and Ramakrishnan,4 there is an energy
transfer between collapsed aggregates more prominent from intrachain aggregates, with shorter effective conjugation lengths than from those with longer conjugation lengths, resulting in red-shift.
When MEH-PPV/PMMA blends or MEH-PPV thin films are prepared from dilute solutions in non-solvents, such as acetonitrile and ethanol, fluorescence is strongly blue-shifted. To our knowledge, this blue-shift was not reported yet. From fluorescence spectra in Figure 3, the observed intensity fluctuation of the fluorescence at 520-550 nm in films in comparison to solutions, is associated to a reversible and efficient energy migration, referred to as the blinking effect.16 It is expected that an exciton lies in a
temporary long-lived ‘‘dark’’ state (e.g. triplet state) from which the system is not able to immediately fluoresce.16 In
polymers such as MEH-PPV, this phenomenon is expected to occur, since it presents several emitting moieties over which the exciton is delocalized17 to achieve local excitation
energy minima.53 MEH-PPV samples in this work contain
in good solvents because of the high probability of energy transfer from blue-emitting aggregates to red-emitting ones via Förster resonant mechanism, as assumed by Liang et al.,21 and possibly due to the exciton fission
occurrence, as mentioned before. In a molecular approach, in non-solvents, blue emissions are detected mostly because longer segments interact poorly with non-solvent molecule; therefore, they are entangled, resulting in the aggregates collapse as predicted by Padmanaban and Ramakrishnan.55
Indeed, several works have proved the existence of triplet excitons in conjugated polymers and, to our interest, in MEH-PPV.18,69,70 In a previous work of Hale et al.,18
triplet states of PPV conjugated polymers were accessed by two-photon emission experiments and insights into the nature of triplet exciton relaxation processes were achieved by a rate equation approach developed by Halas and co-workers.71
The significantly distinct emission spectra obtained for films and solutions produced in acetonitrile and ethanol can be understood as the thermally activated delayed fluorescence (TADF), which is expected to provide fluorescence (hot excitons emission) from the triplet-triplet annihilation (TTA) of two colliding triplets.72 Although Sinha and Monkman73
had reported TTA in MEH-PPV, for this effect to occur, triplet excited states must be generated. In the present work, we could not find fluorescence microseconds timescale decays to evidence this effect. Nevertheless, the fluorescence longer lifetimes especially for MEH-PPV films cast are longer than usually expected. Monkman et al.74 generated triplet
states in MEH-PPV of 1.5 eV via pulse radiolysis, while Sinclair et al.75 accessed the triples states with photons of
high energy with adequate “pump intensity” and Xu et al.70
accessed high energy vibronic states of MEH-PPV by high voltage bias application, and observed fluorescence at 390-430 nm, corroborating with our measurements. The fact that triplet excited states can be accessed in MEH-PPV allows for the occurrence of several unimolecular processes, for instance, singlet exciton fission. In this process, it is expected that a singlet exciton in MEH-PPV splits into two triplet excitons, which is possible if the excitation energy is high enough to excite the system to vibrational excited states into S1 electronic state.76 In fact, Smith and Michl77 defended
the occurrence of singlet fission in conjugated organic molecules, especially in PPV derivatives. Österbacka et al.78
reported the existence of triplet and singlet excited states in PPV derivatives that are involved in singlet fission process in ultrafast thermalization. In the Computational simulations section, we will demonstrate that the energy of an adequate singlet excited state has twice the energy value of the lowest excited triplet state.
In several works,18,66-68,79-81 authors commented
on photo-oxidation and its effect on the MEH-PPV
photophysics, especially with respect to the triplet exciton role in the photo-oxidation process. In order to identify the occurrence of any process of oxidation or degradation that could be responsible for the photophysical behavior detected in non-solvents based samples, we performed a simple re-dissolution and re-cast test, which confirmed the emissions as being from MEH-PPV itself. The tests are presented in detail in Supplementary Information (Figure S1), available for this work.
Fluorescence lifetimes
The bi-exponential behavior observed for the MEH-PPV films by TRES experiments revealed shorter lifetimes of tens to hundreds of picoseconds and longer ones, of nanoseconds. These short lifetimes, occurring at shorter emission wavelengths, were also observed by Di Paolo et al.47 They attributed it to an energy transfer
between distinct aggregates in pure films that occur either by Förster or Dexter mechanisms, since both result in the excited state destabilization. They also performed their studies in a model molecule, the trimer of MEH-PPV repeat units, to show that there are geometrical aspects related to the bi-exponential behavior of the polymer lifetime. They attributed the blue-shifted emission to conformers in a non-planar configuration, while the planar conformers would present red-shifted fluorescence, usual for MEH-PPV. Lifetimes of hundreds of picoseconds are relative to the S1-S0 fluorescence, while the shorter lifetimes
of tens of picoseconds are related to either intrachain energy transfer or conformational relaxation in the polymer chain. These observations agree with our findings, since at the emission range from 400 to 450 nm, decays are bi-exponential, with shorter lifetimes of approximately 200 ps and longer ones of approximately 2 ns.
Although for chloroform-based film the lifetimes are 2 to 3 times longer than those recorded for acetonitrile-based films, the same behavior of increasing lifetime with increasing emission wavelength is observed for both samples. Lifetimes obtained for chloroform-based films are too long, which could be a result of non-convergence between experimental and calculated decays, since χ2 parameter is too large, although longer
lifetimes of nanoseconds have been already registered by Di Paolo et al.47 In their work, they related the longer
On the other hand, acetonitrile-based films show a bi-exponential behavior at excitations of 445 and 485 nm. Shorter lifetimes are compatible to those expected for MEH-PPV S1-S0 radiative transition, although longer ones are
related to an energy migration that arises from the overlap of emissions from distinct aggregates that were sequentially excited, as stated by Di Paolo et al.,47 but this effect is less
effective than the one observed in the chloroform-based films, which presents even longer lifetimes, as showed earlier.
These distinct dynamic behavior of both samples evidence the fact stated by Padmanaban and Ramakrishnan4
that, in MEH-PPV of long chains, which present distinct aggregates, the emission of individual conjugated segments are masked and the fluorescence quantum yield decreases monotonically as the conjugation length increases. This is the case for the acetonitrile-based films, since there is distribution of collapsed aggregates with distinct areas and, thus, conjugation lengths.55 In such films, aggregates of
smaller effective areas and conjugation lengths are more numerous than those in chloroform-based films.
Shorter lifetimes of high energetic excited states evidence their prompt deactivation, which is an important characteristic that favors the occurrence of a sort of deactivating process. Excitation at 360 nm showed a distinct photophysical behavior, by resulting in a mono-exponential fluorescence decay, with emission monitored at 390 nm, for both acetonitrile and chloroform-based films. This is evidence of deactivation of the high energy excited state by a path elected among several probable mechanisms, enabled by morphological characteristics. Here, we suspect that deactivation must occur by very rapid processes, such as hopping process, with rapid energy transfer from the high-energy excited state to lower ones. This agrees with the work of Kersting et al.43 that reported
the femtosecond relaxation in PPV through fast hopping from the high-energy density (DOS) of states to DOS of lower energy. In is noteworthy that hopping processes are dependent of exciton diffusion length and of the lifetimes of the excited electronic states involved in the process, which means that fast processes can be related to shorter diffusion lengths, thus they are influenced by morphology of the sites created by distinct aggregation, such as size of domains and the collapse of aggregates.
It is noteworthy that these effects are not related to the presence of solvents in the bulk film, since they were vacuum removed for a long period of time. Also, as explained by Smith and Michl,82 triplet states formation
dependent on excitation wavelength may be related to the occurrence of endoergic singlet fission.
Analyses of morphological and electronic characteristics are essential to determine the mechanisms of deactivation
involved in each sample. It is noteworthy that all excited states accessed in this experiment are present in thin films, produced either from acetonitrile or from chloroform dilute solutions.
As stated by Smith and Michl,77 singlet fission is often
observed when an organic moiety in an electronic excited singlet state shares its excitation energy with a neighboring ground-state luminescent molecule, resulting in the conversion of both to excited moieties in a triplet state. This is observed in several structures such as conjugated polymers, if the lowest energetic singlet excited states behave as degenerated states. Specifically, for PPV, the excited triplet states that may contribute to singlet fission are at 3.1 eV, with a gradual increase to a plateau at 4.4 eV. This gradual rise is a result of the inhomogeneous broadening, nevertheless, to conclude about the occurrence of exciton fission in these systems, experimental data are lacking and transient absorption measurements need to be performed.
Computational simulations
Implicit solvent
From Figures 5 and 6 the calculated electronic energies revealed the existence of triplet excited states with half the energy of a particular singlet for MEH-PPV, at the energy level of 3.1 eV, in the energy plateau, in the presence of any solvent or in vacuum. In any environment, there are triplet excited states with energy of 1.55 eV, which agrees with Smith and Michl.77
Explicit solvent
From Figure 7, also in this approach, the first singlet state occurs at this same plateau, at around 3 eV. It revealed the existence of triplet states with half the energy of the first singlet state found, being at around 1.5 eV. Explicit and implicit solvent approach result the same energies for the singlet and triplet excited states. This reinforces the assumption that there is a singlet excited state presenting characteristics of allowed intercrossing system, associated to a triplet excited state with half the energy. These energies were also reported by Österbacka et al.78 These
Conclusions
From steady-state fluorescence of MEH-PPV dilute solution, the observed blue-shifts in MEH-PPV fluorescence as solvent is changed from good to non-solvents, due to distinct aggregation mechanisms and favored by specific interactions between solvent and MEH-PPV. This was evidenced by microscopy and by applying the Lippert-Mataga approach. In non-solvents, the blue-emitting collapsed H-aggregates are more probable than the red-emitting J-aggregates; in good solvents, J-aggregates luminescence masks the H-aggregates luminescence. In films, the memory effects related to chain conformation driven by solvent-solute interactions were evidenced, and intrachain aggregates formed in the bulk film showed more important luminescent contributions than interchain aggregates. Although time-resolved fluorescence resulted in bi-exponential decays, which evidences the emission from distinct intrachain aggregates, the mono-exponential fast decay upon high energy excitation indicates deactivation through several mechanisms, among them hopping, TADF and exciton fission. The latter implies the existence of triplet excited states with the correct energy to occur. Through computational simulations, it was found that excited states involved in hopping and blinking processes present the right energies to undergo exciton fission, nevertheless, transient absorption experiments need to be performed to evidence this effect.
Supplementary Information
Supplementary information (fluorescence lifetime curves and relevant experimental data on the integrity of the polymer chain) is available free of charge in http://jbcs.sbq.org.br as PDF file.
Acknowledgments
The authors thank Prof Teresa Atvars for the fluorescence lifetime measurements, LabMic/UFG (Universidade Federal de Goiás) for TEM images and GCM/IF/UFG for steady-state fluorescence measurements. T. D. Martins, A. C. C. Ribeiro and H. S. Camargo would also like to thank FAPEG (Fundação de Amparo à Pesquisa do Estado de Goiás, scholarship 201410267000521) for the scholarship and financial support and CNPq (Conselho Nacional de Desenvolvimento Científico e Tecnológico, grant 552252/2011-5 and grant 407619/2013-5) for the financial support. R. Custodio and D. H. Pereira would like to thank FAPESP (Fundação de Amparo à Pesquisa do
Estado de São Paulo, Center for Computational Engineering and Sciences, grant 2013/08293-7), CNPq, and FAEPEX-UNICAMP (Fundo de Apoio ao Ensino, à Pesquisa e à Extensão da UNICAMP).
References
1. Heeger, A. J.; NobelLecture2000, 380. Available at https://
www.nobelprize.org/nobel_prizes/chemistry/laureates/2000/ heeger-lecture.pdf, accessed in September 2017.
2. Nguyen, T. Q.; Doan, V.; Schwartz, B. J.; J.Chem.Phys.1999,
110, 4068.
3. Choudhury, P. K.; Bagchi, D.; Sangeeth, C. S. S.; Meno, R.;
J.Mater.Chem.2011, 21, 1607.
4. Padmanaban, G.; Ramakrishnan, S.; J.Am.Chem.Soc.2000,
122, 2244.
5. Cossiello, R. F.; Akcelrud, L.; Atvars, T. D. Z.; J.Braz.Chem. Soc.2005, 16, 74.
6. Coropceanu, J. C.; Silva Filho, D. A.; Olivier, Y.; Silbey, R.; Bredas J. L.; Chem.Rev.2007, 107, 926.
7. Mirzov, O.; Scheblykin, I. G.; Phys.Chem.Chem.Phys.2006,
8, 5569.
8. Köhler, A.; Hoffmann, S. T.; Bässler, H.; J.Am.Chem.Soc.
2012, 134, 11594.
9. Hu, D. H.; Yu, J.; Wong, K.; Bagchi, B.; Rossky, P. J.; Barbara, P. F.; Nature2000, 405, 1030.
10. Yu, Z. H.; Barbara, P. F.; J.Phys. Chem.B 2004, 108, 11321.
11. Nguyen, T. Q.; Wu, J. J.; Doan, V.; Schwartz, B. J.; Tolbert, S. H.; Science2000, 288, 652.
12. Hoffmann, S. T.; Bässler, H.; Köhler, A.; J.Phys.Chem.B2010,
114, 17037.
13. Spano, F. C.; Silva. C.; Annu.Rev.Phys.Chem.2014, 65, 477. 14. Kasha M.; Radiat.Res.1963, 20, 55.
15. Lin, H.; Tabaei, S. R.; Thomsson, D.; Mirzov, O.; Larsson, P. O.; Scheblykin, I. G.; J.Am.Chem.Soc.2008, 130, 7042.
16. Mirzov, O.; Cichos, F.; Von Borczyskowski, C.; Scheblykin, I.;
J.Lumin.2005, 112, 353.
17. Mirzov, O.; Cichos, F.; Von Borczyskowski, C.; Scheblykin, I.;
Chem.Phys.Lett.2004, 386, 286.
18. Hale, G. D.; Oldenburg, S. J.; Halas, N. J.; Phys.Rev.B1997,
55, R16069.
19. Lin, H.; Tian, Y.; Zapadka, K.; Persson, G.; Thomsson, D.; Mirzov, O.; Larsson, P. O.; Widengren, J.; Scheblykin, I. G.;
NanoLett.2009, 9, 4456.
20. Rothberg, L. J.; Yan, M.; Papadimitrakopoulos, F.; Galvin, M. E.; Kwock, E. W.; Miller, T. M.; Synth.Met.1996, 80, 41. 21. Liang, J. J.; Hsu, J. H.; Lim, T. S.; White, J. D.; J.Chin.Chem.
Soc.2010, 57, 478.
22. Dogariu, A.; Vacar, D.; Heeger, A. J.; Phys.Rev.B1998, 58,
23. Kranzelbinder, G.; Nisoli, M.; Stagira, S.; Silvestri, S. D.; Lanzani, G.; Mullen, K.; Scherf, U.; Graupner, W.; Leising, G.; Appl.Phys.Lett.1997, 71, 2725.
24. Samuel, I. D. W.; Rumbles, G.; Collison, C. J.; Friend, R. H.; Moratti, S. C.; Holmes, A. B.; Synth.Met.1997, 84, 497. 25. Lin, H.; Hania, R. P.; Bloem, R.; Mirzov, O.; Thomsson, D.;
Scheblykin, I. G.; Phys.Chem.Chem.Phys.2010, 12, 11770. 26. Wang, Z.; Liu, Q.; Chen, T.; Wang, Y.; Yuan, J.; Zheng, C.;
Chen, R.; Huang, W.; DyesPigm. 2015, 113, 529.
27. Lam, W. H.; Lam, E. S. H.; Yam, V. W. W.; J.Am.Chem.Soc.
2013, 135, 15135.
28. Lu, L. P.; Finlayson, C. E.; Kabra, D.; Albert-Seifried, S.; Song, M. H.; Havenith, R. W. A.; Tu, G. L.; Huck, W. T. S.; Friend, R. H.; Macromol.Chem.Phys.2013, 214, 967.
29. Guillamet, R.; Lagay, N.; Mocuta, C.; Lagree, P. Y.; Carbone, G.; Decobert, J.; J.Cryst.Growth2013, 370, 128.
30. Dohner, E. R.; Jaffe, A.; Bradshaw, L. R.; Karunadasa, H. I.;
J.Am.Chem.Soc.2014, 136, 13154.
31. Casanova, D.; Rotzinger, F. P.; Grätzel, M.; J.Chem.Theory Comput.2010, 6, 1219.
32. Parrott, E. P. J.; Tan, N. Y.; Hu, R. R.; Zeitler, J. A.; Tang, B. Z.; Pickwell-MacPherson, E.; Mater.Horiz.2014, 1, 251.
33. Li, H. H.; Driewer, J. P.; Han, Z. H.; Low, D. A.; Yang, D. S.; Xiao, Z. Y.; Phys.Med.Biol.2014, 59, 1899.
34. Fang, X. M.; Huo, Y. P.; Wei, Z. G.; Yuan, G. Z.; Huang, B. H.; Zhu, S. Z.; Tetrahedron2013, 69, 10052.
35. Liu, Y. S.; Ware, W. R.; J.Phys.Chem.1993, 97, 5980. 36. Miertus, S.; Tomasi, J.; Chem.Phys.1982, 65, 239.
37. Frisch, M. J.; Trucks, G. W.; Schlegel, H. B.; Scuseria, G. E.; Robb, M. A.; Cheeseman, J. R.; Scalmani, G.; Barone, V.; Mennucci, B.; Petersson, G.A.; Nakatsuji, H.; Caricato, M.; Li, X.; Hratchian, H. P.; Izmaylov, A. F.; Bloino, J.; Zheng, G.; Sonnenberg, J. L.; Hada, M.; Ehara, M.; Toyota, K.; Fukuda, R.; Hasegawa, J.; Ishida, M.; Nakajima, T.; Honda, Y.; Kitao, O.; Nakai, H.; Vreven, T.; Montgomery, J. A.; Peralta Jr., J. E.; Ogliaro, F.; Bearpark, M.; Heyd, J. J.; Brothers, E.; Kudin, K. N.; Staroverov, V. N.; Kobayashi, R.; Normand, J.; Raghavachari, K.; Rendell, A.; Burant, J. C.; Iyengar, S. S.; Tomasi, J.; Cossi, M.; Rega, N.; Millam, J. M.; Klene, M.; Knox, J. E.; Cross, J. B.; Bakken, V.; Adamo, C.; Jaramillo, J.; Gomperts, R.; Stratmann, R. E.; Yazyev, O.; Austin, A. J.; Cammi, R.; Pomelli, C.; Ochterski, J. W.; Martin, R. L.; Morokuma, K.; Zakrzewski, V. G.; Voth, G. A.; Salvador, P.; Dannenberg, J. J.; Dapprich, S.; Daniels, A. D.; Farkas, Ö.; Foresman, J. B.; Ortiz, J. V.; Cioslowski, J.; Fox, D. J.;
Gaussian09, Revision D.01, Gaussian, Inc.: Wallingford CT,
2009.
38. Campbell, I. H.; Smith, D. L.; Appl.Phys.Lett.1999, 74, 2809.
39. Smallwood, I. M.; HandbookofOrganicSolventProperties; Arnold, A member of the Hodder Headline Group: London, Sydney, Auckland; co-published in the Americas by Halsted
Press, an imprint of John Wiley & Sons Inc.: New York, Toronto, 1996.
40. Wu, C.; Bull, B.; Szymanski, C.; Christensen, K.; McNeill, J.;
ACS Nano2008, 2, 2415.
41. Sherwood, G. A.; Cheng, R.; Smith, T. M.; Werner, J. H.; Shreve, A. P.; Peteanu, L. A.; Wildeman, J.; J.Phys.Chem.C2009, 113,
18851.
42. Schindler, F.; Lupton, J. M.; Feldmann, J.; Scherf, U.; Proc. Natl.Acad.Sci.U.S.A.2004, 101, 14695.
43. Kersting, R.; Lemmer, U.; Mahrt, R. F.; Leo, K.; Kurz, H.; Bässler, H.; Göbel, E. O.; Phys.Rev.Lett.1993, 70, 3820. 44. Markov, D. E.; Blom, P. W. M.; Appl.Phys.Lett.2005, 87,
233511.
45. Yan, M.; Rothberg, L. J.; Papadimitrakopoulos, F.; Galvin, M. E.; Miller, T. M.; Phys.Rev.Lett.1994, 73, 744.
46. Lakowicz, J.; PrinciplesofFluorescenceSpectroscopy, 3rd ed.;
Springer: New York, 2006.
47. Di Paolo, R. E.; Burrows, H. D.; Morgado, J.; Maçanita, A. L.;
ChemPhysChem2009, 10, 448.
48. Hao, X. T.; McKimmie, L. J.; Smith, T. A.; J.Phys.Chem.Lett.
2011, 2, 1520.
49. Peteanu, L. A.; Sherwood, G. A.; Werner, J. H.; Shreve, A, P.; Smith, T. M.; Wildeman, J.; J.Phys.Chem.C2011, 115, 15607. 50. Huser, T.; Yan, M.; Rothberg, L. J.; PNAS2000, 97, 11187.
51. Pirouz, S.; Duhamel, J.; Jiang, J.; Duggal, A.; Macromolecules
2017, 50, 2467.
52. Pirouz, S.; Duhamel, J.; Jiang, J.; Duggal, A.; Macromolecules
2015, 48, 4620.
53. Farhangi, S.; Duhamel, J.; Macromolecules2016, 49, 6149. 54. Thoma, J. L.; Duhamel, J.; Li, M. J.; Bertocchi, M. J.; Weiss,
R. G.; Macromolecules2017, 50, 3396.
55. Padmanaban, G.; Ramakrishnan, S.; J.Phys.Chem.B2004,
108, 14933.
56. Mataga, N.; Kubota, T.; MolecularInteractionsandElectronic Spectra; Marcel Dekker Inc.: New York, 1970.
57. Galvão, A. M.; Di Paolo, R. E.; Maçanita, A. L.; Naqvi, K. R.;
ChemPhysChem2013, 14, 583.
58. Cossiello, R. F.; Susman, M. D.; Aramendia, P. F.; Atvars, T. D. Z; J.Lumin.2010, 130, 415.
59. Chang, R.; Hsu, J. H.; Fann, W. S.; Liang, K. K.; Chang, C. H.; Hayashi, M.; Yu, J.; Lin, S. H.; Chang, E. C.; Chuang, K. R.; Chen, S. A.; Chem.Phys.Lett.2000, 317, 142.
60. Samuel, I. D. W.; Rumbles, G.; Collison, C. J.; Phys. Rev. B
1995, 52, R11 573.
61. Vacar, D.; Dogariu, A.; Heeger, A. J.; Chem. Phys. Lett.1998,
290, 58.
62. Dogariu, A.; Vacar, D.; Heeger, A. J.; Synth. Met.1999, 101, 202.
63. Yu, J.; Hu, D. H.; Barbara, P. F.; Science2000, 289, 1327. 64. Lee, Y. J.; Kim, D. Y.; Grey, J. K.; Barbara, P. F.; ChemPhysChem
65. Lee, Y. J.; Kim, D. Y.; Barbara, P. F.; J.Phys.Chem.B2006,
110, 9739.
66. Feist, F. A.; Basche, T.; J.Phys.Chem.B2008, 112, 9700. 67. Schwartz, B. J.; Annu.Rev.Phys.Chem.2003, 54, 141.
68. Martins, T. D.; Atvars, T. D. Z.; J.Compos.Biodegrad.Polym.
2013, 1, 66.
69. Gesquiere, A. J.; Park, S. J.; Barbara, P. F.; J.Am.Chem.Soc.
2005, 127, 9556.
70. Xu, X. R.; Xu, X. L.; Wang, X. F.; Yang, X. H.; Xu, Z.; Hou, Y. B.; Chin.J.Polym.Sci.2001, 19, 579.
71. Cheville, R. A.; Averitt, R. D.; Halas, N. J.; Opt.Commun.1994,
110, 327.
72. Dias, F. B.; Penfold, T. J.; Monkman, A. P.; MethodsAppl. Fluoresc.2017, 5, 012001. DOI 10.1088/2050-6120/aa537e.
73. Sinha, S.; Monkman, A. P.; Appl.Phys.Lett.2003, 82, 4651. 74. Monkman, A. P.; Burrows, H. D.; Miguel, M. G.; Hamblett, I.;
Navaratnam, S.; Synth.Met.2001, 116, 75.
75. Sinclair, M. B.; McBranch, D.; Hagler, T. W.; Heeger, A. J.;
Synth.Met.1992, 49, 593.
76. Kim, D. Y.; Grey, J. K.; Barbara, P. F.; Synth.Met.2006, 156, 336.
77. Smith, M.; Michl, J.; Chem.Rev.2010, 110, 6891.
78. Österbacka, R.; Wohlgenannt, M.; Shkunov, M.; Chinn, D.; Vardeny, Z. V.; J.Chem.Phys.2003, 118, 8905.
79. Halas, N. J.; Hale, G. D.; Oldenburg, S. J.; SPIEProc.1998,
3145, 229.
80. Cumpston, B. H.; Jensen, K. F.; Synth.Met.1995, 73, 195.
81. Scurlock, R. D.; Wang, B.; Ogilby, P. R.; Sheats, J. R.; Clough, R. I.; J.Am.Chem.Soc.1995, 117, 10194.
82. Smith, M. B.; Michl, J.; Annu.Rev.Phys.Chem.2013, 64, 361.
Submitted:June13, 2017 Published online: September 21, 2017