0103 - 5053 $6.00+0.00
Article
*e-mail: [email protected]
Probing Interchain Interactions in Emissive Blends of
Poly[2-methoxy-5-(2’-ethylhexyloxy)-p
-phenylenevinylene] with Polystyrene and Poly(styrene-
co
-2-ethylhexyl acrylate)
by Fluorescence Spectroscopy
Marcelo L. De Andrade and Teresa D. Z. Atvars*
Instituto de Química, Universidade Estadual de Campinas, CP 6154, 13084-971 Campinas-SP, Brazil
Nesse trabalho foram realizados estudos dinâmicos e estáticos de fotoluminescência de blendas poliméricas do poli[2-metóxi-5-(2’-etilexiloxi)-p-fenileno vinileno] (MEH-PPV) com
poliestireno-co-2-co-metacrilato de metila1-1-pirenila e seu copolímero poli(estireno-co-acrilato
de 2-etilexila-co-1-metacrilato de metila1-1-pirenila) (com 9 mol% e 19 mol% de unidades
acrilato de 2-etilexila unidades e 0,06 mol% de 1-pirenila). O poliestireno marcado com pirenilo e alguns de seus copolímeros foram sintetizados por polimerização em emulsão e caracterizados por 13C e 1H NMR, FTIR, GPC, DSC e UV-Vis. Os filmes foram preparados por deposição
centrífuga a partir de soluções em clorofórmio, sendo a composição das blendas de 0,1, 0,5, 1,0, e 5,0 m/m% de MEH-PPV. A miscibilidade desses sistemas foi estudada através dos processos de transferência não-radiativa de energia entre o grupo 1-pirenila (doadores de energia) e o MEH-PPV (receptor de energia). A intensidade relativa de emissão e os tempos de decaimento de fluorescência do doador mostraram que a miscibilidade do MEH-PPV e dos copolímeros e maior do que entre o MEH-PPV e o poliestireno o que foi confirmado por microscopia óptica de epifluorescência e por microscopia eletrônica de varredura.
We present dynamic and static photoluminescence studies on polymer blends of conjugated poly[2-methoxy-5-(2’-ethylhexyloxy)-p-phenylenevinylene] (MEH-PPV) with polystyrene-co
-1-pyrenyl methyl methacrylate and its copolymer poly(styrene-co-2-ethylhexyl acrylate-co
-1-pyrenylmethyl methacrylate) (with 9 mol% and 19 mol% of 2-ethylhexyl acrylate units and 0.06 mol% of 1-pyrenyl). Pyrenyl-labeled polystyrene and its copolymers were synthesized by emulsion polymerization and characterized by 13C and 1H-NMR, FTIR, GPC, DSC, and
UV-Vis. Spin-coating films of the blends were prepared from chloroform solutions with 0.1, 0.5, 1.0, and 5.0 wt% of MEH-PPV. The miscibility of these systems was studied by non-radiative energy transfer processes between the 1-pyrenyl moieties (the energy donor) and MEH-PPV (the energy acceptor). The relative emission intensities and the fluorescence lifetimes of the donor showed that the miscibility of MEH-PPV and the copolymers is greater than that of MEH-PPV and polystyrene and this was confirmed by epifluorescence optical microscopy and scanning electron microscopy.
Keywords: poly[2-methoxy-5-(2’-ethylhexyloxy)-p-phenylenevinylene] (MEH-PPV),
blends, miscibility, copolymer poly(styrene-co-2-ethylhexyl acrylate-co-1-pyrenylmethyl
methacrylate), fluorescence, energy transfer
Introduction
Conjugated polymers are the subject of considerable scientific attention because they constitute attractive components for application as emissive materials in electroluminescent devices and, in particular, as organic light-emitting diodes (OLED).1 Such interest is attributed to their superior processability and flexibility relative to
inorganic compounds, greater possibility of preparation of materials with distinct emission colors, electroluminescence emission with low turn-on voltages, possibility of building flexible displays etc.1 Within the class of conjugated polymers, one widely studied is poly[2-methoxy-5-(2’-ethylhexyloxy)-p-phenylenevinylene] (MEH-PPV) (Figure 1a), which exhibits relatively high photoluminescence (PL) and electroluminescence efficiencies.1-4
exciton with emission at λem = ca. 580 nm,6,7 while in films the photoexcitation results in interchain excitons with red-shift emissions λem > 640 nm or higher.2-16 MEH-PPV electroluminescence is in general observed at > 640 nm and is coincident with the photoluminescence spectrum. Because of the formation of the interchain species, the efficiencies of electroluminescence conjugated polymer devices are remarkably reduced.2-16 To overcome the lack of efficiency, several experiments using MEH-PPV blended with other polymers have been reported.17-30 Nevertheless, there are several other reasons to prepare blends with electroluminescent materials: to isolate the electro-luminescent macromolecules for performing single molecule spectroscopy and understanding the electron energy transfer processes;25,31,32 to change the emission colors;23,28,33 by decreasing the aggregation with enhan-cement of the electron mobility;34 to combining electron and hole transport properties;35 to produce white light-emitting LEDs etc.36
Although the polymer blends are, in general, immiscible systems, their morphological and topological properties, as well as their composition affect the performance of the organic LEDs.37,38 In general these are heterogeneous media, with pronounced phase separation, produced by nucleation and growth or by spinodal decomposition depending on the system and on the composition. Interfaces play an important hole on the device performance.27
Improvement of polymer miscibility can change the morphology, the topological uniformity and the profile of the interface. Miscibility can be enhanced using several approaches.39 In this work we prepared blends of MEH-PPV as the minor component (the guest) with three types of styrene-co-alkyl acrylate copolymers. Effects of the copolymer composition and of the copolymer chemical structure on the polymer blend morphology and on the photoluminescent properties were analyzed.
Several different methods are usually employed to investigate miscibility and interchain interactions in polymer blends. Every one of these methods analyzes the morphology over a specific scale of spatial dimensions.40,41 For a better understanding of the degree of mixing, morphological analysis on a small spatial scale is necessary. Non-radiative energy transfer of electronic excitation (NRET) is one of the techniques that satisfies this condition and can be employed in studies of the miscibility of polymer blends including those prepared with conjugated polymers.19,26,42-45 Because the rate of the NRET process is a function of the distance between the donor (in the electronic excited state) and acceptor (in the electronic ground state) chromophores, which is known
as the Förster radius, this method provides a direct measurement of phase interpenetration.46,48
Here we show morphology and miscibility studies of MEH-PPV blends with some optically inert polymers (host
polymers): poly(styrene-co-2-ethylhexyl acrylate)
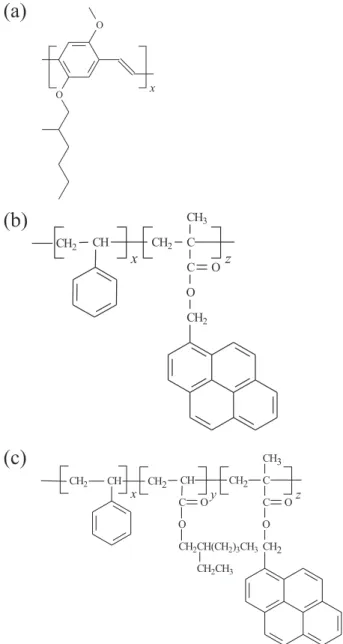
(SEHAMA) with three different contents of 2-ethylhexyl acrylate units (0, 9 and 19 mol%) (Figure 1). All these materials may exhibit emission in UV-range due to the presence of the phenyl moieties. However, this emission is not overlapped with the MEH-PPV absorption band. Because the NRET process requires a remarkable spectral overlap between the donor emission (SEAHMA) and the acceptor absorption band (MEH-PPV), we copolymerized the PS and its copolymers with 1-pynenyl moieties.
Figure 1. Chemical structures of the conjugated polymers (a) MEH-PPV,
The pyrenyl moieties exhibit higher intensity blue emission (400-500 nm) strongly overlapped with the MEH-PPV absorption (λabs = 470 nm); the fluorescence lifetime of the pyrenyl moiety (donor) in the presence and absence of the acceptor can be easily detected (hundreds of nanoseconds) and the vibronic intensity ratio of the donor emission band is sensitive to the polarity of the medium.54,55 Moreover, because the donor and acceptor emissions are of distinct colors (blue and red, respectively), epifluorescence microscopy (EFM) is a very useful tool
for both morphological characterization and in situ
chemical analysis for identifying every domain of the polymer blend by differences in the color.48-51 The morphological studies were further detailed by scanning electron microscopy (SEM).
Experimental
Materials
Monomers (2-ethylhexyl acrylate (EHA) and styrene (STY), both from Sigma-Aldrich Chemical Co., were washed with 5% sodium hydroxide and distilled water. After, they were dried over anhydrous sodium sulfate, vacuum distillated and stored in a refrigerator. The fluorescent monomer 1-pyrenylmethyl methacrylate
(MMA-py, 97%, Polysciences), potassium persulfate
(KPS, 99%, Aldrich Chemical Co.), sodium dodecyl sulfate (SDS, 98%, Merck) and sodium bicarbonate (99%, Synth) were used as supplied. Chloroform, dichloromethane and methanol, all from Merck, were of analytical grade.
Poly[2-methoxy-5-(2’-ethyl-hexyloxy)-p-phenylene-vinylene] (MEH-PPV,
M—n = 86 kg mol-1, Sigma-Aldrich Chemical Co.) was used as received.
Conventional emulsion copolymerization of the monomers STY, EHA and MMA-py were carried out using previously reported protocols.49-51
Methods
FTIR spectra of the copolymers were acquired using a Bomem MB-series model B-100 infrared
spectro-photometer by casting thin films of the copolymers from chloroform solutions over NaCl windows. All spectra were recorded at room temperature. Sixty-four scans were signal-averaged at a resolution of ca. 2 cm-1 over the spectral range of 4000-600 cm-1.
The high-resolution 1H and 13C NMR spectra of the copolymers were recorded using a Bruker AC300/P, 300-MHz FT-NMR spectrometer operating at resonance frequencies of 300.15 and 75.048 MHz for 1H and 13C, respectively, using CDCl3 as solvent and tetramethylsilane as internal standard.
The molar contents of the styrene and 2-ethylhexyl acrylate units in the copolymers were determined using integration data from the 13C NMR spectra over the carbonyl and phenyl regions, whereas the molar contents of the 1-methylpyrenyl methacrylate moieties was determined spectrophotometricaly by building a calibration curve from standard solutions of MMA-py in dichloromethane (with concentrations ranging from 5×10⁻⁷ to 5×10⁻⁵ mol L-1) and then measuring the absorbance of polymer samples in dichloromethane solution.
Molecular weight and molecular weight distributions of the copolymers were evaluated by gel permeation chromatography (GPC), using a linear µStyragel column (American Polymer Standards Co.) at 40 oC coupled to a refractive index detector (Waters 410), with THF as the eluent. Monodisperse polystyrene standards were used as the calibration standards. Values for the molecular weights and for the polydispersities of PS-py, SEHAMA-py-9 and
SHEAMA-py-19 are shown in Table 1, where 9 and 19
are the mol% of EHAMA in the respective blends. The glass transition temperatures of these films were determined by differential scanning calorimetry (DSC) carried out in a model v2.2A 90 DSC from DuPont, and calibrated with indium as standard. Two scans were performed for every sample: the first scan heated the sample from room temperature to 150 oC; then the sample was quenched at -100 oC and, finally, it was heated again to 150 oC. Thermograms were scanned at a scan rate of 10 oC min-1 and the T
g values were determined with the inflection point method from the second heating run.
Electronic absorption spectra were measured on a Hewlett-Packard-8452A UV-Vis spectrometer with a diode
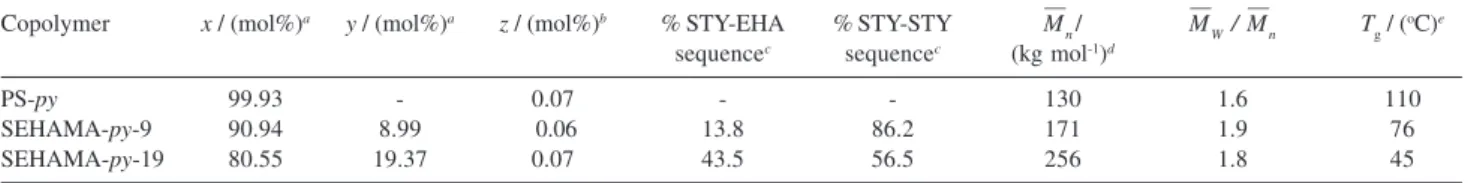
Table 1. Some physical properties of the PS-py, SEHAMA-py-9 and SEHAMA-py-19
Copolymer x / (mol%)a y / (mol%)a z / (mol%)b % STY-EHA % STY-STY M—
n / M
— W / M
—
n Tg/ (oC)
e sequencec sequencec (kg mol-1)d
PS-py 99.93 - 0.07 - - 130 1.6 110
SEHAMA-py-9 90.94 8.99 0.06 13.8 86.2 171 1.9 76
SEHAMA-py-19 80.55 19.37 0.07 43.5 56.5 256 1.8 45
array detector. Films were held in a solid state sample holder.
The fluorescence quantum yields, ΦF, of the polymers and copolymers with pyrenyl moieties were determined relative to 9,10-diphenylanthracene (DPA) in ethanol (ΦF
= 0.95) according to the relation: 56
(1)
where the subscripts s and u indicate the standard (DPA) and unknown sample (copolymers), respectively, A(ν) is the absorbance of the solution at the exciting frequency ν, Φs is the quantum yield of standard,
integrals are the integrated luminescence
spectra, and nj are the refractive indices of the pure solvent (for ethanol ns = 1.3611, T = 20 oC) and for the copolymers, n
u was estimated using:
(2)
where nPS is the refractive index of polystyrene [1.592 (20 oC)], c
PS is the weight fraction of the styrene units, and nPEHA is the refractive index of poly(2-ethylhexyl acrylate) (1.481, T = 20 oC).57
Preparation and characterization of the blends
Films of PS-py/MEH-PPV, SEHAMA-py-9/MEH-PPV
and SEHAMA-py-19/MEH-PPV blends were prepared by
casting and by spin-coating from 1.7% wt/V chloroform solutions yielding materials with several compositions of MEH-PPV (0, 0.1, 0.5, 1 and 5 wt%). Spin-coated films were prepared on quartz substrates at 2000 rpm during 30 seconds in a Hedway Research Inc. model PWM32 spinner. The films were then dried for a day in an oven at 50 oC under dynamic vacuum to remove residual solvent. Then they were annealed at 100 oC under dynamic vacuum in an oven for 12 hours to minimize the thermal stress and erase thermal histories. Film thickness was approximately 300 nm measured by inspecting the film fracture surface with a Jeol JSM-6360LV scanning electron microscope. Samples were sputtered with gold/palladium (80/20) alloy in a Bal-Tec MED 020 MCS 010 before scanning. Images were recorded with an accelerating voltage of 10 kV. This microscope was also used to examine the surface topology of the blends.
Epifluorescence microscopy (EFM) was performed as already described using a Leica DM IRB inverted microscope according the experimental procedure already established.49-51
Steady-state fluorescence spectroscopy was performed using an ISS-PC1 spectrofluorimeter with a photon counting detection system in back-face illumination. The samples were excited at 348 and 460 nm and the fluorescence emissions were collected in the range of 360-690 nm and 480-720 nm. Excitation spectra were collected in the range of 230-360 nm, using λem = 370 nm.
Fluorescence lifetimes were obtained by time correlated single photon counting (TCSPC) in an Edinburgh Analytical Instruments FL 900 spectro-fluorimeter. Excitation was carried out by a pulsed hydrogen flash-lamp controlled by a thyratron tube operating with a frequency rate of 40 kHz. The sample is maintained in a sealed quartz cuvette under vacuum.
Measurements were performed with λexc = 348 nm
collecting the emission signal at λem = 377 nm for the decay from the pyren-1-yl groups. For a lifetime analysis based on the single-photon-counting technique, the model response function G(t) is the theoretical impulse decay function I(t) convoluted with the instrument response function R(t), as previously described.49-51
Results and Discussion
Copolymer characterization
The copolymers were characterized by FTIR spectroscopy showing several typical vibrational modes: symmetric stretching vibrations (νs) of the CH2 groups at 2924 cm-1 (PS-py) and ν
a at 2952 cm-1/2925 cm-1
(SEHAMA-py-9) and νs at 2956 cm-1/2927 cm-1
(SEHAMA-py-19); νs(C=O) at 1730 cm-1 (SEHAMA-py-9 and SEHAMA-py-19); in plane bending vibrations β(CH3) groups at 1452 cm-1; β(CH
2) at 1492 cm-1; rocking vibrations of CH2 at 757 cm-1 (PS-py and SEHAMA-py -9) and at 759 cm-1 (SEHAMA-py-19); skeletal vibrations of polymer backbone at 1153 cm-1 (PS-py), 1159 cm-1
(SEHAMA-py-9) and 1162 cm-1 (SEHAMA-py-19);
ν(–C-O-C-) at 1068 cm-1; β(CH
3) at 1371 cm-1 (PS-py), 1377 cm-1 (SEHAMA-py-9) and 1379 cm-1 (SEHAMA-py-19); bands characteristic of the phenyl groups: ν(–C-C) at 1601 cm-1; out of plane γ
(C-H) angle deformation at 698 cm-1 (PS-py and SEHAMA-py-9) and 700 cm-1 (SEHAMA-py-19);
ν(–C-H aromatic) at 3026 cm-1.
The proton NMR spectra of the SEHAMA-py
copolymers show chemical shifts from phenyl protons in the region of 6.4-7.8 ppm and methyleneoxy protons (-OCH2-) in the region of 3.4-4.0 ppm (SEHAMA-py-9
and SEHAMA-py-19). The chemical shifts from the
methyne (-CH-) and methylene groups (-CH2-) in the
The resonance peaks from methyl groups (-CH3) in these copolymers appear in the region of 0.7-1.1 ppm
(SEHAMA-py-9 and SEHAMA-py-19). The peak of the
solvent (CDCl3) appears at 7.27 ppm.
The 13C NMR spectra of SEHAMA-py copolymers in
CDCl3 (76.5-77.9 ppm) show resonance peaks from:
carbonyl groups at 175.5-176.6 ppm (SEHAMA-py-9) and 175.3-176.6 ppm (SEHAMA-py-19); carbon of the phenyl rings attached to the polymer chain at 144.3-146.5 ppm (PS-py), 143.7-146.6, ppm (SEHAMA-py-9) and 142.4-146.6 ppm (SEHAMA-py-19); the other carbons from the styrene units at 124.2-128.3 ppm (PS), 124.5-129.9, ppm
(SEHAMA-py-9) and 124.5-130.1 ppm (SEHAMA-py
-19); methyleneoxy groups (-OCH2-) at 66.1-67.8 ppm
(SEHAMA-py-9 and SEHAMA-py-19); methyne groups
of styryl units (φ-Cα-H) at 58.0-59.1 ppm; methylene groups from the polymer backbone at 39.9-47.5 ppm
(PS-py) and 37.6-47.5 ppm (SEHAMA-py-9 and
SEHAMA-py-19); and methyl groups at 11.3-14.7 ppm
(SEHAMA-py-9 and SEHAMA-py-19).
Molar fractions of the styryl and acrylic monomer units in the copolymers (x, y in Figure 1, listed in Table 1) were determined by integration of the areas in the carbonyl and phenyl group regions from the 13C NMR spectra in CDCl3. As shown in the Table 1, the SEHAMA-py-9 and SEHAMA-py-19 copolymers contain approximately 9 and 19 mol% of 2-ethylhexyl methacrylate units, respectively, and hence they also contain 91 and 81 mol% of styryl units, respectively. The 13C NMR spectra also allowed a quantitative analysis of the monomer sequences in the
SEHAMA-py-9 and SEHAMA-py-19 copolymers,
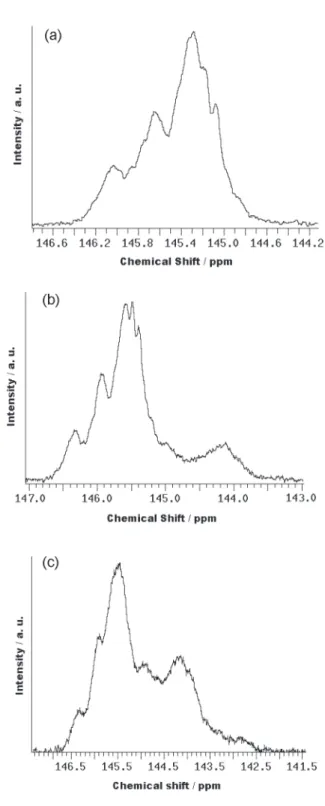
regarding the styryl and acrylic units by evaluation of the integrated areas of the Cα-methynic units of the styryl units (142.4-146.6 ppm). The molar percentage of styryl-styryl and styryl-styryl-acrylic sequences was determined by integrating the areas of the peaks at the region of 146.6-144.8 (chemical shifts concerning to adjacent styryl units) and of 144.7-142.4 ppm (chemical shifts concerning to styryl units in electron-withdraw microenvironments such as acrylic neighborhoods) (Figure 2).
The molar contents of 1-pyrenylmethyl methacrylate (MMA-py) were z≈ 0.07% for all copolymers. These values were determined using a calibration curve (not shown) from the absorbance in the UV-Vis spectral range of the copolymer in a chloroform solution and employing the molar extinction coefficient of ε346 = 29254 L mol-1 cm-1.46,47
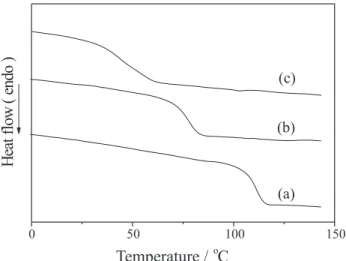
According to DSC curves, all copolymers are completely amorphous materials with a single glass-transition temperature, which decreases with the increase of EHA molar content, the component with the lowest glass transition temperature (Table 1).
Photophysical properties of the neat polymers
The electronic absorption spectra of PS-py and its copolymer films are similar to those usually seen for pyrenyl moieties, being red-shifted by 10 nm compared to pyrene.46,52-55 The steady-state fluorescence spectra of the pyrenyl moieties appear from 370 to 450 nm being
Figure 2.13C NMR spectra in CDCl
3 in the region of the Ca-methynic
composed of four vibronic bands: two of higher intensities, centered at 376 and 396 nm and two broader and weaker shoulders at 386-392 nm and 412-420 nm (Figure 4).46,52-55 No excimer emission was detected wither by steady-state fluorescence of by fluorescence decay at 480 nm. Therefore, we assumed that not only the concentration is low but also that there is no local concentration of pyrenyl moieties along the polymer chain. Although the fluorescence emission of the pyrenyl moieties is less sensitive to polarity, we still observe that the intensity ratio between the third and the first vibronic bands I3/I1 (I1 at λem = 376 nm and I3 at λem = 388 nm) depends on the polarity of the medium, being lower for PS-py compared with both SEHAMA-py copolymers (Table 2).46,52-55
The fluorescence quantum yields (ΦF) of the pyrenyl groups in all polymer and copolymers were determined using equation 1 and DPA as standard.56 As we can see, the fluorescence quantum yield increases with the amount of the comonomer 2-ethylhexyl acrylate (EHA) and hence increases with the polarity of the medium. The values obtained here match those for the quantum yields (relative to anthracene) of attached-py in several polymers.55
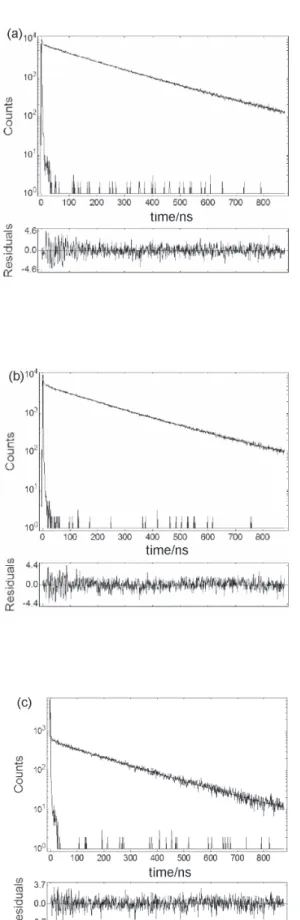
Additional insights for the local environment experienced by the attached pyrenyl groups were provided
from fluorescence lifetimes obtained in cast film samples by the time correlated single-photon counting method (Figure 5). Data were collected with λexc = 348 nm, corresponding to the lower-lying vibronic band of the absorption spectra and monitoring the emission at the higher energy fluorescence band (λem = 377 nm).
The decay curves were well fitted using three exponential functions (equation 3):
(3)
where the τi is the fluorescence lifetime and the Bi is the corresponding pre-exponential term. The fit was considered acceptable if no systematic deviations from zero were seen in the corresponding residual plots and χ2 were close to 1. The very fast decay components from scattered light were neglected for analysis purposes. Because of the spectral overlap between the pyrenyl emission and MEH-PPV absorption, there are several
Figure 4. Normalized electronic absorption and fluorescence spectra of
spin coated polymer films: pyrenyl moieties of SEHAMA-py-9 copoly-mer absorption (---) and emission (—) (λexc = 348 nm); blend of MEH-PPV (0.1 wt%) and polystyrene - absorption (−⋅−⋅−⋅−⋅) and emission (⋅⋅⋅⋅⋅⋅) (λexc = 460 nm). The filled area represents the spectral overlap between pyrenyl group emission (donor) spectrum and the MEH-PPV absorption spectrum (acceptor).
Table 2. Some photophysical properties for PS-py, SEHAMA-py-9, and SEHAMA-py-19
copolymer ΦFa I
3/I1b τ1 / (ns) c τ2 / (ns) χ2 R0 / (Å)e
PS-py 0.38 0.92 0043.6 ± 6.0 (1.9%)d 203 ± 1 (83.2%) 1.46 52
SEHAMA-py-9 0.85 0.87 34.4 ± 4 (2.1%) 204 ± 1 (90.3%) 1.31 61
SEHAMA-py-19 0.92 0.85 028 ± 8 (2.1%) 209 ± 2 (83.1%) 1.18 63
aFluorescence quantum yield determined using DPA as standard; bI
3 was taken at λem = 388 nm and I1 at λem = 376 nm (equation 3); cDecay curves were
collected at λem = 377 nm using λexc = 348 nm. Fluorescence lifetimes were determined by deconvolution with tri-exponential functions; dThe percentage between parentheses refers to the relative contributions of each exponential component. eFörster radii for the copolymer (donor)/MEH-PPV (acceptor) pair determined from evaluation of the overlap integral J(l) (equation 4).
Figure 3. DSC traces (second run) for (a) PS-py, (b) SEHAMA-py-9 and
possibilities for the energy transfer processes, each one with a specific time-distance correlation. Among them, energy migration, trivial energy transfer and Förster mechanisms should play important role. This is the reason which we employed exponential function decay instead of some for a particular type of mechanism.
Two lifetime decays were observed for the emission of the copolymers containing the pyrenyl moieties: a shorter-lived decay (τ1 = 28 to 40 ns) (Table 3) that decreases with an increase in EHAMA comonomer; and a long-lived decay (τ2 = 203 to 209 ns) that increases with EHAMA comonomer, in agreement with the decrease in the fluorescence quenching efficiency already observed from the fluorescence quantum yield data. Similar values for biexponential decays of pyrene model compounds [α,ω-bis(1-pyrenyl)alkanes] in polyethylene (PE) hosts (τ1 ~ 40-60 ns; τ2 ~ 200 ns) have previously been reported.55 This biexponential behavior should be attributed to differences of the random distribution of the comonomer blocks: some of the pyrenyl moieties could be located close to the styrene blocks while others could be closer to the acrylic blocks. Because the shorter lived state is more influenced by the acrylic content than the long-lived state, we assume that the pyrenyl moieties confined near the EHAMA acrylic groups are more efficiently quenched.
Absorption and fluorescence spectra of 0.1 wt% MEH-PPV in the spin-coating PS blends (without pyrenyl moieties) are also shown in Figure 4. MEH-PPV absorbs at
λabs = 498 nm, with the emission band centered at λem = 598 nm. This emission spectra can be attributed to the intrachain exciton emission in condensed phase.2-4,6,58 Figure 4 shows the spectral overlap (shaded area in the range of 360-480 nm) between the electronic absorption spectrum of the MEH-PPV (acceptor) and the emission spectra of attached-pyrenyl groups (donor). If we assume that part of the NERT processes occurs by Förster mechanism, the probability should be proportional to the area covered by the spectral overlap. Under this assumption, the Förster distance, R0,
defining the distance between the donor and acceptor groups at which the energy transfer is 50% efficient can be estimated using (equation 4):59
(4)
where k is relative transition dipole orientation factor (k2 = 2/3 for a random distribution), ΦD0 is the fluorescence quantum yield of the donor (Table 2) in the absence of transfer, n is the average refractive index of the medium, ID(λ) is the fluorescence spectrum of the donor (pyrenyl
groups) normalized so that , εA(λ) is the
molar absorption coefficient of the acceptor (in L mol-1 cm-1) and λ is the wavelength in nanometers.
From the normalized fluorescence spectra of pyrenyl groups in each copolymer and the molar extinction coefficient of the MEH-PPV films, we obtained the values of the spectral overlap integral
[ ] as: 5.7763 × 10¹⁵ L mol-1
cm-1 nm4 for PS-py/MEH-PPV blends; 5.97415 × 10¹⁵ L mol-1 cm-1 nm4 for SEHAMA-py-9/MEH-PPV blends; and 5.9941 × 10¹⁵ L mol-1 cm-1 nm4 for SEHAMA-py -19/MEH-PPV blends. Assuming that the refractive index n of the blends is equal to that of the neat copolymer (the maximum composition of MEH-PPV was 5 wt%), the Förster distances (equation 2) R0 were estimated as:
5.2 nm for PS-py /MEH-PPV blends; 6.1 nm for
SEHAMA-py-9/MEH-PPV blends; and 6.2 nm for
SEHAMA-py-19/MEH-PPV blends. These values are
relatively larger when compared with R0 values for the donor/acceptor pairs of small molecules,46,47,59 although they are in agreement with R0 values reported for other
systems using MEH-PPV.34 As already discussed, one
possible reason for this larger value is that we are over estimating the spectral overlap area. Two other reasons, however, should also be considered: conjugated polymers can not behave as a spatially fixed point dipole but effectively are finite volume elements composed by
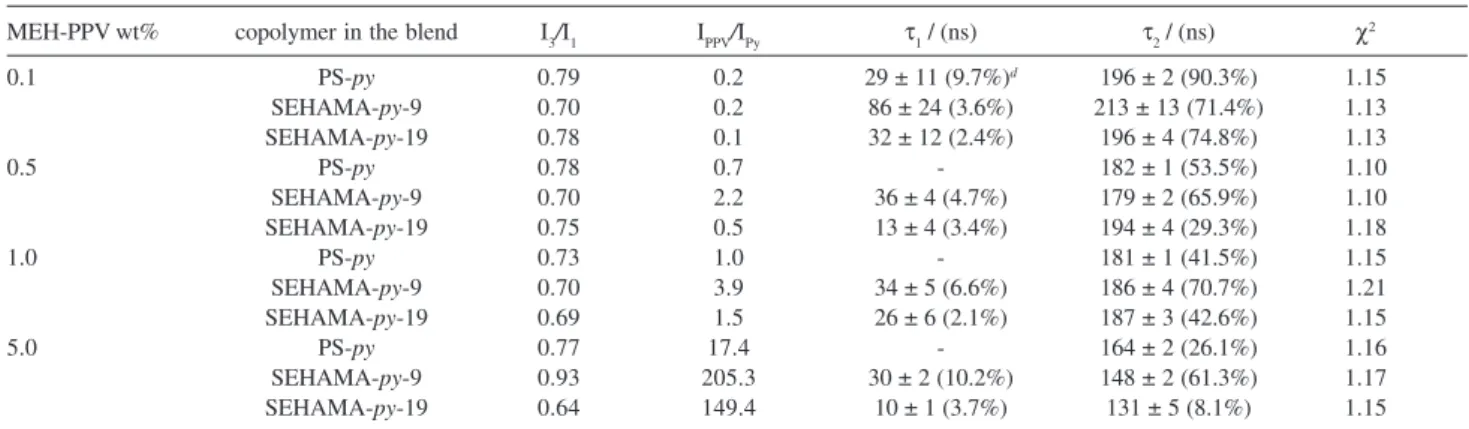
Table 3. Some photophysical properties of the blends PS-py/MEH-PPV, SEHAMA-py-9/MEH-PPV, and SEHAMA-py-19/MEH-PPV
MEH-PPV wt% copolymer in the blend I3/I1 IPPV/IPy τ1 / (ns) τ2 / (ns) χ2
0.1 PS-py 0.79 0.2 29 ± 11 (9.7%)d 196 ± 2 (90.3%) 1.15
SEHAMA-py-9 0.70 0.2 86 ± 24 (3.6%) 213 ± 13 (71.4%) 1.13
SEHAMA-py-19 0.78 0.1 32 ± 12 (2.4%) 196 ± 4 (74.8%) 1.13
0.5 PS-py 0.78 0.7 - 182 ± 1 (53.5%) 1.10
SEHAMA-py-9 0.70 2.2 36 ± 4 (4.7%) 179 ± 2 (65.9%) 1.10
SEHAMA-py-19 0.75 0.5 13 ± 4 (3.4%) 194 ± 4 (29.3%) 1.18
1.0 PS-py 0.73 1.0 - 181 ± 1 (41.5%) 1.15
SEHAMA-py-9 0.70 3.9 34 ± 5 (6.6%) 186 ± 4 (70.7%) 1.21
SEHAMA-py-19 0.69 1.5 26 ± 6 (2.1%) 187 ± 3 (42.6%) 1.15
5.0 PS-py 0.77 17.4 - 164 ± 2 (26.1%) 1.16
SEHAMA-py-9 0.93 205.3 30 ± 2 (10.2%) 148 ± 2 (61.3%) 1.17
several conjugated units; excitations in conjugated polymers are able to migrate incoherently. Therefore, although our approach was not completely adequate for describing all possibilities of energy transfer processes, some insights about interchain interpenetration have been obtained.60
Photophysical properties of the neat polymers
The emission bands of the spin coated MEH-PPV blends are composed of two sets of bands: one at higher energy (from 360 to 470 nm) attributed to the pyrenyl fluorescence and the other at lower energy (from 540 to 660 nm) attributed to the MEH-PPV emission. The relative intensity of these two bands depends on the relative composition and on the efficiency of the NERT processes (Figure 6). In other words, the IPPV/IPy is proportional to the energy transfer efficiency from the donor (copolymer) to the acceptor (MEH-PPV). Although the band profiles at the higher energy (pyrenyl moieties) are almost invariant with the composition, the band profile of the MEH-PPV emission depends on the composition and on the type of the copolymer. For example, a broader, blue-shifted band was observed for
the 0.1 wt% SEHAMA-py-9/MEH-PPV blends (Figure
6a) when compared with the higher concentration blends (Figure 6b,c,d). The emission band can be decomposed into two components, one centered at 550 nm and other at 600 nm. These two simultaneous emissions can be attributed to the presence of both isolated intrachain and interchain excitons. As already reported, the presence of intrachain excitons require isolated MEH-PPV chains that can not transfer energy to the lower energy traps.54-61 Therefore, the simultaneous observation of the presence of the intrachain exciton emission and the greater efficiency of the NERT process require confinement of the MEH-PPV chains by the host chains, which should be a consequence of improvement in the polymer miscibility.
We also observe that, for the same composition, the intensity ratio IPPV/IPy (Table 3) is always greater for the SEHAMA-py-9 copolymer blends. This is evidence for a higher interpenetration of the polymer chains of the MEH-PPV and the pyrenyl-labeled copolymers. In addition, this ratio also increases with the increase of MEH-PPV. Nevertheless, it does not follow a linear relationship with composition. For example, while the IPPV/IPy ratio (Table 3) in Figure 6b increases about 5 times for the 0.5 wt%
MEH-PPV blend with PS-py and SEHAMA-py-19,
compared with the 0.1 wt% (equivalent to the increase of the concentration), it increases more than 10 times for
Figure 5. Fluorescence decays for the copolymers containing pyrenyl
moieties: (a) PS-py, (b) SEHAMA-py-9 and (c) SEHAMA-py-19, using
the blend with the SEHAMA-py-9, demonstrating that the Förster energy transfer is really important for this copolymer. We also observed that the IPPV/IPy ratio forthe
0.1wt% PS-py/MEH-PPV and SEHAMA-py
-19/MEH-PPV blends is a little smaller than that expected for the increase of the amount of MEH-PPV (2 times more than the 0.5 wt% blend) whiles the ratio for the SEHAMA-py -9/MEH-PPV is the expected value (Figure 7). As discussed earlier, smaller values indicate higher efficiencies of the NERT process that requires interpenetration of the donor
and acceptor chains. Thus, SEHAMA-py-9/MEH-PPV is
at the limit of miscibility, while this limit is not achieved for the other two blends.
The intensity ratio IPPV/IPy determined from the steady-state fluorescence spectra (Figure 6) for 5 wt% MEH-PPV blends was much higher than that expected for an additive function of the composition (Table 3). There are at least two important reasons for this behavior: the first is the usual NRET process already described, which decreases the relative intensity of the donor; the second is the radiative energy transfer process taking place in higher concentration systems, producing the inner filter effect. This latter effect is particularly important in heterogeneous systems with the acceptor component exhibiting greater absorption extinction coefficients, as is the case of MEH-PPV, and with a stronger overlap between the donor and acceptor species, as is the case of the pair of pyrenyl/MEH-PPV systems. Additional evidence for the relative importance of the inner effect is the apparent red shift of the emission band of MEH-PPV, where the blue-edge of the band is strongly suppressed. Because both the miscibility is higher and the MEH-PPV absorption extinction coefficient is greater, both processes are occurring simultaneously.
Two other photophysical parameters that can be useful to analyze polymer blend miscibility are I3/I1, which is a
measurement of the system polarity, and τ2, the
fluorescence lifetime that decreases in lower polarity systems and in systems undergoing NERT processes by the Förster mechanism. These two sets of data are summarized in Table 3 for the spin-coated MEH-PPV blends with all copolymers. As can be seen, the I3/I1 ratio for PS-py and SEHAMA-py-19 copolymers are similar
and higher than for the SEHAMA-py-9/MEH-PPV blends
while all of them remains almost constant up to 1.0 wt% of MEH-PPV. Nevertheless, the polarity sensed by the pyrenyl groups is always greater than that sensed in the neat copolymer. The I3/I1 ratio (Table 3) for the 1.0 wt% MEH-PPV blend is smaller for all blends when compared with the lower concentration blends (0.1 and 0.5 wt% MEH-PPV), suggesting that the pyrenyl microenvironment is more polar above this amount.
Figure 6. Steady-state fluorescence spectra (λexc = 348 nm) of spin coated
The fluorescence decays of the pyrenyl moieties in the blends can also be represented by a bi-exponential function, as already observed for the neat copolymers, independent of the composition (Figures not shown). The longer (around 200 ns) and the shorter (10-30 ns) decays are always faster than with the neat copolymer and they decrease with the increase of the amount of MEH-PPV (Table 3). Here we consider that τ2, the longer lifetime component, corresponds to the lifetime of the pyrenyl moieties not disturbed by other component of the blend and appears as the component with greater relative contribution. The faster τ2 lifetimes compared with the neat copolymers suggested that there are some pyrenyl moieties undergoing NERT process (Table 3). This means that some pyrenyl groups are surrounded by the MEH-PPV acceptor units within the Förster radius, which requires some miscibility between these two components. Some further evidence of miscibility arises from analysis of the morphology. Since the amount of the MEH-PPV increases, the longer lifetime decay undergoes a remarkable decrease. As we showed earlier, this decrease results from a synergistic effect of two contributions: an increase of the miscibility and an increase of the polarity and, thus, the efficiency of the NERT can not be calculated using equation 4.
Therefore, the results of the steady-state and dynamic fluorescence measurements demonstrate that these blends undergo interchain interaction on the nanoscopic scale, whose extent depends on the relative composition of each
component and on the structure of the copolymer. It seems that the composition with greater NERT efficiency is that where that amount of the comonomer in the polystyrene copolymer is 9 mol%. This conclusion arises from measurements obtained for samples with area around 1 cm2 and reflects an average behavior and not the behavior of specific domains.
Morphology of the copolymers/MEH-PPV blends
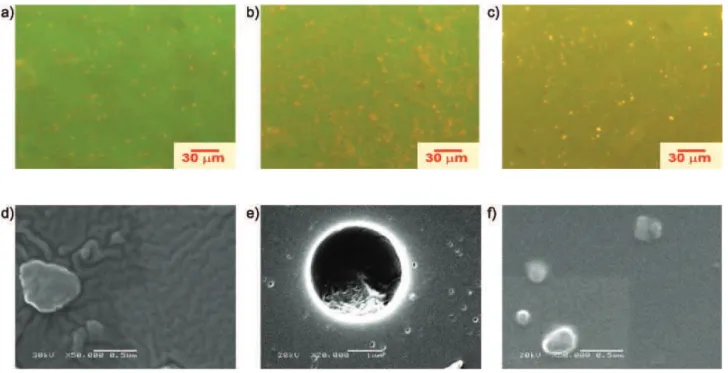
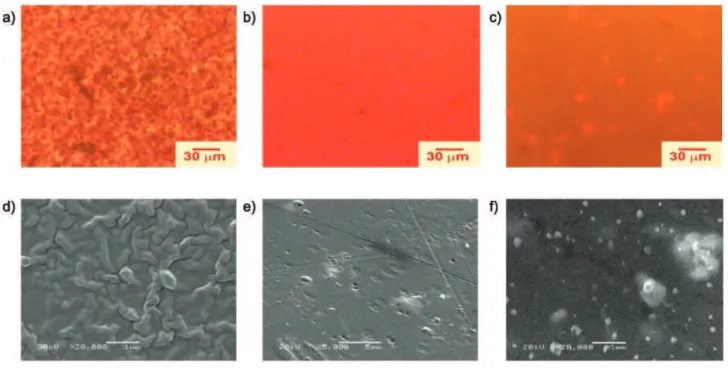
Figures 7a-c show EFM micrographs of the 0.1% wt MEH-PPV spin-coated and annealed blends, where the bright yellow spots arise from the emission of MEH-PPV domains dispersed over a green matrix composed of the pyrenyl-acrylate copolymer. These micrographs also reveal an increase of the yellow color with the increase of the amount of the EHAMA comonomer. These two emissions are in agreement with the steady state fluorescence spectra where we observed a higher energy emission originating from the pyrenyl moieties and a lower energy emission form MEH-PPV chains. In addition, SEM micrographs reveal that the PS-py/MEH-PPV blend (Figure 7d) exhibits a morphology with interconnected domains involving the mechanism of phase separation by spinodal decomposition,
whereas the SEHAMA-py-9/MEH-PPV blend shows a
morphology of a dispersed droplets in a continuous matrix (Figure 7e), characteristic of phase separation by a nucleation-growth mechanism where MEH-PPV spherical domains have diameters up to 3 µm.
Figure 7. EFM (top) and SEM (bottom) micrographs of the spin coated blends with 0.1 wt% MEH-PPV with: (a) and (d) PS-py, (b) and (e) SEHAMA-py
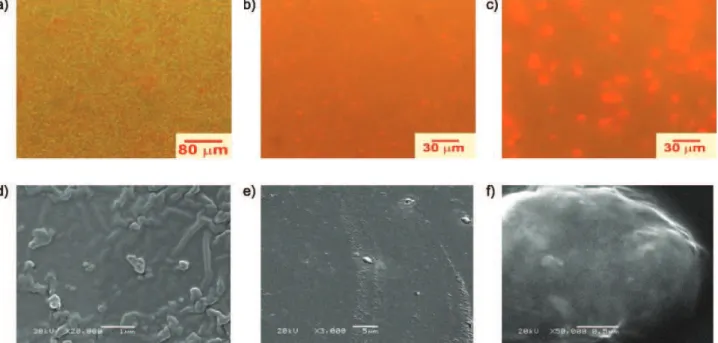
Similar analysis using EFM were performed for blends of the SEHAMA-py and PS-py copolymers with 0.5 wt%, 1 wt% and 5 wt% of MEH-PPV whose exhibit a reddish emission predominating over the blue emission of the pyrenyl groups when the amount of the conjugate polymer increases. Figures for epifluor-escence microscopy and for electron scanning microscopy were showed as Figures S1, S2 and S3 in the Supplementary Information. These data are in agreement with the two emission bands, one centered at 600 nm and other at 400 nm, observed in steady-state fluorescence spectra depicted in the Figure 6. These data are also in agreement with the spectra shown in Figure 6 and the data summarized in Table 3. Remarkable micromorphological differences for the blends with 0.5 wt% of MEH-PPV related to the sizes
and shapes of the MEH-PPV domains: for the PS-py/
MEH-PPV blend (Figure S1, d) the morphology is composed of bicontinuous interconnected phases, while the blends with SEHAMA- py (Figure S1, e, f) show a
morphology with droplets of MEH-PPV dispersed in the copolymer matrix. Larger droplets with diameters as large as ~10 µm were observed for SEHAMA-py-19 and a very uniform surface and very small MEH-PPV
droplets were noted for the SEHAMA-py-9/MEH-PPV
blends. This greater miscibility has also been observed from steady-state and dynamic emission spectroscopy, as shown in Figure 6 and Table 3.
The morphologies of the 1.0 wt% MEH-PPV spin-coated and annealed blends (Figure S2) obtained either by EFM or by SEM show: interconnected phases with rough surfaces for the PS-py/MEH-PPV blend produced by the spinodal decomposition phase separation mechanism (Figure S2, a, d); very uniform roughness surface and a complete miscibility for the
SEHAMA-py-9/MEH-PPV blend (Figure S2, b, e); discrete
droplets (diameters lesser than 1 mm) of MEH-PPV dispersed in a red fluorescent matrix for the SEHAMA-py-19/MEH-PPV blend (Figure S2, c, f,) resulting from a phase separation by the nucleation-growth mechanism. The presence of the very uniform and
smooth surface for the SEHAMA-py-9/MEH-PPV blend
(Figure S2, e) indicates that the system having this composition is completely miscible, as also suggested by its photophysical properties (the fluorescence lifetime and the IPPV/IPy intensity ratio). The same happens with the red fluorescent continuous phase of
the 1 wt% SEHAMA-py-19/MEH-PPV blend (Figure
S2) where both copolymer and MEH-PPV form the continuous phase (the matrix) while the dispersed phase is composed of neat MEH-PPV. Again, this result
confirms the photophysical data, where the IPPV/IPy intensity ratio increases more than expected from the MEH-PPV amount while the lifetime decreases, in agreement with enhancement of miscibility.
Similar morphological analyses can be performed for the 5 wt% MEH-PPV spin-coated and annealed blends using EFM and SEM microscopies (Figure S3). Again
blends with PS-py/MEH-PPV contain interconnected
phases, although some discrete droplets of MEH-PPV and more pronounced surface roughness can also be observed (Figure S3, a, d). Blends with a more uniform surface roughness can be prepared using both the
SEHAMA-py-9 (Figure S3, b, e) and the SEHAMA-py
-19 copolymers (Figure S3, c, f). These results demonstrate the higher solubility of the MEH-PPV in the copolymers, compared to polystyrene, in agreement with the photophysical studies. Some surface roughness
is present for the SEHAMA-py-9/MEH-PPV blend,
suggesting that we are close to the limit of miscibility. Therefore, we can conclude that the miscibility is strongly correlated with the structural properties of the copolymer, represented by the relative composition of the acrylate component.
Remarks on the effect of copolymer structure on miscibility
The overall interaction parameter B for a blend
comprised of the polymer MEH-PPV and the copolymer
SEHAMA-py is given by the pseudobinary interaction
model:62,63
(5)
where the φ’i describe the copolymer composition and
φ’EHA + φ’S = 1.
Here we assume that the amount of the 1-pyrenyl-methyl methacrylate comonomer is negligible (≤ 0.07 mol%) and hence this comonomer does not significantly interfere with the other comonomer interactions. Thus, according to the pseudobinary interaction model, under the limit of a high molecular weight condition,
SEHAMA-py and MEH-PPV form a miscible system
only if mixing is exothermic, i.e., B < 0, which requires that either a mutual repulsion occurs between the constituents of the copolymer (very high and positive
value of BEHA-S), or that the components undergo
specific interactions resulting in an exothermic enthalpy of mixing (negative or relatively small values of BEHA-MEHPPV and BS-MEHPPV).
Here we assume that the miscibility of SEHAMA-py
Because the glass transition temperatures of the copolymers are not high, interchain interpenetration among the copolymers and MEH-PPV are possible. Nevertheless, polystyrene has a higher glass transition temperature (Table 1) and possesses a rigid coil resulting in a poor surface unable for undergoing specific interactions between the phenyl rings of both the PS and the MEH-PPV chains. Consequently, the available contacts between styryl and vinylene phenylene mers require additional energy to provide further flexibility to the chain coils. Upon doing this, BS-MEHPPV reaches a negative or relatively small value, contributing to a more favorable interaction parameter B. In addition to the interactions with the phenyl rings, further contributions to the specific interactions are provided by the interaction between 2-ethylhexyloxy-sided groups present in both MEH-PPV and the acrylic component of the copolymers and, as a result, the term BEHA-MEHPPV assumes a negative value or close to it. Because this segment is flexible at room temperature,4 close contact can be easily established.
Because the increase of the mol% of EHA
como-nomer in the copolymer (from SEHAMA-py-9 to
SEHAMA-py-19) results in a smaller quantity of phenyl rings available for the interactions, we expect an increase
of the BS-MEHPPV value for the MEH-PPV/copolymer
blends. On the other hand, we observe that miscibility increases when the copolymer is used instead of
polystyrene and, particularly when SEHAMA-py-9 is
employed. Consequently, the copolymer effect (mutual repulsion expressed by the term BEHA-S) may play an important role in the miscibility of SEHAMA-py
/MEH-PPV blends. The polarity of a SEHAMA-py copolymer
segment is a statistical average of the two mers in a random distribution. A favorable intermolecular secondary force can be expected if the polarity in the
SEHAMA-py copolymer is close to or matches that of
the MEH-PPV homopolymer.61 Thus, the range of
composition of EHA comonomer that satisfies the requirement of counterbalancing the polarity must correspond to the miscibility window for the blend
SEHAMA-py/MEH-PPV. Our results using steady-state
and dynamic fluorescence spectroscopy indicate that the
SEHAMA-py-9 copolymer is the one that best matches
the polarities of the both components in the blend, which, from the morphological point of view, produces greater miscibility.
Conclusions
Pyrenyl-labeled copolymers of styrene with three different contents of 2-ethylhexyl acrylate comonomer [0
(PS-py), 9 (SEHAMA-py-9) and 19 (SEHAMA-py-19)
mol%] were synthesized, characterized and blended with MEH-PPV in several relative compositions: 0.1, 0.5, 1.0, and 5.0 wt% MEH-PPV. We found a strong dependence of the photophysical properties of the pyrenyl moieties with the acrylic content in the copolymer. The miscibility of the MEH-PPV and PS and copolymer blends was studied using non-radiative energy transfer from pyrenyl groups (donor) to MEH-PPV (acceptor) with the
SEHAMA-py-9/MEH-PPV blends showing the greatest
miscibility. The morphologies of all the MEH-PPV blends were analyzed by scanning electron microscopy (SEM) and epifluorescence microscopy (EFM) and the results from both techniques agree with the photophysical methods. In the compositions studied here (up to 5 wt%),
blends with PS-py exhibited morphologies of
interconnected phases characteristic of a spinodal
decomposition mechanism, whereas the SEHAMA-py-19/
MEH-PPV blends showed spherical domains dispersed over the entire matrix that are characteristic of phase separation by the nucleation-growth mechanism. Blends
of SEHAMA-py-9/MEH-PPV are more miscible with
smooth surfaces. The miscibility pattern is discussed in terms of the specific interactions between the phenyl-phenylene vinylene and the ethylhexyloxy groups belong to the both components of the blend.
Acknowledgments
T. D. Z. Atvars and M. L. de Andrade thank FAPESP, CAPES, CNPq, MCT/PADCT/IMMP and Unicamp/ FAEPEX for financial support and fellowships. They also thank Prof. Carol Collins for useful discussions.
Supplementary Information
EFM and SEM micrographs of the spin coated blends with 0.5 wt%, 1 wt% and 5 wt% of MEH-PPV with PS-py, SEHAMA-py-9 and SEHAMA-py-19 are available free of charge at http://jbcs.sbq.org.br, as PDF file.
References
1. Miyata, S.; Nalwa, H. S.; Organic Electroluminescence Materials and Devices; Gordon and Breach: Tokyo, 1998. 2. Liu Y.; Liu M. S.; Li, X. C.; Jen, A. K. Y.; Chem. Mater.1998,
10, 3301.
3. Lee, T. W.; Park, O. O.; Adv. Mater.2000, 12, 801.
5. Kim, J.; Swager, M.; Nature2001, 411, 1030.
6. Nguyen, T.-Q.; Schwartz, B. J.; Schaller, R. D.; Johnson, J. C.; Haber, L. H.; Saykally, R. J.; J. Phys. Chem. B2001, 105, 5153.
7. Nguyen, T.-Q.; Doan, V.; Schwartz, B. J.; J. Chem. Phys.1999, 110, 4068.
8. Nguyen, T.-Q.; Martini, I. B. ; Liu, J. ; Schwartz, B. J.; J. Phys. Chem. B2000, 104, 237.
9. Nguyen, T.-Q.; Kwong, R. C.; Thompson, M. E.; Schwartz, B. J.; Appl. Phys. Lett.2000, 76, 2454.
10. Nguyen, T.-Q.; Yee, R. H.; Schwartz, B. J.; J. Photochem. Photobiol. A2000, 144, 21.
11. Greenhan, N. C.; Samuel, I. D. W.; Hayes, G. R.; Phillips, R. T.; Kessener, Y. A. R. R.; Moratti, S. C.; Holmes, A. B.; Friend, R. H.; Chem. Phys. Lett.1995, 241, 89.
12. Yan, M.; Rothberg, L. J.; Papadimitrakopoulos, F.; Galvin, M. E.; Miller, T. M.; Phys. Rev. Lett.1994, 72, 1104.
13. Chen, S.-H.; Su, A.-C.; Huang, Y. F. ; Su, C.-H.; Peng, G.-Y.; Chen, S.-A. Macromolecules 2002, 35, 4229.
14. Collison, C. J.; Rothberg, L. J.; Treemaneekarn, V.; Li, Y.; Macromolecules2001, 34, 2346.
15. Shi, Y.; Liu, J.; Yang, Y.; J. Appl. Phys.2000, 87, 4254. 16. Jakubiak, R.; Collison, C. J.; Wan, W. C.; Rothberg, L. J.; Hsieh,
B. R.; J. Phys. Chem. A1999, 103, 2394.
17. Wei, P. K.; Hsu, J. H.; Fann, W. S.; Synth. Met.1999, 102, 1209.
18. Hsu, J. H.; Wei, P. K.; Fann, W. S.; Chuang, K. R.; Chen, A. S.; Ultramicroscopy1998, 71, 263.
19. Lee, T.-W.; Park, O. O.; Cho, H. N.; Hong, J.-M.; Kim, C. Y.; Kim, Y. C.; Synth. Met. 2001, 122, 437.
20. Shim, H. K.; Kang, I. N.; Jang, M. S.; Zyung, T.; Jung, S. D.; Macromolecules1997, 30, 7749.
21. Halls, J. J. M.; Walsh, C. A.; Greenham, N. C.; Marseglia, E. A.; Friend, R. H.; Maratti, S. C.; Holmes, A. B.; Nature1995,
376, 498.
22. Yu, G.; Gao, J.; Hummelen, J. C.; Wudl. F.; Heeger, A. J.; Science 1995, 270, 1789.
23. Granström, M.; Inganäs, O.; Adv. Mater.1995, 7, 1012. 24. He, G.; Li, Y.; Liu J.; Yang, Y.; Appl. Phys. Lett.2002, 80, 4247. 25. Sartori, S. S. ; De Feyter, S.; Hofkens, J.; Van der Auweraer, M.; De Schryver, F.; Brunner, K.; Hofstraat, J. W.; Macromolecules2003, 36, 500.
26. Ding, L.; Karasz, F. E.; Lin, Z.; Liao, M. Z. L.; Pang, Y.; Macromolecules2001, 34, 9183.
27. Iyengar, N. A.; Harrison, B.; Duran, R. S.; Schanze, K. S.; Reynolds, J. R.; Macromolecules2003, 36, 8985.
28. Bjorklund, T. G.; Lim, S.-H.; Bardeen, C. J.; Synth. Met. 2004, 142, 195.
29. Blumstengel, S.; Sokolik, I.; Dorsinville, R.; Voloschenko, D.; He, M.; Lavrentovich, O.; Chein, L. C.; Synth. Met. 1999,
99, 85.
30. Nishino, H.; Yu, G.; Heeger, A. J.; Chen, T. A.; Rieke, R. D.; Synth. Met. 1995, 68, 243.
31. Hu, D.; Yu, J.; Barbara, P. F.; J. Am. Chem. Soc.1999, 121, 6936.
32. Hu, D.; Yu, J.; Wong, K.; Bagchi, B.; Rossky, P. J.; Barbara, P. F.; Nature (London)2000, 405, 1030.
33. Crenshaw, B. R.; Weder, C.; Chem. Mat.2003, 15, 4717. 34. Lee, J. S.; Kim, C. H.; Yu. J.-W.; Kim, J. K.; Kim, D. Y.; Song, N.
W.; Kim, C. Y.; J. Polym. Sci. A: Polym. Chem. 2004, 42, 557. 35. Palilis, L. C.; Lidzey, D. G.; Redecker; M.; Bradley, D. D. C;
Inbasekaram, M.; Woo, E. P.; Wu, W. W.; Synth. Met. 2000, 111, 159.
36. Granström, M.; Inganäs, O.; Appl. Phys. Lett.1996, 68, 147. 37. Chao, C. S.; Whang, W. T.; Chuang, K. R.; J. Polym. Res. 2000,
7, 175.
38. Babel, A.; Jenekhe, S. A.; Macromolecules2004, 37, 9835. 39. Utracki, L. A.; Polymer Alloys and Blends: Thermodynamics
and Rheology, Hanser: Munich, 1989.
40. Muller, G.; Schwahn, D.; Eckerlebe, H.; Rieger, J.; Springer, T.; J. Chem. Phys.1996, 104, 5326.
41. Hack, T.; Abetz, V.; Stamm, M.; Schubert, D. W.; Mortensen, K.; Siol, W.; Colloid Polym. Sci. 1996, 274, 350.
42. Alam, M. M.; Tonzola, C. J.; Jenekhe, A. S.; Macromolecules
2003, 36, 6577.
43. Yu, J.-W.; Kim, J. K.; Cho, H. N.; Kim, D. Y.; Kim, C. Y.; Song, N. W.; Kim, D.; Macromolecules2000, 33, 5443.
44. Anni, M.; Gigli, G.; Paladini, V.; Cingolani, R.; Barbarella, G.; Favaretto, L.; Sotgiu, G.; Zambianchi, M.; Appl. Phys. Lett. 2000, 77, 2458.
45. Dogariu, A.; Gupta, R.; Heeger, A. J.; Wang, H.; Synth. Met.
1999, 100, 95.
46. Birks, J. B.; Photophysics of Aromatic Molecules, Wiley-Interscience: New York, 1970.
47. Berlman, I. B.; Energy Transfer Parameters of Aromatic Compounds, Academic Press: New York, 1973.
48. Atvars, T. D. Z.; Esteban, I.; Illera, B.; Serrano, B.; Vigil, M. R.; Piérola, I. F.; J. Lumin. 1997, 72, 467.
49. de Andrade, M. L.; Atvars, T. D. Z.; J. Phys. Chem. B2004,
108, 3975.
50. de Andrade, M. L.; Atvars, T. D. Z.; Macromolecules2004, 37, 9096.
51. de Andrade, M. L.; Atvars, T. D. Z.; Macromolecules2004, 37, 9626.
52. Yamaki, S. B.; Atvars, T. D. Z.; Weiss, R. G.; Photochem. Photobiol. Sci.2002, 1, 649.
53. Martins, T. D.; Yamaki, S. B.; Prado, E. A.; Atvars, T. D. Z.; J. Photochem. Photobiol. A: Chem.2003, 156, 91.
54. Danko, M.; Hrdlovic, P.; Borsig, E.; J. Macromol. Sci.-Pure Appl. Chem.2001, A38, 467.
56. Morris, J. V.; Mahaney, M. A.; Huber, J. R.; J. Phys. Chem.
1976, 80, 969.
57. Brandrup, J.; Immergut, E. H.; Dowell, W. Mc., eds.; Polymer Handbook, Wiley-Interscience: New York, 1975.
58. Cossiello, R. F.; Akcelrud, L.; Atvars, T. D. Z.; J. Braz. Chem. Soc.2005, 16, 74.
59. Valeur, B.; Molecular Fluorescence: Principles and Applications; Wiley-VCH: Weinheim, 2002.
60. Bagnich, C. I.; Bässler, D. N.; Scherf, U.; Chem. Phys.2004, 299, 11.
61. Vanden Bout, D. A.; Yip, W.-T.; Hu, D.; Fu, D. K.; Swager, T. M.; Barbara, P. F.; Science1997, 277, 1074.
62. Paul, D. R.; Barlow, J. W.; Polymer1984, 25, 487.
63. Woo, E. M.; Mandal, T. K.; Chang, L. L.; Macromolecules2000,
33, 4186.
Received: November 16, 2005
Published on the web: July 13, 2006
0103 - 5053 $6.00+0.00
Supplementary Information
*e-mail: [email protected]
Probing Interchain Interactions in Emissive Blends of
Poly[2-methoxy-5-(2’-ethylhexyloxy)-p
-phenylenevinylene] with Polystyrene and Poly(styrene-
co
-2-ethylhexyl acrylate)
by Fluorescence Spectroscopy
Marcelo L. De Andrade and Teresa D. Z. Atvars*
Instituto de Química, Universidade Estadual de Campinas, CP 6154, 13084-971 Campinas-SP, Brazil
Figure S1. EFM (top) and SEM (bottom) micrographs of the spin coated blends with 0.5 wt% MEH-PPV with: (a) and (d) PS-py, (b) and (e) SEHAMA-py
Figure S2. EFM (top) and SEM (bottom) micrographs of the spin coated blends with 1 wt% MEH-PPV with: (a) and (d) PS-py, (b) and (e) SEHAMA-py -9 and (c) and (e) SEHAMA-py-19.
Figure S3. EFM (top) and SEM (bottom) micrographs of the spin coated blends with 5 wt% MEH-PPV with: (a) and (d) PS-py, (b) and (e) SEHAMA-py

![Optical Properties of MEH-PPV and MEH-PPV/ [6,6]-Phenyl C61-butyric Acid 3-ethylthiophene Ester Thin Films](data:image/gif;base64,R0lGODlhAQABAIAAAP///wAAACH5BAEAAAAALAAAAAABAAEAAAICRAEAOw==)