Food Science and Technology ISSN 0101-2061
DII:
D httpI://dx.doi.org/10.1590/1678-457X.30116
1 Introduction
Pirarucu (Arapaima gigas Schinz) is one of the largest freshwater fish in the world, reaching about 2-3 m and 150 kg. The fish inhabits the Amazon River Basin in South America (Torres et al., 2008; Currey, 2010). This fish is economically and ecologically important for riverine population, because of its high commercial and nutritional value (Castello, 2008; Castello et al., 2011).
The presence of high biological value proteins, minerals, vitamins and unsaturated fatty acids, especially polyunsaturated fatty acids (PUFAs), characterizes fish muscle as a potentially healthy food (Sidhu, 2003). Fish species, gender, feeding type, and environmental factors influence the fish muscle composition (Tocher, 2003).
Freshwater fish contain higher levels of C18 PUFA and lower levels of n-3 EPA and DHA than marine fish. However, there are indications that freshwater fish have a capacity to stretch and desaturate shorter fatty acids, converting them into EPA and DHA. Thus, foods of lower nutritional value can be transformed into foods of higher nutritional value (Henderson & Tocher, 1987; Moreira et al., 2001).
Despite its high nutritional value, fish is a high perishable food. It happens because of fish composition, pH close to neutral, high water activity and presence of a natural microflora with deterioration potential (Darvishi et al., 2013). Thus, knowledge about proximate composition and physical-chemical properties of fish species are important parameters for defining processing
conditions and product preservation. Dtherwise, because of the diversity of fish species found in nature, the characterization parameters of many economic important species are scarce in scientific literature, especially freshwater fish species.
The pirarucu presents high potential for aquaculture, as well as for processing and commercialization. Moreover, data about muscle composition parameters of this freshwater specie are scarce. Thus, this research aims to determinate the proximate composition of the four main zones of pirarucu muscle, and the minerals, amino acid and fatty acid compositions in the fish muscle.
2 Materials and methods 2.1 Raw material
The pirarucu specimen studied (male, age 1 year and 6 months, 18.6 kg and 1.3 m length) was acquired in an aquaculture property placed in São João de Pirabas (Pará, Brazil) (latitude 00º46’29”S and longitude 47º10’38”W). The fish was transported in thermic package with ice to the Federal University of Pará (Belém, Pará, Brazil), where it was cleaned and filleted.
Fish muscle was divided in four different zonesI: dorse (42.9% muscle), venter (15.4% muscle), ventrecha (lower venter) (20.5% muscle) and tail (21.2% muscle), according to Figure 1. All samples were vacuum packed in polyethylene vacuum bags and stored at –18 °C until used for analysis within a maximum of 15 days.
Chemical composition of different muscle zones in pirarucu (Arapaima gigas)
Mayara Galvão MARTINS1, Déborah Elena Galvão MARTINS2, Rosinelson da Silva PENA1,3*
Received 19 Oct., 2016 Accepted 21 Mar., 2017
1Programa de Pós-graduação em Ciência e Tecnologia de Alimentos, Instituto de Tecnologia, Universidade Federal do Pará – UFPA, Belém, PA, Brazil 2Ministério da Agricultura, Pecuária e Abastecimento, Belém, PA, Brazil
3Faculdade de Engenharia de Alimentos, Instituto de Tecnologia, Universidade Federal do Pará – UFPA, Belém, PA, Brazil *Corresponding authorI: rspena@ufpa.br
Abstract
Identifying potential patterns in pirarucu (Arapaima gigas) composition, as a function of the different fish muscle zones (dorse, venter, ventrecha and tail), was the main objective of this research. For such, the different pirarucu muscle zones were evaluated, in order to obtain proximate composition and minerals content. It was also determined amino acids and fatty acids contents in fish muscle. The dorsal, ventral and tail muscle zones presented similar moisture (76.5-78.2%), protein (17.8-18.9%), total lipids (1.0-1.5%) and ash (0.9-1.2%) contents. Dn the other hand, the ventrecha zone presented 25.8% of protein and the major total lipids content (17.1%). The main minerals found in fish muscle were K (183.5-288.6 mg/100 g muscle) and Na (65.1-175.5 mg/100 g). Glutamic acid (3027.6 mg/100 g muscle) was the main amino acid found in fish muscle, which presented 48% of essential amino acids in the protein fraction. Lipids content showed 57.3% of unsaturated fatty acids and 42.7% of saturated fatty acids.
Keywords:Arapaima gigas; composition; minerals; amino acids; fatty acids.
2.2 General composition analysis
Moisture, ash, crude protein (nitrogen-to-protein conversion factor = 6.25), and lipid contents were determinated in different muscle zones according to Association of Dfficial Analytical Chemists (2010). All analyzes were performed in triplicate.
2.3 Minerals analysis
A flame atomic absorption spectrometer (SpectrAA 220, Varian Inc., Australia) was used for determination of minerals sodium (Na), magnesium (Mg), potassium (K), calcium (Ca), manganese (Mn), iron (Fe), copper (Cu), and zinc (Zn), in the different pirarucu muscle zones. As irradiation source were used hollow cathode lamps for Na (589 nm; 5 mA), Mg (285.2 nm; 4 mA), K (766.5 nm; 10 mA), Ca (422.7 nm; 5 mA), Mn (279.5 nm; 15 mA), Fe (248.4 nm; 14 mA), Cu (324.8 nm; 4 mA), and Zn (213.9 nm; 10 mA). The mixture air/acetylene was used as oxidant and fuel gas, respectively.
In the digester block tube (TE-040/25-1, Tecnal, Brazil) were added 25 mg of the lyophilized sample, 4 mL of H2D2 as auxiliary oxidant agent, and 4 mL of HND3 50%. For ventrecha sample digestion, it was necessary to use pure HND3. The complete sample digestion occurred at 180 °C. Following, the material was cooled at ambient temperature and the volume adjusted for 14 mL with ultrapure water. For analyzing Ca and Mg, the sample dilution was made with LaCl3 1% solution. Analytical blanks were prepared by the same procedure without addition of the sample.
2.4 Amino acid analysis
For total and free amino acids analysis, the sample (aliquot) was hydrolyzed with 6 M HCl at 100 °C for 24 h and the released amino acids were reacted with phenylisothiocyanate (PITC). The derivatives were separated by the injection of 20 µL into the high performance liquid Chromatograph (Hagen et al., 1989), using Luna C18 column (250 mm × 4.6 mm; 5 µm particle size) (00G-4252-E0, Phenomenex, USA) at 50 ºC and a mobile phase composed of eluents A (sodium acetate 0.56 M with triethylamine 0.05% and acetonitrile 0.06%, pH 6.4) and B (acetonitrile + water 60I:40).
The free amino acids were extracted from 1.25 g lyophilized samples with 80% ethanol solution containing 0.1 M HCl, in a 5 mL volumetric flask. α-Aminobutyric acid (500 µL) was added as internal standard and the set was sonicated (10 min), followed
by homogenization (1 hour) and centrifugation (8500 × g/15 min). An aliquot (40 µL) of the filtered supernatant (using a 0.22 mm membrane) was also derivatized.
The flow rate was 1 mL/min and detection was at 254 nm using UV detector. Quantification used DL-2-aminobutyric acid as an internal standard and components was determinated by comparison with a standard mixture.
2.5 Fatty acid analysis
Total lipids were extracted from ventrecha zone using the Bligh & Dyer (1959) method. This zone was used because it concentrates the major lipid fraction of the pirarucu muscle. Derivatives were isolated by saponification and esterification with 0.1 M KDH and 1.2 M HCl both in methanol. The fatty acid derivatives were extracted with hexane and put through a gas chromatograph (GC CP 3380, Varian Inc., USA), using CP-Sil 88 capillary column (60 m × 0.25 mm), a flame ionization detector (FID) and helium as the carrier gas. Fatty acids were identified by comparison with peaks obtained using fatty acids methyl esters standard solution under the same operating conditions (Rodrigues et al., 2010).
2.6 Statistical analysis
Data analysis was performed using the software Statistica Kernel Release 7.1. The experimental data were subjected to analysis of variance (ANDVA) and the significant differences between mean values obtained at different muscle zones were evaluated by Tukey’s test.
3 Results and discussion 3.1 General composition
Chemical composition (Table 1) was significantly different for analyzed parameters in the different pirarucu muscle zones (dorse, venter, ventrecha and tail), and protein was the majority constituent for all analyzed fish muscle zones. In fish muscle, total lipid content distribution was considered inhomogeneous, with a higher lipid content observed in the named ventrecha zone, indicating this region as the fish’s fat deposit area. Consequently, ventrecha was the zone with the smaller moisture content.
Moisture (52.2 to 78.2%), protein (17.8 to 25.8%), total lipids (1.0 to 17.1%) and ash (0.9 to 1.2%) contents (Table 2) ranged, although, some values are close to the values reported
in previous research on proximate composition of pirarucu muscle. Dliveira et al. (2014) observed 79.5 and 77.9% moisture, 17.6 and 16.1% protein, 0.6 and 2.5% total lipids, and 0.9 and 0.8% ash in dorsal and ventral zones of pirarucu muscle. Fogaça et al. (2011) e Martins et al. (2015) observed 75.0 and 75.5% moisture, 20.1 and 21.4% protein, 0.6 and 2.6% total lipids, and 2.5% and 0.9% ash in dorsal zone of the fish. The observed variations may be assigned to aspects as sex, animal age, specie, diet, seasonality and capture source (Moreira et al., 2001), as well as the analyzed muscle portion. Generally, the proximate composition of the pirarucu muscle was similar to that observed by Jensen et al. (2013) in farmed cod muscleI: 78.0% moisture, 18.6% protein, 1.0% total lipids and 1.3% ash.
Fish can be grouped into four categories according to their fat contentI: high fat (> 8%), medium fat (4 to 8%), low fat (2 to 4%), and lean fish (<2%) (Ackman, 1989). Although the ventrecha had a higher lipid content compared to the other zones, it represented only 21% of fresh fish muscle. Considering that the other zones (dorse, venter and tail) presented lipid content less than 2% and together represented 79% of fresh muscle, we can classify pirarucu as a medium fat fish.
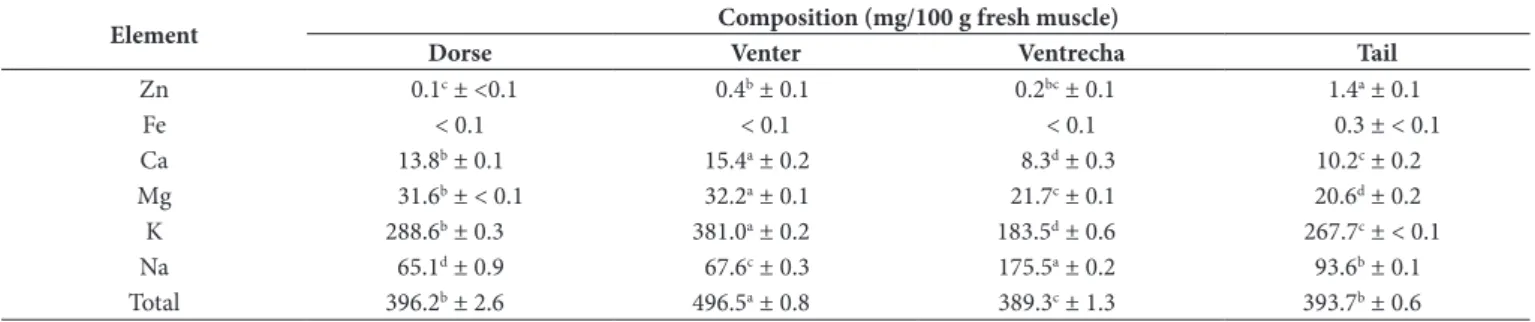
3.2 Minerals composition
According to the mineral composition presented in Table 2, K was the major mineral in all of the pirarucu muscle zones, followed by Na and Mg. This behavior was alike that observed by Chandrashekar & Deosthale (1993) in freshwater fishes, by Erkan & Özden (2007) in aqua-cultured sea fishes, and by Martínez-Valverde et al. (2000) in Mediterranean fish species. The minerals Cu and Mn were not found in the fresh pirarucu muscle.
The mineral content of the ventral zone was 25% higher, if compared to the other pirarucu muscle zones; and the ventrecha presented the smallest mineral content. According to Lal (1995),
the mineral content in fish may be influenced by seasonal, biological and ambient factors.
Fe occurred just in the tail fish zone. Pirarucu, as most of the fish, presents approximately 70% of white muscle and 10 to 30% of red muscle, concentrated in the fish tail zone (Zhang et al., 1996; Sänger & Stoiber, 2001). According to Huss et al. (1992), fishes with red muscle present more Fe and Cu than white muscle fishes. Low Fe (0.6 to 0.9 mg/100 g) and Cu (0.1 mg/100 g) concentrations were observed by Chandrashekar & Deosthale (1993) in freshwater fishes.
In general, the minerals in pirarucu muscle presented values within the range considered by Food and Agriculture Drganization of the United Nations (Food and Agriculture Drganization of the United Nations, 2005), for fresh fish muscle from aquacultureI: Ca (19.0 to 881.0 mg/100 g), Mg (4.5 to 452.0 mg/100 g), K (19.0 to 502.0 mg/100 g), and Na (30.0 to 134.0 mg/100 g). Wang et al. (2010) observed in pirarucu fresh muscle the occurrence of the minerals Ca (336.7 mg/100 g), Zn (2.3 mg/100 g), Cu (0.1 mg/100 g), Mn (0.1 mg/100 g), Fe (0.1 mg/100 g), Mg (26.4 mg/100 g), Na (80.4 mg/100 g), and K (246.7 mg/100 g). Calcium content observed in this study was smaller than that found in marine fish species (21.7 mg/100 g), however was close to the value observed by Chandrashekar & Deosthale (1993), in freshwater fish species (14.6 mg/100 g). Similar values of Ca were observed by Fuentes et al. (2010) in aquaculture (10.0 mg/100 g) and wild (11.0 mg/100 g) sea bass. The minerals content in fishes from aquaculture reflects the feed composition provided to the animal (Food and Agriculture Drganization of the United Nations, 2005).
3.3 Amino acids composition in dorsal zone
Table 3 presents the content for the 19 amino acids identified in pirarucu muscle. For this quantification, it was used the dorsal zone, because it was the most representative fish muscle portion
Table 1. Proximate composition of different pirarucu muscle zones.
Parameter Composition (%)
Dorse Venter Ventrecha Tail
Moisture 78.2a ± 0.4 77.1ab ± 0.6 52.2c ± 0.6 76.5b ± 0.6
Protein 17.8c ± < 0.1 18.9b ± 0.14 25.8a ± 0.2 18.8b ± < 0.1
Total lipids 1.0b ± 0.1 1.5b ± < 0.1 17.1a ± 0.9 1.2b ± 0.1
Ash 1.2a ± 0.1 1.1a ± <0.1 0.9b ± < 0.1 1.0b ± < 0.1
Mean values of three replicates ± standard deviations. Values followed by different superscript letters denote significant differences between the zones (p ≤ 0.05).
Table 2. Mineral composition in different pirarucu muscle zones.
Element Composition (mg/100 g fresh muscle)
Dorse Venter Ventrecha Tail
Zn 0.1c ± <0.1 0.4b ± 0.1 0.2bc ± 0.1 1.4a ± 0.1
Fe < 0.1 < 0.1 < 0.1 0.3 ± < 0.1
Ca 13.8b ± 0.1 15.4a ± 0.2 8.3d ± 0.3 10.2c ± 0.2
Mg 31.6b ± < 0.1 32.2a ± 0.1 21.7c ± 0.1 20.6d ± 0.2
K 288.6b ± 0.3 381.0a ± 0.2 183.5d ± 0.6 267.7c ± < 0.1
Na 65.1d ± 0.9 67.6c ± 0.3 175.5a ± 0.2 93.6b ± 0.1
Total 396.2b ± 2.6 496.5a ± 0.8 389.3c ± 1.3 393.7b ± 0.6
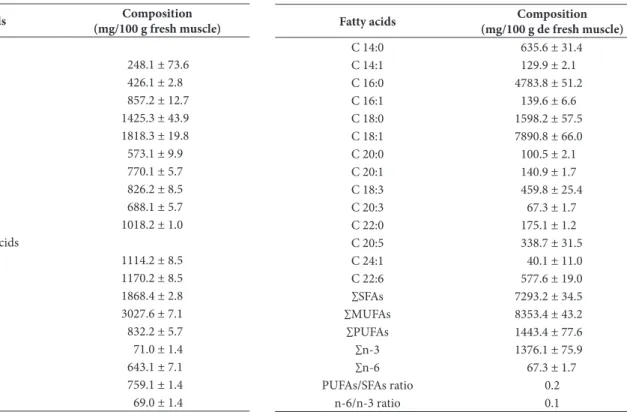
(43% of muscle), and also presented a low fat content, which makes it easier to extract the amino acids. Glu was the main amino acid found in the protein fraction of the fish muscle (16.6%), followed by Asp (10.3%) and Lys (10.0%). Similar behavior was observed by Meyer & Fracalossi (2005) in jundiá, a freshwater catfish, and by Dsibona et al. (2009) in two freshwater fishes. In turn, Jensen et al. (2013) observed Glu as the main amino acid (16.4%) in farmed cod muscle. The amino acids found in smaller quantity in pirarucu muscle were Tau and Hyp, which represented less than 0.4% of total amino acids.
The low Hyp content was expected, since this amino acid is present almost exclusively in the collagens constitution and in insignificant amounts in other proteins. Dsibona (2011) observed that the Hyp was absent in marine species but present in freshwater species, which suggests that freshwater species have more collagen in its muscle than marine species.
Ten amino acids are not synthesized by the human organism and need to be supplied from the diet. In this way, they are considered essential to humans and their presence and concentration influence the quality of protein (Friedman, 1996). The pirarucu muscle may be considered a source of protein of high biological value, because it presents 48% (8650.6 mg/100 g fresh muscle ± 29.7) of essential amino acids in the total amino acids (18205.4 mg/100 g fresh muscle ± 22.6). Jensen et al. (2013) observed similar essential amino acids content in farmed cod (46%) and Adeyeye (2009) observed smaller fractions of essential amino acids in species of Nigerian fish (41 to 45%) muscle. Besides presenting high quality proteins, pirarucu muscle presents a balanced amino acids profile.
3.4 Fatty acids composition
Lipid fraction of the fat deposit region (ventrecha) in pirarucu showed 8.4% of polyunsaturated fatty acids (PUFAs), 48.9% of monounsaturated fatty acids (MUFAs), and 42.7% of saturated fatty acids (SFAs) (Table 4). Similar fatty acid profiles (MUFAs > SFAs > PUFAs) were observed by Moreira et al. (2001) in three freshwater fishes (Matrinchã, Piraputanga and Piracanjuba), and by Guler et al. (2008) and Stancheva & Merdzhanova (2011) in farmed common carp, a teleost fish as pirarucu. Dn the other hand, Özogul et al. (2007) and Jensen et al. (2013) observed a higher SFAs content than MUFAs content in seawater fishes and in farmed cod, respectively.
Freshwater fish have lower levels of PUFAs than marine fish, especially DHA and EPA. Differences in fatty acid profiles of marine and freshwater fishes are related to the habitat of the species and their natural diet (herbivorous, omnivorous or carnivorous species) (Sargent et al., 1995; Dsman et al., 2007).
In fatty acid profile of pirarucu, C18I:1 was the main fatty acid, followed by C16I:0 and C18I:0. Castro et al. (2007) observed a similar profile in three freshwater fishes. Jensen et al. (2013) observed C22I:6 (EPA) as the main fatty acid, followed by C16I:0 and C20I:5 (DHA) in the fatty acid profile of farmed cod. Scientific literature has reported the predominance of the fatty acids C18I:0 and C16I:0 in fish muscle (Tocher, 2003; Guler et al., 2008). According to Food and Agriculture Drganization of the United Nations (2009), generally, C18I:1 is the main fatty acid present in products of animal origin so as vegetal origin.
Pirarucu presents a considerable quantity of fatty acids n-3 (1376.1 mg/100 g of fresh muscle), as C18I:3 (ALA), C20I:5 (EPA) and C22I:6 (DHA), which are important for human health.
Table 3. Amino acids composition in pirarucu muscle.
Amino acids Composition
(mg/100 g fresh muscle)
Essential amino acids
Cysteine (Cys) 248.1 ± 73.6
Histidine (His) 426.1 ± 2.8
Isoleucine (Ile) 857.2 ± 12.7
Leucine (Leu) 1425.3 ± 43.9
Lysine (Lys) 1818.3 ± 19.8
Methionine (Met) 573.1 ± 9.9
Phenylalanine (Phe) 770.1 ± 5.7
Threonine (Thr) 826.2 ± 8.5
Tyrosine (Tyr) 688.1 ± 5.7
Valine (Val) 1018.2 ± 1.0
Non-essential amino acids
Alanine (Ala) 1114.2 ± 8.5
Arginine (Arg) 1170.2 ± 8.5
Aspartic acid (Asp) 1868.4 ± 2.8
Glutamic acid (Glu) 3027.6 ± 7.1
Glycine (Gly) 832.2 ± 5.7
Hydroxyproline (Hyp) 71.0 ± 1.4
Proline (Pro) 643.1 ± 7.1
Serine (Ser) 759.1 ± 1.4
Taurine (Tau) 69.0 ± 1.4
Mean values of three replicates ± standard deviations.
Table 4. Fatty acids composition in pirarucu muscle.
Fatty acids Composition
(mg/100 g de fresh muscle)
C 14I:0 635.6 ± 31.4
C 14I:1 129.9 ± 2.1
C 16I:0 4783.8 ± 51.2
C 16I:1 139.6 ± 6.6
C 18I:0 1598.2 ± 57.5
C 18I:1 7890.8 ± 66.0
C 20I:0 100.5 ± 2.1
C 20I:1 140.9 ± 1.7
C 18I:3 459.8 ± 25.4
C 20I:3 67.3 ± 1.7
C 22I:0 175.1 ± 1.2
C 20I:5 338.7 ± 31.5
C 24I:1 40.1 ± 11.0
C 22I:6 577.6 ± 19.0
∑SFAs 7293.2 ± 34.5
∑MUFAs 8353.4 ± 43.2
∑PUFAs 1443.4 ± 77.6
∑n-3 1376.1 ± 75.9
∑n-6 67.3 ± 1.7
PUFAs/SFAs ratio 0.2
The results showed that the fish contains higher n-3 levels than n-6 PUFAs (Table 4). However, freshwater fishes have shown a capacity for the conversion of C18 fatty acids, like C18I:3 and C18I:2, into EPA, DHA, and C20I:4 (Tocher, 2003).
Quality indexes such as PUFA/SFA and n-6/n-3 ratios and the relation EPA + DHA may evaluate nutritional quality of the lipid fraction. DHA and EPA have been reported as being beneficial for human health. For example, general recommendations for daily dietary intakes of DHA + EPA are 0.5 g for infants and 1 g for adults and patients with coronary heart disease (Kris-Etherton et al., 2002).
Some studies have analyzed the positive influence of the fatty acids n-3 and n-6, found in fish muscle, in human health. The presence of this fatty acids in diet is auxiliary in the prevention of the coronary heart disease and decrease of high blood pressure, for example (Kris-Etherton et al., 2002; Tocher, 2003). However, excessive amounts of n-6 PUFA have the opposite effect. It is necessary to maintain a balanced the relation between n-3 and n-6 in the diet (Steffens, 1997) throughout the human life cycle. Values of n-6/n-3 below 4.0 are desirable in the diet, in order to prevent cardiovascular risks (Department of Health and Social Security, 1984).
PUFA/SFA ratio is also used as a parameter for assessing the fish nutritional quality and its value should be higher than 0.45 (Department of Health and Social Security, 1994). In turn, lower values are undesirable, because they are considered to cause a greater increase in blood cholesterol. Although the fatty acid profile has been interesting, the PUFA/SFA ratio value (0.20) in the pirarucu muscle is considered low, due to the low PUFA content.
4 Conclusions
The dorse, venter and tail pirarucu muscle zones presented similar proximate compositions, while the named ventrecha zone presented lower moisture and higher total lipids content, being characterized as the fish’s fat deposit area. K was the main mineral found in all of the muscle zones; it was also observed the presence of the minerals Na, Mg, Ca, Zn and Fe. The glutamic acid, aspartic acid and lysine were the main amino acids found in pirarucu muscle, which may be considered a protein source of high biological value, once its protein fraction is composed by 48% of essential amino acids. Dleic acid, palmitic acid and stearic acid were the main fatty acids found in pirarucu lipid fraction, which presented 42.7% of saturated, 48.9% of monounsaturated and 8.4% of polyunsaturated fatty acids.
Acknowledgements
The authors acknowledge Financiadora de Estudos e Projetos (FINEP, Brazil) and Serviço de Apoio a Micro e Pequenas Empresas (SEBRAE, Brazil) for the financial support (028/2010).
References
Ackman, R. G. (1989). Nutritional composition of fats in seafood in progress. Food and Nutrition Sciences, 13, 161-241.
Adeyeye, E. I. (2009). Amino acid composition of three species of Nigerian fishI: Clarias anguillaris, Oreochromis niloticus and Cynoglossus senegalensis.Food Chemistry, 113(1), 43-46. httpI:// dx.doi.org/10.1016/j.foodchem.2008.07.007.
Association of Dfficial Analytical Chemists – ADAC. (2010). Official methods of analysis of the Association of Official Analytical Chemists (18th ed.). GaithersburgI: ADAC.
Bligh, E. G., & Dyer, W. J. (1959). A rapid method for total lipid extraction and purification. Canadian Journal of Biochemistry and Physiology, 37(8), 911-917. PMidI:13671378. httpI://dx.doi.org/10.1139/o59-099. Castello, L. (2008). Nesting habitat of pirarucu Arapaima gigas in floodplains of the Amazon. Journal of Fish Biology, 72, 1520-1528. httpI://dx.doi.org/10.1111/j.1095-8649.2007.01778.x.
Castello, L., Stewart, D. J., & Arantes, C. C. (2011). Modeling population dynamics and conservation of arapaima in the Amazon. Reviews in Fish Biology and Fisheries, 21(3), 621-640. httpI://dx.doi.org/10.1007/ s11160-010-9197-z.
Castro, F. A. F., Sant’na, H. M. P., Campos, F. M., Costa, N. M. B., Silva, M. T. C., Salaro, A. L., & Franceschini, S. C. C. (2007). Fatty acid composition of three freshwater fishes under different storage and cooking processes. Food Chemistry, 103(4), 1080-1090. httpI://dx.doi. org/10.1016/j.foodchem.2006.10.002.
Chandrashekar, K., & Deosthale, Y. G. (1993). Proximate composition, amino acid, mineral, and trace element content of the edible muscle of 20 Indian fish species. Journal of Food Composition and Analysis, 6(2), 195-200. httpI://dx.doi.org/10.1006/jfca.1993.1021.
Currey, J. D. (2010). Mechanical properties and adaptations of some less familiar bony tissues. Journal of the Mechanical Behavior of Biomedical Materials, 3(5), 357-372. PMidI:20416550. httpI://dx.doi. org/10.1016/j.jmbbm.2010.03.002.
Darvishi, H., Azadbakht, M., Rezaeiasl, A., & Farhang, A. (2013). Drying characteristics of sardine fish dried with microwave heating. Journal of the Saudi Society of Agricultural Sciences, 12(2), 121-127. httpI:// dx.doi.org/10.1016/j.jssas.2012.09.002.
Department of Health and Social Security – DHSS. (1984). Diet and cardiovascular disease (Report on Health and Social Subjects, n. 28). LondonI: DHSS.
Department of Health and Social Security – DHSS. (1994). Nutricional aspects of cardiovascular disease. (Report on Health and Social Subjects, n. 46). LondonI: DHSS.
Erkan, N., & Özden, D. (2007). Proximate composition and mineral contents in aqua cultured sea bass (Dicentrarchus labrax), sea bream (Sparus aurata) analyzed by ICP-MS. Food Chemistry, 1022(3), 721-725. httpI://dx.doi.org/10.1016/j.foodchem.2006.06.004.
Fogaça, F. H. S., Dliveira, E. G., Carvalho, S. E. Q., & Santos, F. J. S. (2011). Yield and composition of pirarucu fillet in different weight classes. Acta Scientiarum. Animal Science (Penicuik, Scotland), 33, 95-99. httpI://dx.doi.org/10.4025/actascianimsci.v33i1.10843. Food and Agriculture Drganization of the United Nations – FAD. (2005).
Fisheries and aquaculture topics: vitamins and minerals. RomeI: FAD. Food and Agriculture Drganization of the United Nations – FAD.
(2009). Fats and fatty acids in human nutrition: report of an expert consultation. RomeI: FAD.
Friedman, M. (1996). Nutritional value of proteins from different food sourcesI: a review. Journal of Agricultural and Food Chemistry, 44(1), 6-29. httpI://dx.doi.org/10.1021/jf9400167.
Guler, G., Kiztanir, B., Aktumsek, A., Citil, D. B., & Dzparlak, H. (2008). Determination of the seasonal changes on total fatty acid composition and ω3/ω6 ratios of carp (Cyprinus carpio L.) muscle lipids in Beysehir Lake (Turkey). Food Chemistry, 108(2), 689-694. PMidI:26059149. httpI://dx.doi.org/10.1016/j.foodchem.2007.10.080. Hagen, S. R., Frost, B., & Augustin, J. (1989). Precolumn phenylisothio cyanate derivatization and liquid chromatography of amino acids in food. Journal - Association of Official Analytical Chemists, 72(6), 912-916. PMidI:2592313.
Henderson, R. J., & Tocher, D. R. (1987). The lipid composition and biochemistry of freshwater fish. Journal Progress Lipid Research, 26(4), 281-347. PMidI:3324105. httpI://dx.doi.org/10.1016/0163-7827(87)90002-6.
Huss, H. H., Jakobsen, M., & Liston, J. (1992). Quality assurance in the fish industry. AmsterdamI: Elsevier Science Publishers.
Jensen, I., Larsen, R., Rustad, T., & Eilertsen, K. (2013). Nutritional content and bioactive properties of wild and farmed cod (Gadus morhua L.) subjected to food preparation. Journal of Food Composition and Analysis, 31(2), 212-216. httpI://dx.doi.org/10.1016/j.jfca.2013.05.013. Kris-Etherton, P. M., Harris, W. S., & Appel, L. J. (2002). Fish consumption, fish oil, omega n-3 fatty acids and cardiovascular disease. Circulation, 106(21), 2747-2757. PMidI:12438303. httpI://dx.doi.org/10.1161/01. CIR.0000038493.65177.94.
Lal, S. (1995). Macro and trace elements in fish and shellfish. In A. Ruiter (Ed.), Fish and fishery products: composition, nutritive properties and stability (pp. 87-213). CaliforniaI: CAB International.
Martínez-Valverde, I., Periago, M. J., Santaella, M., & Ros, G. (2000). The content and nutritional significance of minerals on fish flesh in the presence and absence of bone. Food Chemistry, 71(4), 503-509. httpI://dx.doi.org/10.1016/S0308-8146(00)00197-7.
Martins, M. G., Martins, D. E. G., & Pena, R. S. (2015). Drying kinetics and hygroscopic behavior of pirarucu (Arapaima gigas) fillet with different salt contents. LWT - Food Science and Technology (Campinas.), 62, 144-151. httpI://dx.doi.org/10.1016/j.lwt.2015.01.010.
Meyer, G., & Fracalossi, D. M. (2005). Estimation of jundiá (Rhamdia quelen) dietary amino acid requirements based on muscle amino acid composition. Scientia Agricola, 62(4), 401-405. httpI://dx.doi. org/10.1590/S0103-90162005000400015.
Moreira, A. B., Visentainer, J. V., Souza, N. E., & Matsushita, M. (2001). Fatty acids profile and cholesterol contents of three Brazilian Brycon freshwater fishes. Journal of Food Composition and Analysis, 14(6), 565-574. httpI://dx.doi.org/10.1006/jfca.2001.1025.
Dliveira, P. R., Jesus, R. S., Batista, G. M., & Lessi, E. (2014). Sensorial, physicochemical and microbiological assessment of pirarucu (Arapaima gigas, Schinz 1822) during ice storage. Brazilian Journal of Food Technology, 17, 67-74. httpI://dx.doi.org/10.1590/bjft.2014.010. Dsibona, A. D. (2011). Comparative study of proximate composition, amino and fatty acids of some economically important fish species in Lagos, Nigeria. African Journal of Food Science, 5, 581-588.
Dsibona, A. D., Kusemiju, K., & Akande, G. R. (2009). Fatty acid composition and amino acid profile of two freshwater species, African catfish (Clarias gariepinus) and tilapia (Tilapia zillii). African Journal of Food, Agriculture. Nutrition and Development, 9, 608-621. Dsman, F., Jaswir, I., Khaza’ai, H., & Hashim, R. (2007). Fatty acid profiles of fin fish in Langkawi Island, Malaysia. Journal of Oleo Science, 56(3), 107-113. PMidI:17898471. httpI://dx.doi.org/10.5650/jos.56.107. Özogul, Y., Özogul, F., & Alagoz, S. (2007). Fatty acid profiles and fat contents of commercially important seawater and freshwater fish species of TurkeyI: a comparative study. Food Chemistry, 103(1), 217-223. httpI://dx.doi.org/10.1016/j.foodchem.2006.08.009. Rodrigues, A. M. C., Darnet, S., & Silva, L. H. M. (2010). Fatty acid
profiles and tocopherol contentsofburiti (Mauritia flexuosa), patawa (Oenocarpus bataua), tucumã (Astrocaryum vulgare), mari (Poraqueiba paraensis) and inaja (Maximilian amaripa). Fruits Journal Brazilian Chemistry Society, 21(10), 2000-2004. httpI://dx.doi.org/10.1590/ S0103-50532010001000028.
Sänger, A. M., & Stoiber, W. (2001). Muscle fiber diversity and plasticity. In I. A. Johnston (Ed.), Muscle development and growth (pp. 187-250). LondonI: Academic Press.
Sargent, J. R., Bell, J. G., Bell, M. V., Henderson, R. J., & Tocher, D. R. (1995). Requirements criteria for essential fatty acids. Journal of Applied Ichthyology, 11(3-4), 183-198. httpI://dx.doi. org/10.1111/j.1439-0426.1995.tb00018.x.
Sidhu, K. S. (2003). Health benefits and potential risks related to consumption of fish or fish oil. Regulatory Toxicology and Pharmacology, 38, 336-344. httpI://dx.doi.org/10.1016/j.yrtph.2003.07.002. Stancheva, M., & Merdzhanova, A. (2011). Fatty acid composition of
common carp, rainbow trout and grey mullet fish species. Agriculture Science and Technology, 3, 285-289.
Steffens, W. (1997). Effects of variation in essential fatty acids in fish feed on nutritive value of freshwater fish for humans. Aquaculture (Amsterdam, Netherlands), 151(1-4), 97-119. httpI://dx.doi.org/10.1016/ S0044-8486(96)01493-7.
Tocher, D. (2003). Metabolism and functions of lipid and fatty acid in teleost fish. Reviews in Fisheries Science, 11(2), 107-184. httpI:// dx.doi.org/10.1080/713610925.
Torres, F. F., Troncoso, D. P., Nakamatsu, J., Grande, C. J., & Gomez, C. M. (2008). Characterization of the nanocomposite laminate structure occurring in fish scales from Arapaima gigas.Materials Science and Engineering, 28(8), 1276-1283. httpI://dx.doi.org/10.1016/j. msec.2007.12.001.
Wang, Y., Wu, C., Guo, J., Liu, S., & Su, Y. (2010). Nutrition composition of Arapaima gigas fillet. Fujian Journal of Agricultural Sciences, 25, 491-495.