CENTRO DE CIÊNCIAS BIOLÓGICAS E DA SAÚDE
PROGRAMA DE PÓS-GRADUAÇÃO EM ECOLOGIA E RECURSOS NATURAIS
NAT
Á
LIA BIANCA ROSATTI
PERDA DE ORIGINALIDADE E EXTINÇÕES
SIMULADAS DE ESPÉCIES ARBUSTIVO-ARBÓREAS
DE CERRADO
CENTRO DE CIÊNCIAS BIOLÓGICAS E DA SAÚDE
PROGRAMA DE PÓS-GRADUAÇÃO EM ECOLOGIA E RECURSOS NATURAIS
NAT
Á
LIA BIANCA ROSATTI
PERDA DE ORIGINALIDADE E EXTINÇÕES
SIMULADAS DE ESPÉCIES ARBUSTIVO-ARBÓREAS
DE CERRADO
Dissertação apresentada ao Programa de
Pós-Graduação em Ecologia e Recursos Naturais da
Universidade Federal de São Carlos, como parte dos
requisitos para a obtenção do título de mestre em
Ecologia e Recursos Naturais.
Orientador: Prof. Dr. Marco Antônio Batalha
SÃO CARLOS – SP
Ficha catalográfica elaborada pelo DePT da Biblioteca Comunitária da UFSCar
R789po
Rosatti, Natália Bianca.
Perda de originalidade e extinções simuladas de espécies arbustivo-arbóreas de cerrado / Natália Bianca Rosatti. -- São Carlos : UFSCar, 2012.
40 f.
Dissertação (Mestrado) -- Universidade Federal de São Carlos, 2012.
1. Ecossistema. 2. Conservação. 3. Filogenia. 4. Traços funcionais. 5. Savanas. I. Título.
AGRADECIMENTOS
RESUMO
A originalidade mede o quanto uma dada espécie é diferente das outras espécies em uma comunidade com relação à sua história filogenética e aos seus traços funcionais, podendo ser usada para atribuir prioridades de conservação. Este trabalho está dividido em dois capítulos. No primeiro capítulo, nosso objetivo foi introduzir as originalidades filogenética e funcional, medidas ainda pouco conhecidas. Justificamos as razões para o uso dessa abordagem e exemplificamos maneiras de utilizá-la para fins conservacionistas. No segundo capítulo, nosso objetivo foi avaliar a relação entre a originalidade filogenética e a originalidade funcional, a relação de ambas com variáveis ambientais, e suas perdas em cenários de extinções baseados na abundância, tolerância ao fogo e preferência por hábitats, uma maneira objetiva para se tomar decisões com fins conservacionistas. Para isso, em uma reserva de cerrado no Brasil Central, lançamos 100 parcelas, amostramos o componente arbustivo-arbóreo e medimos para cada indivíduo 14 traços funcionais. Para cada parcela, coletamos variáveis ambientais de solo, topografia e histórico de fogo. As originalidades filogenética e funcional estiveram correlacionadas, e ambas aumentaram em direção a ambientes mais severos. Entretanto, nas simulações de extinções baseadas na abundância e na tolerância de fogo, a perda de originalidade funcional foi diferente da perda em extinções aleatórias, enquanto que a perda de originalidade filogenética não foi. Originalidade funcional parece ser uma medida mais apropriada para ser utilizada em estratégias de conservação, já que foi sensível a diferença entre as espécies com relação a suas abundâncias e tolerância ao fogo.
ABSTRACT
Originality measures how different a given species is from all other species regarding either their phylogenetic history or functional traits and may be used to assign conservation priorities. This dissertation is divided into two chapters. In the first chapter, we introduced and defined the phylogenetic and functional originalities, which are still underused. We discussed the advantages of using this approach and showed how it could be used in conservation plans. In the second chapter, we analysed the relationships between phylogenetic, and functional originalities, their relationships with the environment, and their losses under extinction scenarios based on species abundance, fire tolerance, and habitat preference. We placed 100 plots in a cerrado reserve located in central Brazil, sampled all woody plants within the plots, measured 14 functional traits, and measured soil, topography, and fire. We assembled a phylogenetic tree, and a functional dendrogram, with which we calculated the originalities. Phylogenetic- and functional-based originalities were correlated, and both increased towards harsher environments. However, the loss of functional originality was different from random extinctions on the abundance and fire tolerance scenarios, whereas the loss of phylogenetic originality was not. Functional originality seemed to be a better surrogate to be used in conservation strategies, because it was sensitive to differences in species abundances and fire tolerance.
LISTA DE TABELA
TABELA 1. Plant traits used to calculate functional originality and their functional
relevance………...32
TABELA 2. Values calculated for the model selection of multiple regression analysis,
using phylogenetic originality per plot as response variable and soil, topography, and fire history as explanatory variables.………...33
TABELA 3. Values calculated for the model selection of multiple regression analysis,
LISTA DE FIGURAS
FIGURA 1. Phylogenetic tree assembled for the cerrado species sampled in Emas
National Park, central Brazil (17°49’-18°28’S and 52°39’-53°10’W) with phylogenetic originalities. The relationship among species was based on the current Phylomatic tree (tree R20091110; Webb and Donoghue, 2005)………35
FIGURA 2. Functional dendrogram assembled for the cerrado species sampled in Emas
National Park, central Brazil (17°49’-18°28’S and 52°39’-53°10’W) with functional originalities………36
FIGURA 3. Trait-dependent extinction trajectories. Filled circles represent the extinction
SUMÁRIO
Capítulo 1 10
Usando as originalidades filogenética e funcional na conservação da biodiversidade 1 Introdução 11
2 Originalidades filogenética e funcional 12
3 Aplicações 14
4 Conclusões 15
Agradecimentos 16
Referências 16
Capítulo 2 17
Loss of phylogenetic and functional originalities of woody cerrado species in simulated extinction scenarios based on abundance, fire tolerance, and habitat preference Abstract 18
1 Introduction 19
2 Material and methods 21
3 Results 24
4 Discussion 25
Acknowledgements 27
References 27
Tables 32
Figures 35
Appendix 38
Capítulo 1
Usando as originalidades filogenética e funcional na conservação da biodiversidade
1. Introdução
A ocupação do meio e o uso de recursos pelo homem estão colocando em risco a biodiversidade, pois as taxas de extinções atuais superam até mesmo as grandes extinções históricas. Ações conservacionistas enfrentam obstáculos devido a indefinições de como medir a biodiversidade e de como determinar prioridades (Pavoine et al. 2005). A biodiversidade é um conceito que inclui padrões espácio-temporais, entidades como espécies, traços e unidades evolutivas (Pavoine et al. 2010). Nesse cenário complexo, para conservar a biodiversidade – ou, ao menos, para minimizar sua perda – devemos quantificá-la. Frequentemente, essa quantificação é feita contando-se o número de espécies em uma dada área ou em um dado número de indivíduos (riqueza de espécies ou densidade), ou combinando o número de espécies com a distribuição de abundâncias (por exemplo, os índices de Shannon e de Simpson). Tais medidas assumem que todas as espécies são equivalentes ecológica e evolutivamente.
Porém, assumir essa equivalência entre as espécies não é adequado para viabilizar a conservação da biodiversidade (Vane-Wright et al. 1991). De acordo com suas características, as espécies têm funções ecológicas distintas, que influenciam diferentemente a comunidade sob dois principais aspectos. Primeiro, no que diz respeito à estabilidade. Uma maior diversidade de traços está diretamente relacionada à resistência e à resiliência das comunidades após perturbações, tornando as comunidades mais estáveis (Díaz & Cabido 2001). Segundo, no que diz respeito ao uso de recursos. Se as espécies possuem valores diferentes para os seus traços funcionais, elas são mais complementares, ocupando nichos distintos. Isso leva a um uso mais eficiente dos recursos e, consequentemente, a um melhor funcionamento da comunidade, cuja produtividade pode ser maior e cuja ciclagem de nutrientes pode ser mais rápida.
diferenças devem ser consideradas em ações conservacionistas.
Uma das principais dificuldades em ações conservacionistas são os recursos financeiros limitados. As reservas ambientais geralmente possuem um tamanho que não é suficiente para abrigar todas as espécies de uma região. A impossibilidade de protegermos simultaneamente todas as espécies implica a necessidade de atribuirmos prioridades na conservação da biodiversidade. Essas prioridades podem ser baseadas no grau de ameaça (por exemplo, a lista vermelha da IUCN; do inglês International Union for Conservation of Nature), no grau de endemismo e no valor econômico das espécies. Mas, se quisermos garantir o funcionamento e a manutenção da diversidade a longo prazo, é importante conservamos a maior amplitude de traços funcionais e o máximo de história evolutiva possíveis nas unidades de conservação (Redding & Mooers 2006). Uma maneira de se fazer isso é levando-se em consideração a raridade média dos traços das espécie que ocorrem em um dado local. Vane-Wright et al.
(1991) foram os primeiros a propor uma medida de raridade média de traços das espécies com base em suas relações taxonômicas, que eles chamaram de distinguibilidade taxonômica e que poderia ser usada para definir prioridades de conservação. Desde então, algumas outras medidas com o mesmo intuito foram propostas, incluindo aquela que discutiremos aqui, a
originalidade.
2. Originalidades filogenética e funcional
O funcionamento de uma comunidade, porém, não é determinado necessariamente pela história evolutiva das espécies que abriga, mas sim pelos traços funcionais dessas espécies (Naeem & Wright 2003). Se os traços das espécies são conservados na filogenia, então podemos esperar que espécies filogeneticamente mais originais também sejam as mais originais funcionalmente. Nesse caso, a abordagem filogenética seria suficiente para medirmos a originalidade das espécies e, para isso, dependeríamos da identificação taxônomica das espécies e de informações das relações filogenéticas entre elas, evitando a coleta de dados funcionais, que demanda tempo e dinheiro.
Correlações entre a história evolutiva e traços funcionais foram encontradas em estudos recentes, como, por exemplo, no gênero de peixes Sebastes, em que as espécies mais isoladas na árvore filogenética também são as mais distintas morfologicamente (Magnuson-Ford et al. 2009). Porém, traços relacionados com funções ecologicamente relevantes podem ser convergentes. O processo de convergência de traços, resultado de adaptações independentes ao ambiente, permite que espécies distantes filogeneticamente apresentem traços semelhantes (Pavoine et al. 2010). Nesse caso, as espécies mais isoladas filogeneticamente não são necessariamente as mais distintas funcionalmente. Portanto, se priorizássemos em ações de conservação as espécies mais isoladas filogeneticamente, estaríamos preservando uma maior diversidade de informação genética, mas não traços funcionais raros ou únicos.
Como os índices baseados árvores filogenéticas também podem ser aplicados em dendrogramas funcionais, podemos calcular a originalidade funcional das espécies (Pavoine et al. 2010). Aqui, em vez de usarmos a árvore filogenética, usamos o dendrograma funcional, obtido por meio da coleta dos traços funcionais das espécies em uma comunidade. Essa abordagem permite estimar a complementaridade nas funções ecológicas das espécies e identificar aquelas funcionalmente importantes. O uso de traços funcionais não exige o conhecimento taxônomico das espécies, o que é uma vantagem em locais com poucos estudos desse tipo. Porém, essa abordagem exige passos críticos como a escolha de traços realmente importantes a serem coletados e a coleta em si, que é bastante trabalhosa e custosa.
3. Aplicações
preservada em função da originalidade. Nesse estudo, assumiu-se que apenas um quinto das espécies poderia ser preservado. Quando as espécies a serem conservadas foram sorteadas, 43% da história evolutiva foi preservada; porém, quando o método de maximização da originalidade foi usado, a proporção de história evolutiva preservada subiu para 55%. Essa abordagem é uma alternativa viável para o dilema da Arca de Noé, em que, a partir de um conjunto de espécies, devemos escolher aquelas que serão protegidas pelas ações de conservação e aquelas que ficarão desamparadas. A originalidade das espécies pode ser calculada no ambiente R com o pacote ‘ade4’ (R Development Core Team 2009). Além disso, Pavoine et al. (2005) disponibilizaram as instruções e as funções usadas nos apêndices do artigo.
Outra abordagem possível prioriza medidas de manejo contra espécies exóticas. Se partirmos da premissa de que espécies aparentadas compartilham nichos ecológicos semelhantes, bem como inimigos naturais, então, quanto mais distintas filogeneticamente e funcionalmente as espécies exóticas forem em relação às espécies nativas, isto é, quanto mais originais elas forem, maior o pontencial invasor (Strauss et al. 2006). Dessa forma, ações de manejo que combatam as espécies exóticas mais distintas filogeneticamente e funcionalmente deveriam ser priorizadas (Strauss et al. 2006).
Mouillot et al. (2008) testaram se as reservas biológicas realmente beneficiam as espécies funcionalmente mais originais e, portanto, promovem a manutenção de uma maior diversidade de traços. Nesse estudo, as espécies mais originais tornaram-se mais abundantes quando delimitada a reserva biológica e cessada a pressão antrópica. Eles sugeriram que as espécies mais originais podem atuar como indicadoras dos efeitos de ações conservacionistas em ambientes que sofreram pertubações. Isso sustentaria o funcionamento e promoveria a resiliência da comunidade, proporcionando serviços ecológicos mais eficientes e capacidade da comunidade se manter frente às pressões, como aquelas resultantes das mudanças climáticas globais e modificações no uso da terra (Mouillot et al. 2008).
4. Conclusões
usados em diversos contextos, entre os quais: (1) determinação de prioridades de conservação, (2) detecção de mudanças devido a impactos ambientais e (3) simulações de extinções para prever as consequências da perda de espécies na diversidade ecológica e evolutiva das comunidades. No entanto, apesar da versatilidade, o conceito de originalidade ainda é subutilizado. A consolidação dessa nova abordagem para a mensuração da diversidade e as relações dessa medida com os processos ecológicos, como funcionamento e estabilidade, aumentam as chances de maximizarmos a preservação da biodiversidade e serviços ecológicos em ações conservacionistas e, portanto, estudos que a usem devem ser encorajados.
Agradecimentos
Agradecemos à Fapesp, pela bolsa de mestrado concedida à primeira autora, e ao CNPq, pela bolsa de produtividade concedida ao segundo autor. Agradecemos também a revisão do texto feita pelo Dr. Eduardo Luís Hettwer Giehl.
Referências
Díaz S & Cabido M, 2001. Vive la différence: plant functional diversity matters to ecosystem processes. Trends in Ecology and Evolution, 16: 646-655.
Magnuson-Ford K, 2009. Rockfish (Sebastes) that are evolutionarily isolated are also large, morphologically distinctive and vulnerable to overfishing. Biological Conservation, 142: 1787-1796.
Mouillot D et al., 2008. Do we protect biological originality in protected areas? A new index and an application to the Bonifacio Strait Natural Reserve. Biological Conservation, 141: 1569-1580.
Naeem S & Wright JP, 2003. Disentangling biodiversity effects on ecosystem functioning: deriving solutions to a seemingly insurmountable problem. Ecology Letters, 6: 567-579. Pavoine S & Bonsall MB, 2010. Measuring biodiversity to explain community assembly: a unified approach. Biological Reviews, 86:792-812.
R Foundation for Statistical Computing, Vienna. URL: http://www.r-project.org.
Redding DW & Mooers AØ, 2006. Incorporating evolutionary measures into conservation prioritization. Conservation Biology, 20: 1670–1678.
Strauss SY et al., 2006. Exotic taxa less related to native species are more invasive.
Proceedings of the National Academy of Sciences of the United States of America, 103: 5841-5845.
Vane-Wright RI et al., 1991. What to protect? – Systematics and the agony of choice.
Capítulo 2
Loss of phylogenetic and functional originalities of woody cerrado species in simulated extinction scenarios based on abundance, fire tolerance, and habitat preference
Abstract
Originality measures how different a given species is from all other species regarding either their phylogenetic history or functional traits and may be used to assign conservation priorities. Our goal was to evaluate the relationships between phylogenetic and functional originalities, their relationships with the environment, and their losses under several extinction scenarios. We placed 100 plots in a cerrado reserve located in central Brazil, sampled all woody plants species within the plots, measured 14 functional traits, and measured soil features, topography, and fire history. We assembled a phylogenetic tree and a fuctional dendrogram, with which we calculated the originalities. Phylogenetic- and functional-based originalities were correlated, and both increased towards harsher environments. However, the loss of functional originality was different from random extinctions on the abundance and fire tolerance scenarios, whereas the loss of phylogenetic originality was not. Functional originality seemed to be a better surrogate to be used in conservation strategies, because it was sensitive to differences in species abundances and fire tolerance.
1. Introduction
Faced with intense loss of diversity, the main goal of conservation plans is to preserve as much diversity as possible. An important question in this context is how to measure diversity. For the purpose of conservation, a useful measure is the distinctiveness among species (Vane-Wright et al. 1991). Trait distinctiveness and phylogenetic relatedness among species determine their role in community functioning (Pavoine et al. 2005; Petchey and Gaston 2006). The more distinct is the species, the more complementary are its traits, and complementarity among traits increases stability and optimises resource use in a community (Petchey 2003).
Originality measures the distinctiveness among species, that is, how different a given species is from all other species, regarding phylogenetic history or functional traits, and can be used to predict changes in community functioning (Pavoine et al. 2005; Petchey et al. 2007). For example, extinction of a highly original species results in loss of unique or rare functional traits and can disrupt community functioning (Mouillot et al. 2008; O’Gorman et al. 2010). The originality of a species can be based either on phylogenetic distances or functional differences (Mouillot et al. 2008; Pavoine et al. 2005; Petchey et al. 2007). Indeed, many studies on conservation priorities take into account only the phylogenetic information, considering that the traits are conserved and, thus, species with fewer close relatives should be more functionally unique (for instance, Redding and Mooers 2006). Although phylogeny accounts for some of the functional differences, environmental pressure can select convergent traits from distantly related species, therefore, phylogenetically dispersed community may be functionally convergent (Batalha et al. 2011; Silva et al. 2011). Since plants traits can be conserved or convergent, phylogenetic and functional relationships among species may provide complementary information (Pavoine and Bonsall 2010). Taken together, these measures could improve the understanding of how ecological processes affect community composition and functioning (Pavoine and Bonsall 2010).
Local extinctions are not random, but are the result of traits responding to environmental conditions and interspecific interactions (Purvis et al. 2000). Simulations of realistic extinction scenarios allow estimates of originality losses, to predict the consequences of change, and, consequently, are useful to guide future management actions when trying to maintain key aspects of biological diversity. When conservation plans ignore evolutionary distinctiveness and functional divergence, there is a risk of losing valuable functions, because of the loss of entire lineages or functionally unique species (Maherali and Klironornos 2007; Redding et al. 2010). Communities with high richness, endemic species, high heterogeneity, and threatened by human activities are proper systems to study the originality as a surrogate of biodiversity loss. The Brazilian cerrado vegetation presents a wide physiognomic range, going from grasslands to woodlands, but with most of its physiognomies within the definition of tropical savanna (Coutinho 1990). The cerrado encompasses the richest savanna in the world, with many endemic species, and is being rapidly converted into croplands, pastures, or urban areas, putting many species at risk. Thus, it is one of the 25 biodiversity hotspots in the world (Klink and Machado 2005; Myers et al. 2000). In this sense, one may use species originality as a criterion to establish conservation priorities (Pavoine et al. 2005) for the cerrado and, occasionally, for other savannas. Here we simulated three extinction scenarios based on variables that may affect attempts to conserve the cerrado, assessing their consequences in originality loss.
Abundance is an important aspect of diversity and must be taken into account when estimating extinction risk, since the risk increases with decreasing population (Morris and Doak 2002; Purvis et al. 2000). In the cerrado, the intense anthropic pressure further decreases population sizes, increasing the chances of loss. If rare species are more endangered and if original species are rare, then these species are likely to be lost first and many functions in the community may be compromised.
2000). Thus, an increase in fire frequency may lead to a loss of both phylogenetic and functional originalities in cerrado plant communities.
Presence of open or closed physiognomy depends on soil, water availability, and fire frequency (Pivello and Coutinho 1996). Different physiognomies have different floristic compositions, and a given species tend to occur in a given physiognomy according to its requirements (Angelo and Angelini 2007). Open cerrado physiognomies are more vulnerable to the process of loss and fragmentation, because they are more easily converted into agriculture and pasture than closed ones (Tubelis and Cavalcanti 2000). If a given physiognomy is at a higher risk of extinction and if it contains more original species, then this physiognomy must be prioritised in conservation efforts.
Here, we calculated phylogenetic and functional originalities of woody cerrado species and simulated what would happen to the communities under three extinction scenarios. So, we tested whether: (1) phylogenetic and functional originalities were correlated; (2) both originalities were related to environmental variables, such as topography, fire regime, and soil; and (3) the losses of originalities based on abundance, fire tolerance, and habitat preference were different from what would be expected solely by chance. We intended to provide guidelines to management strategies when one wants to minimise biodiversity loss in the cerrado and other savannas.
2. Material and methods
2.1. Study site and sampling
preventive firebreaks, burned annually during the dry season (Ramos-Neto and Pivello 2000). Despite these precautions, another catastrophic fire burned 93% of the reserve in August 2010.
We used a stratified sampling by dividing the study site into 10 strata according to fire history, using satellite images from 1973 to 2009. Then, we randomly placed 10 plots with 5 m x 5 m plots in each stratum. We sampled all woody plants in each plot with stem diameter at soil level equal to or higher than 3 cm (SMA 1997). We identified all plants to the species level by comparing vouchers to ENP’s reference collection (Batalha and Martins 2002). We used Plantminer (Carvalho et al. 2010) to check for synonyms and species authors, and to place them in families according to current classifications. We measured 14 functional traits related to environmental filters, such as drought, fire, and nutrient-depleted soils (Cornelissen et al. 2003; Pausas and Paula 2005; Table 1): basal area, height, height of first bifurcation, resprouting capacity, bark thickness, wood density, leaf toughness, leaf size, specific leaf area, leaf nitrogen content, leaf phosphorus content, leaf potassium content, pollination system, and dispersal mode. The importance of these traits and the way we measured them are described in detail by Cornelissen et al. (2003). In each plot, we measured altitude and slope as surrogates for water availability. In ENP, the higher the altitude and the flatter the terrain, the lower the water availability. We also measured several soil features following Silva and Batalha (2008): pH, organic matter, total nitrogen, available phosphorus, exchangeable potassium, exchangeable calcium, exchangeable magnesium, exchangeable aluminium, sum of bases, cation exchange capacity, base saturation, aluminium saturation, sand proportion, silt proportion, and clay proportion. Based on satellite images from 1984 to 2010, we determined mean interval between fires and time since last fire.
2.2. Phylogenetic and functional originalities
average-
linkage clustering, we assembled a functional dendrogram (Petchey and Gaston 2002; Petchey and Gaston 2006).
We calculated the originality of each species based on both the phylogenetic tree and the functional dendrogram. First, we calculated the distances connecting each pair of species, by summing the branches necessary to link the pairs in the tree or the dendrogram. Then, we calculated originalities as the frequency distribution that maximised quadratic entropy (QE-based index; Pavoine et al. 2005). So, we obtained two originality indices for each species: phylogenetic originality, based on the phylogenetic tree, and functional originality, based on the functional dendrogram.
2.3. Statistical analyses
We tested whether the phylogenetic and fuctional originalities of each species were correlated using the Spearman’s rank correlation, because the data were not normally distributed (Zar 1999). To test whether topography, soil, and fire history predicted originality, first we removed variables that were correlated to each other (-0.7 > R > 0.7) and then did two multiple regressions (Jongman et al. 1995), one for phylogenetic originality and another for functional originality. In each one, the sum of originality species present per plot was the response variable, and altitude, slope, pH, organic matter, nitrogen, phosphorus, potassium, aluminium, sum of bases, cation exchange capacity, base saturation, silt, clay, fire interval, and time since last fire were the explanatory variables. Using the Akaike Information Criterion (Akaike 1973), we ranked the models and selected the best. For it, we compared the models based on ΔAICc, AICcWi, and the coefficient of determination (Burnham and Anderson 2002). The ΔAICc is the difference between each model’s AICc and the “best model”, that is, the one with the lowest AICc. Models with ΔAICc values lower than two may be considered as good as the “best model”. The Akaike weight (AICcWi) provides evidence that the model is the best in the model set.
2.4. Simulated extinction
the order of extinctions was random. The second scenario was based on fire tolerance, assuming that if fire frequency increases, fire-sensitive species are more likely to become extinct (Pausas et al. 1999). We assigned a value to each species corresponding to the lowest fire interval it experienced, which represented the fire frequency the species was able to tolerate. We ranked the species by their fire tolerance and excluded them in increasing order, calculating at each step the remaining originality. If two or more species presented the same fire tolerance, the order of extinctions was random. The third scenario was based on habitat preference, using the vegetation physiognomy as a surrogate for habitat. Since open cerrado physiognomies are more susceptible to the process of loss and fragmentation (Tubelis and Cavalcanti 2000), we assumed that species occurring in open physiognomies were more likely to become extinct. First, we calculated cylindrical volume of each individual (basal area times height) and, then, summed up the cylindrical volumes of all individuals in a given plot. The higher the volume, the closer the physiognomy. We multiplied the cylindrical volume vector by the matrix of species abundances per plot. We then estimated habitat preference as the sum of the columns, obtaining a value for each species that indicated its preference for open or closed physiognomies. We ranked the species by this value and excluded them in increasing order, calculating at each step the remaining originality. In each scenario, we compared extinction trajectory with random ones, in which, at each step, we did 1,000 randomisations, excluding species at random and calculating the remaining originality. We calculated the mean and the 95% confidence intervals of the randomisations and compared both observed and random extinction trajectories. We did all analyses in R (R Development Core Team 2009).
3. Results
We sampled 531 individuals, belonging to 55 species and 26 families (Appendix). The richest families were Fabaceae (10 species) and Myrtaceae (9 species). We assessed the phylogenetic and functional originalities these 55 species (Figures 1 and 2). The most original species according to evolutionary history were Roupala montana, Davilla elliptica, Guapira noxia, Styrax ferrugineus, and Diospyros hispida (Figure 1), whereas the most original species regarding functional traits were R. montana, Qualea parviflora, Plenckia populnea, G. noxia, and Lafoensia pacari (Figure 2). We found a weak, but significant and positive, correlation between both originality indices (ρ = 0.38, P < 0.01).
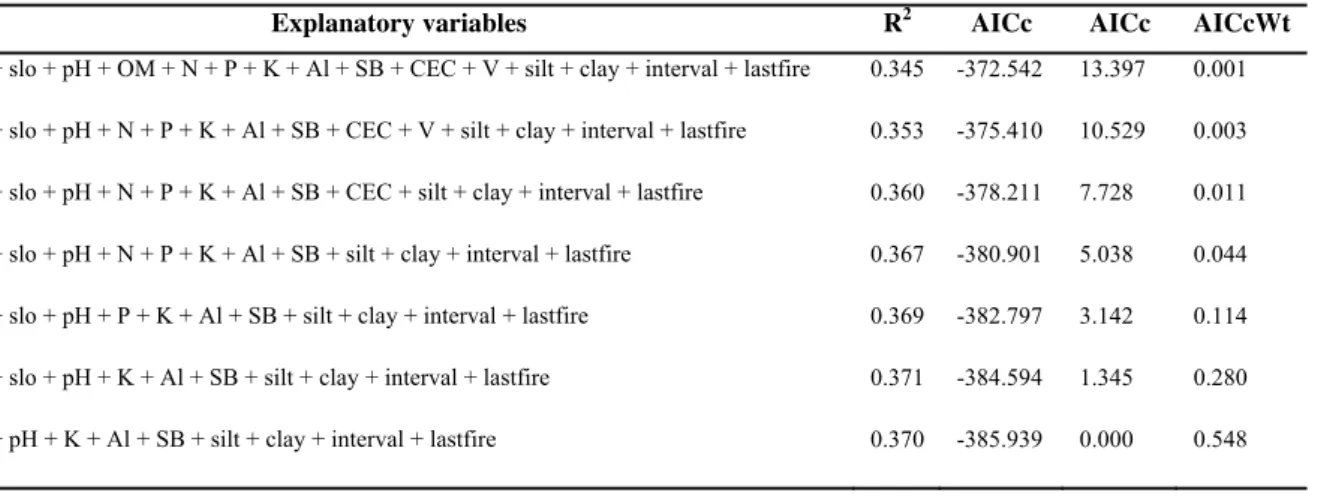
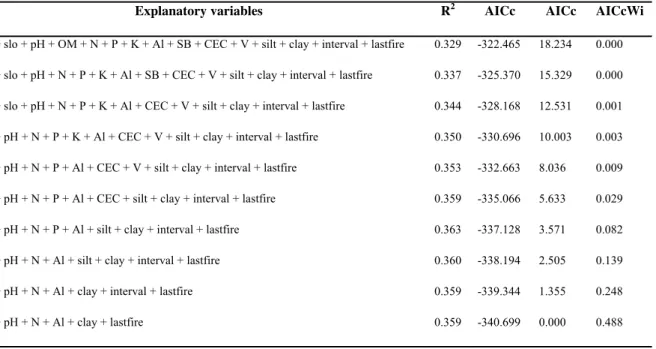
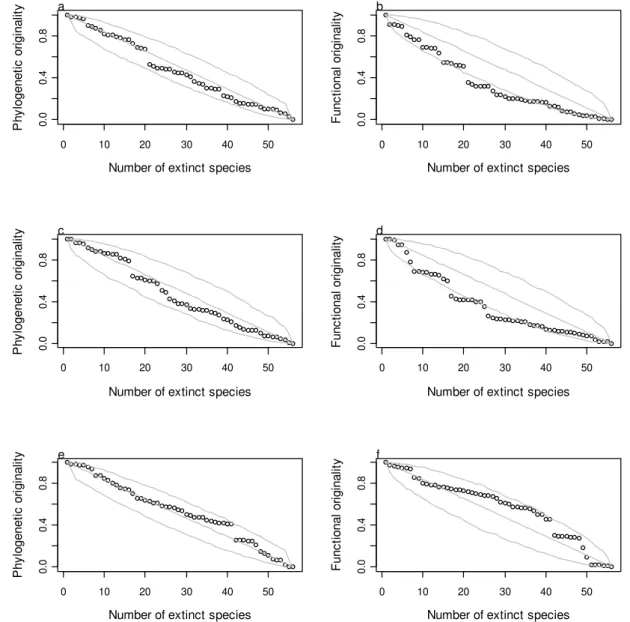
and fire interval and negatively related with pH, sum of bases, silt, clay, and time since last fire (Table 2). Functional originality was positively related with altitude, aluminium, and fire interval and negatively related with pH, nitrogen, clay, and time since last fire (Table 3). In the abundance and fire tolerance extinction scenarios, the losses of functional originality were higher than expected by chance, at least at some points of the trajectories (Figures 3b and 3d, Appendix), but the losses of phylogenetic originality were not different from the expected by chance (Figures 3a and 3c, Appendix). On the other hand, in the habitat preference scenario, the losses of both originalities were indistinguishable from random (Figure 3e and 3f, Appendix).
4. Discussion
Phylogenetic and functional originalities were positively correlated, pointing out that, in general, the more isolated the species in the phylogeny, the more functionally unique it was, a pattern also found elsewhere (Magnuson-Ford et al. 2009). For instance, R. montana was the most isolated species in the tree and also the most functionally distinct. Less functionally original species were within lineages with many species, such as Myrtaceae. Functional originality was more uneven than phylogenetic originality, that is, fewer species contributed more to trait diversity. This pattern was similar to that found when evaluating traits related to protection against herbivory in another cerrado community (Silva et al. 2011). Whereas it is generally assumed that traits are retained during the evolution of plant species lineages (Arkerly 2003), phylogenetic signal is absent for many traits of the plant species (Cavender-Bares et al. 2004). In a study carried out with ten out of 14 traits we sampled, phylogenetic signal was absent for basal area, bark thickness, and leaf toughness (Batalha et al. 2011). The combination of conserved and non-conserved traits probably led to the weak correlation we found.
originalities increased towards harsher environments. In these environments, differences in species abilities to explore the limited resources are essential to allow their coexistence (Petchey 2003). Communities with high originality presented both more species and highly original species. In these communities, complementarity among species may result in facilitation (Quintana-Ascencio and Menges 2000), because original plants will not compete for the same resources or, at least, will use them in different manners. Thus, they can respond differently to the environment and carry out different ecological functions (McEwen and Vamosi 2010; Mouillot et al. 2008; Tielbörger and Kadmon 2000). High originality in harsh environments leads to higher complementarity among species and, consequently, to communities that may operate better (Mouillot et al. 2008; O’Gorman et al. 2010; Pavoine et al. 2005).
ones, which are often neglected and more easily turned into pastures or crop fields.
Phylogenetic and functional originalities were positively correlated, responded to the same environmental variables, and followed similar trajectories in the habitat-based extinction scenario. This set of results indicated that either phylogenetic or functional originality could be used interchangeably, at least to define conservation priorities. As long as phylogenetic originality is easier to be calculated, because there is no need to measure functional traits, which is time and resource consuming, it would be the best choice if one wanted to preserve both evolutionary history and trait diversity. However, taking into account extinction scenarios based on species abundances and fire tolerance, losses of phylogenetic originality were random, which constrasted with losses of functional originality that were higher than expected by chance. Taking these results into account, functional originality seems to be a more accurate descriptor of the maintenance of community functioning. Rare and fire-sensitive species are intrinsically more vulnerable. If they become extinct, many ecological functions will be lost, potentially leading to decreases in community stability and resilience, and, occasionally, to cascade extinctions due to loss of key interactions. If so, these species should be prioritised in management actions.
Acknowledgments
We are grateful to Fapesp, for financial support and scholarship granted to the first author; to Capes, for the scholarship granted to the second author, to CNPq, for the fellowship granted to the third author; to Ibama and Emas National Park staff, for research permission; to GH Carvalho, MV Cianciaruso, VL Dantas, NA Escobar, CS Gonçalves, PP Loiola, and IA Silva, for help in the field; and to H França, for the satellite images and fire history.
References
Ackerly DD (2003) Community assembly, niche conservatism, and adaptive evolution in changing environments. Int J Plant Sci 164: 165-184
Akaike H (1973) Information theory and an extension of the maximum likelihood principle. In: Petran BN, Csaki F (eds) International Symposium on Information Theory. Akademiai Kiado, Budapeste, pp 267-281
Batalha MA, Martins FR (2002) The vascular flora of the cerrado in Emas National Park (Goiás, central Brazil). Sida 20: 295-311
Batalha MA, Silva IA, Cianciaruso MV, França H, Carvalho GH (2011) Phylogeny, traits, environment, and space in cerrado plant communities at Emas National Park (Brazil). Flora 206: 949-956
Bracken MES, Low NHN (2012) Realistic losses of rare species disproportionately impact higher trophic levels. Ecol let 15: 461-467
Burnham KP, Anderson DR (2002) Model selection and multimodel inference: a pratical information-theoretical approach. Springer-Verlag, New York
Carvalho GH, Cianciaruso MV, Batalha MA (2010) Plantminer: a web tool for checking and gathering plant species taxonomic information. Environ Modell Softw 25: 815-816
Cavender-Bares J, Ackerly DD, Baum DA, Bazzaz FA (2004) Phylogenetic overdispersion in floridian oak communities. Am Nat 163: 823-843
Cornelissen JHC, Lavorel S, Garnier E, Díaz S, Buchmann N, Gurvich DE, Reich PB, ter Steege H, Morgan HD, van der Heijden MGA, Pausas JG, Poorter H (2003) A handbook of protocols for standardised and easy measurement of plant functional traits worldwide. Aust J Bot 51: 335-380
Coutinho LM (1990) Fire in the ecology of the Brazilian cerrado. In: Goldammer JG (ed) Fire in the tropical biota. Springer, Berlin, pp 81-103
Eiten G (1972) The cerrado vegetation of Brazil. Bot rev 38: 201-341.
França H, Ramos-Neto MB, Setzer A (2007) O fogo no Parque Nacional das Emas. Ministério do Meio Ambiente, Brasília
Gaston KJ (1994) Rarity. Chapman and Hall, London
Goodland R (1971) Oligotrofismo e alumínio no cerrado. In: Ferri MG (eds.) III Simpósio sobre o Cerrado. Edgar Blücher, São Paulo, pp 44-60
Gottsberger G, Silberbauer-Gottsberger I (2006) Life in the cerrado: a South American tropical seasonal vegetation, vol 1, Origin, structure, dynamics and plant use. Reta, Ulm
Hoffmann WA (1999) Fire and population dynamics of woody plants in a neotropical savanna: matrix model projections. Ecology 80: 1354-1369
Hoffmann WA (2002) Direct and indirect effects of fire on radial growth of cerrado savanna trees. J Trop Ecol 18: 137-142
boundaries under frequent fire in central Brazil. Ecology 90: 1326-1337
Jongman RHG, Braak CJF, Tongeren OFR (1995) Data analysis in community and landscape ecology. Cambridge University, Cambridge
Kauffman JB, Cummings DL, Ward DE (1994) Relationships of fire, biomass and nutrient dynamics along a vegetation gradient in the Brazilian cerrado. J Ecol 82: 519-531
Klink CA, Machado RB (2005) A conservação do cerrado brasileiro. Megadiversidade 1: 147-155
Köppen W (1931) Grundriss der Klimakunde. Gruyter, Berlin Larcher W (1995) Physiological plant ecology. Springer, New York
Lyons KG, Brighan CA, Traut BH, Schwartz MW (2005) Rare species and ecosystem functioning. Conserv Biol 19: 1019-1024
Magnuson-Ford K, Ingram T, Redding DW, Mooers AØ (2009) Rockfish (Sebastes) that are evolutionarily isolated are also large, morphologically distinctive and vulnerable to overfishing. Biol Conserv 142: 1787-1796
Maherali H, Klironomos JN (2007) Influence of phylogeny on fungal community assembly and ecosystem functioning. Science 316: 1746-1748
McEwen JR, Vamosi JC (2010) Floral colour versus phylogeny in structuring subalpine flowering communities. P Roy Soc Lond B Bio 277: 2957–295
Moreira AG (2000) Effects of fire protection on savanna structure in Central Brazil. J Biogeogr 27: 1021-1029
Morris WF, Doak DF (2002) Quantitative conservation biology: theory and practice of population viability analysis. Sinauer Inc, Sunderland
Mouillot D, Culioli JM, Pelletier D, Tomasini JA (2008) Do we protect biological originality in protected areas? A new index and an application to the Bonifacio Strait Natural Reserve. Biol Conserv 141: 1569-1580
Myers N, Mittermeier RA, Mittermeier CG, Fonseca GAB, Kent J (2000) Biodiversity hotspots for conservation priorities. Nature 403: 853-858
O’Gorman EJ, Yearsley JM, Crowe TP, Emmerson MC, Jacob U, Petchey OL (2011) Loss of functionally unique species may gradually undermine ecosystems. P Roy Soc Lond B Bio 278: 1886-1893
Pausas JG (1999) Response of plant functional types to changes in the fire regime in Mediterranean ecosystems: a simulation approach. J Veg Sci 10: 717–722
Pavoine S, Baguette M, Bonsall MB (2010) Decomposition of traits diversity among the nodes of a phylogenetic tree. Ecol Monogr 80: 485-507
Pavoine S, Bonsall MB (2011) Measuring biodiversity to explain community assembly: a unified approach. Biol Rev. doi: 10.1111/j.1469-185X.2010.00171.x
Pavoine S, Ollier S, Dufour AB (2005) Is the originality of a species measurable? Ecol Lett 8: 579-586
Pavoine S, Vela E, Gachet S, Bélair G, Bonsall MB (2011) Linking patterns in phylogeny, traits, abiotic variables and space: a novel approach to linking environmental filtering and plant community assembly. J Ecol 99: 165–175
Petchey OL (2003) Integrating methods that investigate how complementarity influences ecosystem functioning. Oikos 101: 323-330
Petchey OL, Evans KL, Fishburn IS, Gaston KJ (2007) Low functional diversity and no redundancy in British avian assemblages. J Anim Ecol 76: 977-985
Petchey OL, Gaston KJ (2002) Functional diversity (FD), species richness, and community composition. Ecol Lett 5: 402-411
Petchey OL, Gaston KJ (2006) Functional diversity: back to basics and looking forward. Ecol Lett 9: 741-758
Pivello VR, Coutinho LM (1996) A qualitative successional model to assist in the management of Brazilian cerrados. Forest Ecol Manag 87: 127-138
Purvis A, Gittleman JL, Cowlishaw G, Mace GM (2000) Predicting extinction risk in declining species. Roy Soc Lond B Bio 267: 1947-1952
Quintana-Ascencio PF, Menges ES (2000) Competitive abilities of three narrowly endemic plant species in experimental neighborhoods along a fire gradient. Am J Bot 87: 690–699 Ramos-Neto MB, Pivello VR (2000) Lightning fires in a Brazilian savanna National Park: rethinking management strategies. Environ Manage 26: 675-684
R Development Core Team (2009) R: A language and environment for statistical computing. R Foundation for Statistical Computing, Vienna. URL: http://www.r-project.org.
Redding DW, Dewolff CV, Mooers AØ (2010) Evolutionary distinctiveness, threat status, and ecological oddity in primates. Conserv Biol 24: 1052–1058
Redding DW, Mooers AØ (2006) Incorporating evolutionary measures into conservation prioritization. Conserv Biol 20: 1670–1678
Silva DM, Batalha MA (2008) Soil–vegetation relationships in cerrados under different fire frequencies. Plant Soil 311: 87-96
community. Plant Ecol 212: 181-193
Silva DM, Silva IA, Batalha MA (2011) Phylogenetic and phenotypic originality and abundance in a cerrado plant community. Austral Ecol. doi: 10.1111/j.1442-9993.2011.02277.x
SMA, Secretaria de Estado do Meio Ambiente (1997) Cerrado: bases para conservação e uso sustentável das áreas de cerrado do estado de São Paulo. SMA, São Paulo
Tielbörger K, Kadmon R (2000) Temporal environmental variation tips the balance between facilitation and interference in desert plants. Ecology 81: 1544-1553
Tubelis DP, Cavalcanti RB (2000) A comparison of bird communities in natural and disturbed non-wetland open habitats in the Cerrado´s central region, Brazil. Bird Conserv Int 10: 331-350
Vane-Wright RI, Humphries CJ, Willians PH (1991) What to protect? – Systematics and the agony of choice. Biol Conserv 55: 235-254
Walker B, Kinzig A, Langridge J (1999) Plant attribute diversity, resilience, and ecosystem function: the nature and significance of dominant and minor species. Ecosystems 2: 95-113 Webb CO, Ackerly DD, Kembel SW (2008) Phylocom: software for the analysis of phylogenetic community structure and trait evolution. Bioinformatics 24: 2098-2100
Webb CO, Donoghue MJ (2005) Phylomatic: tree assembly for applied phylogenetics. Mol Ecol Notes 5: 181-183
Wikström N, Savolainen V, Chase MW (2001) Evolution of the angiosperms: calibrating the family tree. Roy Soc Lond B Bio 268: 2211-2220
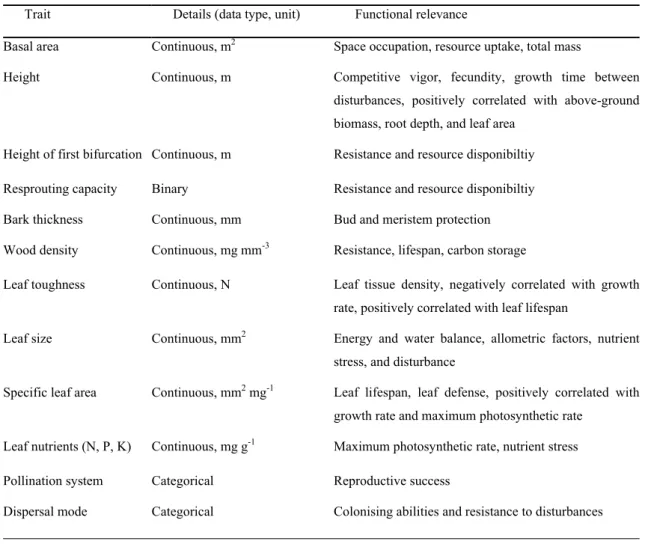
Table 1. Plant traits used to calculate functional originality and their functional relevance (see Cornelissen et
al. 2003 for more details).
Trait Details (data type, unit) Functional relevance
Basal area Continuous, m2 Space occupation, resource uptake, total mass
Height Continuous, m Competitive vigor, fecundity, growth time between
disturbances, positively correlated with above-ground
biomass, root depth, and leaf area
Height of first bifurcation Continuous, m Resistance and resource disponibiltiy
Resprouting capacity Binary Resistance and resource disponibiltiy
Bark thickness Continuous, mm Bud and meristem protection
Wood density Continuous, mg mm-3 Resistance, lifespan, carbon storage
Leaf toughness Continuous, N Leaf tissue density, negatively correlated with growth
rate, positively correlated with leaf lifespan
Leaf size Continuous, mm2 Energy and water balance, allometric factors, nutrient
stress, and disturbance
Specific leaf area Continuous, mm2 mg-1 Leaf lifespan, leaf defense, positively correlated with growth rate and maximum photosynthetic rate
Leaf nutrients (N, P, K) Continuous, mg g-1 Maximum photosynthetic rate, nutrient stress
Pollination system Categorical Reproductive success
Dispersal mode Categorical Colonising abilities and resistance to disturbances
Table 2. Values calculated for the model selection of multiple regression analysis, using phylogenetic
originality per plot as response variable and soil, topography, and fire history as explanatory variables. alt =
altitude, slop = slope, OM = organic matter, N = nitrogen, P = phosphorus, K= potassium, Al = aluminium, SB
= sum of bases, CEC = cation exchange capacity, V = base saturation, silt = silt proportion, clay = clay
proportion, interval = fire interval, lastfire = time since last fire.
Explanatory variables R2 AICc AICc AICcWt
alt + slo + pH + OM + N + P + K + Al + SB + CEC + V + silt + clay + interval + lastfire 0.345 -372.542 13.397 0.001
alt + slo + pH + N + P + K + Al + SB + CEC + V + silt + clay + interval + lastfire 0.353 -375.410 10.529 0.003
alt + slo + pH + N + P + K + Al + SB + CEC + silt + clay + interval + lastfire 0.360 -378.211 7.728 0.011
alt + slo + pH + N + P + K + Al + SB + silt + clay + interval + lastfire 0.367 -380.901 5.038 0.044
alt + slo + pH + P + K + Al + SB + silt + clay + interval + lastfire 0.369 -382.797 3.142 0.114
alt + slo + pH + K + Al + SB + silt + clay + interval + lastfire 0.371 -384.594 1.345 0.280
Table 3. Values calculated for the model selection of multiple regression analysis, using functional originality
per plot as response variable and soil, topography, and fire history as explanatory variables. alt = altitude, slop =
slope, OM = organic matter, N = nitrogen, P = phosphorus, K= potassium, Al = aluminium, SB = sum of bases,
CEC = cation exchange capacity, V = base saturation, silt = silt proportion, clay = clay proportion, interval = fire
interval, lastfire = time since last fire.
Explanatory variables R2 AICc AICc AICcWi
alt + slo + pH + OM + N + P + K + Al + SB + CEC + V + silt + clay + interval + lastfire 0.329 -322.465 18.234 0.000
alt + slo + pH + N + P + K + Al + SB + CEC + V + silt + clay + interval + lastfire 0.337 -325.370 15.329 0.000
alt + slo + pH + N + P + K + Al + CEC + V + silt + clay + interval + lastfire 0.344 -328.168 12.531 0.001
alt + pH + N + P + K + Al + CEC + V + silt + clay + interval + lastfire 0.350 -330.696 10.003 0.003
alt + pH + N + P + Al + CEC + V + silt + clay + interval + lastfire 0.353 -332.663 8.036 0.009
alt + pH + N + P + Al + CEC + silt + clay + interval + lastfire 0.359 -335.066 5.633 0.029
alt + pH + N + P + Al + silt + clay + interval + lastfire 0.363 -337.128 3.571 0.082
alt + pH + N + Al + silt + clay + interval + lastfire 0.360 -338.194 2.505 0.139
alt + pH + N + Al + clay + interval + lastfire 0.359 -339.344 1.355 0.248
Figure 1. Phylogenetic tree assembled for the cerrado species sampled in Emas National Park, central Brazil
(17°49’-18°28’S and 52°39’-53°10’W) with phylogenetic originalities. The relationship among species was
based on the current Phylomatic tree (tree R20091110; Webb and Donoghue, 2005).
Aspidosperma tomentosum Hancornia speciosa Palicourea rigida Tabebuia aurea Tabebuia ochracea Solanum lycocarpum Didymopanax malmei Eremanthus erythropappus Piptocarpha rotundifolia Diospyros hispida Pouteria ramiflora Pouteria torta Styrax ferrugineus Caryocar brasiliense Kielmeyera coriacea Erythroxylum campestre Erythroxylum suberosum Erythroxylum tortuosum Byrsonima basiloba Byrsonima coccolobifolia Byrsonima verbascifolia Ouratea acuminata Ouratea spectabilis Casearia sylvestris Plenckia populnea Connarus suberosus Rourea induta Acosmium dasycarpum Machaerium acutifolium Albizia hassleri Anadenanthera falcata Stryphnodendron adstringens Mimosa amnis atri Dimorphandra mollis Diptychandra aurantiaca Hymenaea stigonocarpa Sclerolobium aureum Lafoensia pacari Miconia albicans Mouriri elliptica Eugenia aurata Eugenia bimarginata Eugenia punicifolia Psidium laruotteanum Myrcia bella Myrcia camapuensis Myrcia crassifolia Myrcia guianensis Myrcia lasiantha Qualea parviflora Eriotheca gracilipes Eriotheca pubescens Davilla elliptica Guapira noxia Roupala montana
0 0.5 0.1 0.15
Phylogenetic originality
140 100 60 40 20 0
Figure 2. Functional dendrogram assembled for the cerrado species sampled in Emas National Park, central
Brazil (17°49’-18°28’S and 52°39’-53°10’W) with functional originalities. Roupala montana Plenckia populnea Qualea parviflora Machaerium acutifolium Eriotheca gracilipes Kielmeyera coriacea Acosmium dasycarpum Tabebuia ochracea Eriotheca pubescens Tabebuia aurea Albizia hassleri Mimosa amnis atri Eremanthus erythropappus Piptocarpha rotundifolia Aspidosperma tomentosum Diptychandra aurantiaca Caryocar brasiliense Byrsonima basiloba Miconia albicans Myrcia camapuensis Myrcia guianensis Myrcia lasiantha Mouriri elliptica Psidium laruotteanum Myrcia bella Ouratea acuminata Ouratea spectabilis Styrax ferrugineus Eugenia bimarginata Solanum lycocarpum Myrcia crassifolia Byrsonima verbascifolia Eugenia aurata Eugenia punicifolia Byrsonima coccolobifolia Davilla elliptica Hymenaea stigonocarpa Palicourea rigida Didymopanax malmei Stryphnodendron adstringens Erythroxylum tortuosum Rourea induta Connarus suberosus Erythroxylum campestre Erythroxylum suberosum Casearia sylvestris Hancornia speciosa Diospyros hispida Pouteria ramiflora Pouteria torta Guapira noxia Lafoensia pacari Sclerolobium aureum Anadenanthera falcata Dimorphandra mollis
0 0.5 0.1 0.15
Functional originality
0.4 0.3 0.2 0.1 0
Figure 3. Filled circles represent the extinction trajectory following traits, gray lines represent mean and 95%
confidence intervals of 1.000 random extinction trajectories. Abundance-based extinction trajectory: (a)
phylogenetic originality and (b) functional originality. Fire-tolerance-based extinction trajectory: (c)
phylogenetic originality and (d) functional originality. Habitat-preference-based extinction trajectory: (e)
phylogenetic originality and (f) functional originality.
0 10 20 30 40 50
0. 0 0. 4 0 .8
Number of extinct species
P h y logenet ic or igi nal it y a
0 10 20 30 40 50
0. 0 0. 4 0 .8
Number of extinct species
P h y logenet ic or igi nal it y c
0 10 20 30 40 50
0. 0 0 .4 0. 8
Number of extinct species
P hy lo genet ic or igi na lit y e
0 10 20 30 40 50
0. 0 0. 4 0 .8
Number of extinct species
F unc ti onal ori gi nal it y b
0 10 20 30 40 50
0. 0 0. 4 0 .8
Number of extinct species
F unc ti onal ori gi nal it y d
0 10 20 30 40 50
0. 0 0 .4 0. 8
Number of extinct species
Appendix. Relative abundance, fire tolerance, and habitat preference for the 55 cerrado species sampled in
Emas National Park, central Brazil (17°49’-18°28’S and 52°39’-53°10’W). Fire tolerance is based on the lowest
fire interval, in years, a given species had experienced. Habitat preference reflects the occurrence of a given
species in open or closed physiognomies. The higher the value, the closer the physiognomy.
Family Species Relative
Abundance tolerance Fire preference Habitat
Fabaceae Acosmium dasycarpum (Vogel) Yakovlev 0.0226 2.250 0.097
Fabaceae Albizia hassleri (Spruce ex Benth.) Burkart 0.0019 3.500 1.000
Fabaceae Anadenanthera falcata (Benth.) Reis 0.0282 1.700 0.289
Apocynaceae Aspidosperma tomentosum Mart. 0.0019 2.120 0.000
Malpighiaceae Byrsonima basiloba A. Juss. 0.0056 2.370 0.338
Malpighiaceae Byrsonima coccolobifolia Kunth 0.0094 2.250 0.211
Malpighiaceae Byrsonima verbascifolia (L.) DC. 0.0019 4.400 0.310
Caryocaraceae Caryocar brasiliense A. St.-Hil. 0.0019 4.400 0.310
Salicaceae Casearia sylvestris Sw. 0.0075 2.370 0.024
Connaraceae Connarus suberosus Planch. 0.0791 2.000 0.129
Dilleniaceae Davilla elliptica A. St.-Hil. 0.0113 2.570 0.403
Fabaceae Dimorphandra mollis Benth. 0.0019 3.000 0.177
Ebenaceae Diospyros hispida A.DC. 0.0151 2.000 0.105
Fabaceae Diptychandra aurantiaca Tul. 0.0151 2.710 0.211
Asteraceae Eremanthus erythropappus (DC.) MacLeish 0.0056 1.700 0.128
Malvaceae Eriotheca gracilipes (K. Schum.) A.Robyns 0.0640 2.120 0.180
Malvaceae Eriotheca pubescens (Mart. And Zucc.) Schott and Endl.
0.0075 3.330 0.102
Erythroxylaceae Erythroxylum campestre A. St.-Hil. 0.0019 1.700 0.019
Erythroxylaceae Erythroxylum suberosum A. St.-Hil. 0.0038 1.700 0.226
Erythroxylaceae Erythroxylum tortuosum Mart. 0.0320 2.710 0.141
Myrtaceae Eugenia aurata O. Berg 0.0019 2.370 0.047
Myrtaceae Eugenia bimarginata DC. 0.0075 2.250 0.022
Myrtaceae Eugenia punicifolia (Kunth) DC. 0.0019 2.710 0.572
Nyctaginaceae Guapira noxia (Netto) Lundell 0.0038 2.420 0.040
Apocynaceae Hancornia speciosa Gomes 0.0019 2.000 0.116
Fabaceae Hymenaea stigonocarpa Mart. Ex Hayne 0.0019 2.420 0.162
Lythraceae Lafoensia pacari A.St.-Hil. 0.0301 4.400 0.422
Fabaceae Machaerium acutifolium Vogel 0.0019 2.250 0.246
Melastomataceae Miconia albicans (Sw.) Steud. 0.0038 2.000 0.081
Fabaceae Mimosa amnis atri Barneby 0.0075 1.180 0.150
Melastomataceae Mouriri elliptica Mart. 0.0320 2.710 0.970
Myrtaceae Myrcia bella Cambess. 0.0019 2.710 0.373
Myrtaceae Myrcia camapuensis N.Silveira 0.0132 2.000 0.555
Myrtaceae Myrcia guianensis (Aubl.) DC. 0.0038 5.750 0.395
Myrtaceae Myrcia lasiantha DC. 0.0019 4.400 0.310
Myrtaceae Myrcia obovata (O. Berg) Nied. 0.0019 3.330 0.102
Ochnaceae Ouratea acuminata (DC.) Engl. 0.0019 2.250 0.361
Ochnaceae Ouratea spectabilis (Mart. Ex. Engl.) Engl. 0.0471 4.200 0.238
Rubiaceae Palicourea rigida Kunth 0.0094 2.570 0.054
Asteraceae Piptocarpha rotundifolia (Less.) Baker 0.0038 1.270 0.084
Celastraceae Plenckia populnea Reissek 0.0358 4.400 0.422
Sapotaceae Pouteria ramiflora (Mart.) Radlk. 0.0019 1.880 0.231
Sapotaceae Pouteria torta (Mart.) Radlk. 0.1827 1.180 0.063
Myrtaceae Psidium laruotteanum Cambess. 0.0885 1.270 0.108
Vochysiaceae Qualea parviflora Mart. 0.0621 4.400 0.422
Proteaceae Roupala montana Aubl. 0.0019 2.710 0.316
Connaraceae Rourea induta Planch. 0.0038 4.200 0.035
Araliaceae Schefflera malmei (Harms) Frodin 0.0019 5.750 0.395
Fabaceae Sclerolobium aureum (Tul.) Bail. 0.0038 2.570 0.047
Solanaceae Solanum lycocarpum A. St.-Hil. 0.0019 2.370 0.039
Fabaceae Stryphnodendron adstringens (Mart.) Coville 0.0603 2.000 0.122
Styracaceae Styrax ferrugineus Neess and Mart. 0.0075 2.370 0.573
Bignoniaceae Tabebuia aurea (Silva Manso) S. Moore 0.0056 2.710 0.115
CONCLUSÃO GERAL