Lognormal abundance distribution of woody species in a cerrado fragment
(São Carlos, southeastern Brazil)
FABIOLA FERREIRA OLIVEIRA
1and MARCO ANTÔNIO BATALHA
1, 2(received: January 22, 2004; accepted: October 28, 2004)
ABSTRACT – (Lognormal abundance distribution of woody species in a cerrado fragment (São Carlos, southeastern Brazil)).
The lognormal distribution model is frequently found in communities, especially those which are rich in species and influenced by many environmental factors, as those of the cerrado. We tested the hypothesis that the abundance distribution of woody plant species in a cerrado fragment fits the lognormal model. We placed 20 lines in a cerrado fragment and sampled, with the point-quarter method, 800 individuals with stem perimeter equal or larger than 3 cm. We plotted the abundance-class histogram of the species, verified its normality with the Kolmogorov-Smirnov test, and estimated the expected number of woody species for this community. Of the 63 obtained species, Anadenanthera falcata (with 185 species), Eriotheca gracilipes (43), Stryphnodendron obovatum (37),and Miconia albicans (36) were the most abundant ones. Twelve species were represented by only one individual. We did not reject the null hypotheses that the distribution of woody component species was normal and, thus, their abundances fitted the lognormal model. Therefore, with our work, we can predict that cerrado plant communities fit the lognormal model. If this pattern is maintained in other cerrado communities, there would be implications for the conservation of this vegetation type, because rare species are susceptible of extinction, and implications to their structure, because the dominant species may act as keystone species.
Key words - abundance, cerrado, lognormal distribution, savanna
RESUMO – (Distribuição normal-logarítmica de espécies arbustivo-arbóreas em um fragmento de cerrado (São Carlos, Sudeste
do Brasil)). O modelo normal-logarítmico é freqüentemente encontrado em comunidades, sobretudo naquelas ricas e determinadas por vários fatores ambientais, como o são as comunidades vegetais de cerrado. Testamos a hipótese de que a distribuição de abundância das espécies arbustivo-arbóreas em uma comunidade vegetal de cerrado sensu stricto se ajusta ao modelo normal-logarítmico. Para isso, lançamos 20 linhas em um fragmento de cerrado, nas quais amostramos 800 indivíduos arbustivo-arbóreos pelo método de quadrantes. Construímos o histograma da distribuição das freqüências das espécies, verificamos sua normalidade com o teste Kolmogorov-Smirnov e estimamos o número esperado de espécies arbustivo-arbóreas para a comunidade. Das 63 espécies encontradas, Anadenanthera falcata (com 185 indivíduos), Eriotheca gracilipes (43), Stryphnodendron obovatum (37)e Miconia albicans (36)foram as mais abundantes. Doze espécies foram representadas por um único indivíduo. Não rejeitamos a hipótese nula de que a distribuição de espécies arbustivo-arbóreas foi normal e, portanto, suas abundâncias se ajustaram ao modelo normal-logarítmico. Dessa forma, com nosso trabalho, podemos prever que comunidades vegetais de cerrado se ajustam ao modelo normal-logarítmico. Se, de fato, esse padrão se mantiver em outras comunidades de cerrado, existirão implicações para a conservação desse tipo vegetacional, pois as espécies raras são susceptíveis à extinção, e para a estrutura da comunidade, já que as espécies dominantes podem funcionar como espécies-chave.
Palavras-chave - abundância, cerrado, distribuição normal-logarítmica, savana
Introduction
The investigation of species abundance distribution is one of the ways to study a community, establishing a mathematical model to represent the number of species and their abundance (Cielo Filho et al. 2002). A species
abundance distribution uses all the information gathered in a community and is the most complete mathemathical
description of the data (Magurran 1996). Despite its importance, there are few attempts to employ goodness-of-fit tests against abundance distributions observed in the field (Dewdney 2003). The abundance distribution among species in a community explained by a mathematical model can be associated to biological arguments (Whittaker 1972, May 1975, Sugihara 1980). In no community examined, all species are equally common: some species are very abundant, some have medium abundance, and some are represented by only a few individuals (Magurran 1996). Raunkiaer (1918) was the first to suggest that there should be a relationship describing the number of species and their
relative abundance in a community. Since then, various models have been proposed to describe species richness and abundance patterns, such as the geometric series (Motomura 1932), the logseries (Fisher et al. 1943), the lognormal (Preston 1948), the
broken stick (MacArthur 1957), and the multispecies logistical (Dewdney 2003).
The lognormal model has been considered a statistical model (Tokeshi 1993), a consequence of the Central Limit Theorem (May 1975), but Sugihara’s (1980) sequential breakage model stated a biological rationale for the lognormal model. The existence of an hierarchical niche structure in the community and the reflection of this niche structure upon the abundance patterns implies a biological argument of the lognormal model to groups of taxonomically related organisms (Sugihara 1980). An hierarchical niche structure implies that each species making up the community is different from the others and none is redundant (Kevan et al.
1997).
The lognormal abundance distribution (Preston 1948) is widely used to describe patterns in community structure (Engen et al. 2002). It is expected for
communities with a large number of species (Whittaker 1965, May 1975, Gray 1987) and whose abundances are influenced by many independent factors (May 1975). In the lognormal distribution, there are few species with high or low abundances and many with intermediate ones (Magurran 1996). Lognormal distributions are widespread not only in ecological communities, but also in physics, medicine, linguistics, social sciences, and economics (Limpert et al. 2001).
A lognormal curve can be expressed either as a rank abundance plot or as a frequency distribution (Magurran 1996). In the first case, species are ranked from highest to lowest abundance, and their abundances are plotted, with the y axis in log scale (Magurran 1996,
Plotkin & Muller-Landau 2002). In the second case, frequency distribution is represented by a histogram, with the x axis in log scale (Magurran 1996, Plotkin &
Muller-Landau 2002). These two types of plots highlight the aspect of the data that the ecologist wishes to emphasize (Magurran 1996). In the lognormal model, in which the normal-shaped curve is highlighted, the frequency distribution is normally used (Magurran 1996). In the frequency distribution, the number of species (y axis) is plotted against the number of individuals in a
log scale (x axis). The resulting classes are termed
“octaves” and, if log2 is used, they represent doubling in species abundances (Preston 1948).
The lognormal distribution is sensitive to sample size:
if the data to which the curve is to be fitted derive from a small sample, the left portion of the curve, representing rare and unsampled species, is obscured (Magurran 1996). The truncation point is termed “veil line” (Preston 1948) and the smaller the sample, the further the veil line will be from the origin of the curve (Magurran 1996). With an increase in sample size, the veil line approaches the origin and the bell-shaped curve is revealed (Preston 1948, Rolim & Nascimento 1997).
The Cerrado Domain is the second most widespread phytogeographic region in Brazil, formerly occupying 23% of the Brazilian territory (Ratter et al.
1997). In the southeast of São Paulo State, the cerrado vegetation covered 80% of the territory, but nowadays only 12% remain (Secretaria do Meio Ambiente 1997). The cerrado vegetation is not uniform in physiognomy, ranging from grassland to tall woodland (Coutinho 1990), but most of its physiognomies lie within the range defined as tropical savanna (Sarmiento 1983). Owing to its high richness, high degree of endemism, and present conservation status, Fonseca et al. (2000) included the
cerrado among the 25 biodiversity hotspots for conservation in the world.
As previously stated, the lognormal distribution is widely found in communities with a large number of species and influenced by many independent factors (Whittaker 1965, May 1975, Gray 1987). Since the cerrado vegetation is rich in species (Castro et al. 1999)
and influenced by many environmental factors, such as water stress, fire, flooding, soil fertility, and aluminium toxicity (Lopes & Cox 1977), we postulated that the community of woody species in a cerrado fragment fits the lognormal abundance distribution. Although there are many phytosociological surveys carried out in cerrado areas (Castro et al. 1999), none applied abundance
distribution models. Our aim was to study the abundance distribution of woody species in a cerrado fragment, testing the hypothesis that the abundance distribution fits the lognormal model.
Material and methods
In a cerrado area, located at the northwestern portion of the campus, we randomly placed 20 lines, perpendicularly to the fragment edge. In each line, we systematically placed ten points, 10 m apart one from the other. We used the point-quarter method (Mueller-Dombois & Ellenberg 1974) to sample the woody component of the plant community. We considered as belonging to the woody component all living individuals with stem diameter at soil level equal or larger than 3 cm (SMA 1997). In the 20 lines, we sampled 800 individuals. We identified the sampled individuals with an identification key based on vegetative characters (Batalha & Mantovani 1999), collected voucher samples of each species, and lodged them at the Federal University of São Carlos herbarium. We classified the species into families according to the system proposed by Judd et al. (1999).
We ranked the sampled species in decreasing order of abundance and constructed a frequency distribution histogram, using log2 (Preston 1948). For the x axis, we had the following octaves: 0-1, 1-2, 2-4, 4-8, 8-16, 16-32, 32-64 individuals, and so on. When we found abundances in the limit between two octaves, we divided the number of species between the octaves (Preston 1948). We tested the distribution for normality using the Kolmogorov-Smirnov test (Zar 1999), which is recommended for fitting data to abundance distribution models (Hill & Hamer 1998). We compared observed frequencies to those expected theoretically by the lognormal distribution (Preston 1948), described by:
S(R) = S0 .e–(a 2R2)
(Equation I),
in which: S(R) = number of species in the Rth octave to the left and to the right of the symmetrical curve; S
0 = number of
species within modal abundance octave; 1/a = width of the distribution (a = 1/√ –2σ, in which σ is the standard deviation) (Kevan et al. 1997).
Preston (1948) also stated that the curve obtained with equation I is infinitesimal and, thus, the area comprised within the curve represents the total number of species expected for the community, which can be determined by:
a n ndR
N
∫
+∞ π∞
− =
= 0 (Equation II)
in which: N = total number of species expected for Rth octaves to the left and to the right of the symmetrical curve; n
0 = total
number of species obtained by the curve in modal octave;
π = 3,1416; 1/a = width of the distribution.
Based on equation II, we calculated the expected number of species in the community we studied, to estimate the number of species in that community.
Results
We sampled 800 individuals, belonging to 30 families, 46 genera, and 63 species (table 1). The species with highest abundance was Anadenanthera falcata
(Benth.) Speg. (185 individuals), followed by Eriotheca gracilipes (K. Schum.) A. Robyns (43 individuals),
Stryphnodendron obovatum Benth. (37 individuals),
and Miconia albicans Triana (36 individuals). Of the
63 sampled species, 12 were represented by only one individual (table 1).
We found nine octaves (figure 1), with the fourth octave (4-8 individuals) being the modal one, with 23.8% of the sampled species. We did not reject the null hypothesis that the abundance distribution of woody species was normal (p = 0.121). Therefore, the abundance distribution of these species fitted the lognormal model. From the observed distribution curve, we found 14 as the number of species in the modal octave. Applying equation II to estimate the number of species in the community, we calculated as 78 the expected number of species (σ = 4.93, a = 0.318).
Discussion
The community of woody species we studied fitted the lognormal abundance distribution model. The curve we found was an almost complete bell-shaped distribution, with a veil line close to the origin, suggesting that our sample was large enough to include most of the woody species in the community (May 1975, Pielou 1975). Other natural communities also fitted the lognormal model, for example, birds and mammals (Preston 1962), diatoms (Patrick 1968), lepidopterans (Kempton & Taylor 1974), benthos (Gray & Mirza 1979), bacteria (Hirano et al. 1982), fish (Magurran
1996), and bees (Kevan et al. 1997).
The ubiquity of the lognormal distribution may be simply a consequence of the mathematical properties of the distribution. The lognormal distribution may stem from large numbers and the Central Limit Theorem (May 1975). The Central Limit Theorem states that when a large number of factors act to determine the amount of a variable, random variation in those factors will result in a normal distribution of that variable (Magurran 1996). The lognormal curve appears when the number of species is large (May 1975).
In the cerrado, not only the number of species is large (Castro et al. 1999), but also there are many
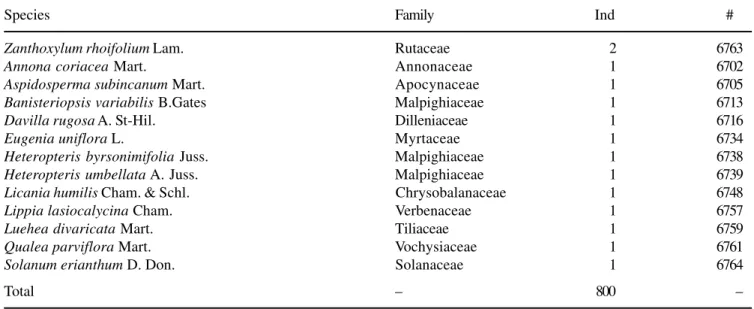
Table 1. Woody species collected in a cerrado fragment in São Carlos, southeastern Brazil, with their abundance and relative density. Ind = number of individuals, # = voucher number at the Federal University of São Carlos herbarium (Hufscar).
Species Family Ind #
Anadenanthera falcata (Benth.) Speg. Fabaceae 185 6723
Eriotheca gracilipes (K. Schum.) A. Robyns Malvaceae 43 6740
Stryphnodendron obovatum Mart. Fabaceae 37 6730
Miconia albicans (Sw.) Triana Melastomataceae 36 6741
Diospyros hispida A. DC. Ebenaceae 30 6708
Piptocarpha rotundifolia (Less.) Baker Asteraceae 30 6717
Dalbergia miscolobium Benth. Fabaceae 29 6726
Roupala montana Aubl. Proteaceae 29 6754
Bauhinia rufa Steud. Fabaceae 28 6724
Acosmium subelegans (Mohl.) Yakovlev Fabaceae 24 6722
Casearia sylvestris Sw. Flacourtiaceae 23 6731
Styrax ferrugineus Nees & Mart. Styracaceae 21 6758
Miconia ligustroides (DC.) Naudin Melastomataceae 18 6742
Tocoyena formosa (Cham. & Schltdl.) K. Schum. Rubiaceae 18 6755
Campomanesia pubescens (A. DC.) O. Berg. Myrtaceae 16 6703
Xylopia aromatica A. St-Hil. Annonaceae 16 6746
Tabebuia ochracea (Cham.) Standl. Bignoniaceae 14 6711
Kielmeyera coriacea Mart. Clusiaceae 13 6714
Machaerium acutifolium Vogel Fabaceae 13 6728
Myrcia guianensis (Aubl.) A. DC. Myrtaceae 12 6750
Erythroxylum suberosum A. St-Hil. Erythroxylaceae 11 6718
Caryocar brasiliense Cambess. Caryocaraceae 9 6712
Erythroxylum tortuosum Mart. Erythroxylaceae 9 6719
Aegiphila lhotzkiana Cham. Verbenaceae 8 6753
Guapira noxia (Netto) Lund Nyctaginaceae 8 6760
Byrsonima coccolobifolia A. Juss. Malpighiaceae 7 6707
Gochnatia pulchra Cabrera Asteraceae 7 6735
Acosmium dasycarpum (Vogel) Yakovlev Fabaceae 6 6706
Aspidosperma tomentosum Mart. Apocynaceae 6 6709
Cybistax antisyphillitica Mart. Bignoniaceae 6 6721
Byrsonima intermedia A. Juss. Malpighiaceae 5 6710
Connarus suberosus Planch. Connaraceae 5 6715
Jacaranda caroba (Vell.) A. DC. Bignoniaceae 5 6729
Myrcia bella Cambess. Myrtaceae 5 6733
Ocotea pulchella Mart. Lauraceae 5 6737
Stryphnodendron adstringens (Mart.) Coville Fabaceae 5 6749
Bowdichia virgiloides Kunth Fabaceae 4 6704
Byrsonima crassa Nied. Malpighiaceae 4 6725
Didymopanax vinosum (Cham. & Schltdl.) Seem Apiaceae 4 6736
Eugenia livida O. Berg. Myrtaceae 4 6747
Myrcia lasiantha A. DC. Myrtaceae 4 6751
Myrcia tomentosa (Aubl.) A. DC. Myrtaceae 4 6752
Dimorphandra mollis Benth. Fabaceae 3 6720
Pera glabrata (Schott) Baill. Euphorbiaceae 3 6727
Qualea grandiflora Mart. Vochysiaceae 3 6744
Rapanea ferruginea (Ruiz & Pav.) Mez Myrsinaceae 3 6762
Miconia rubiginosa (Bonpl.) A. DC. Melastomataceae 2 6732
Ocotea corymbosa (Meiss.) Mez Lauraceae 2 6743
Qualea multiflora Mart. Vochysiaceae 2 6745
Rapanea guianensis Aubl. Myrsinaceae 2 6756
continuation
Species Family Ind #
Zanthoxylum rhoifolium Lam. Rutaceae 2 6763
Annona coriacea Mart. Annonaceae 1 6702
Aspidosperma subincanum Mart. Apocynaceae 1 6705
Banisteriopsis variabilis B.Gates Malpighiaceae 1 6713
Davilla rugosa A. St-Hil. Dilleniaceae 1 6716
Eugenia uniflora L. Myrtaceae 1 6734
Heteropteris byrsonimifolia Juss. Malpighiaceae 1 6738
Heteropteris umbellata A. Juss. Malpighiaceae 1 6739
Licania humilis Cham. & Schl. Chrysobalanaceae 1 6748
Lippia lasiocalycina Cham. Verbenaceae 1 6757
Luehea divaricata Mart. Tiliaceae 1 6759
Qualea parviflora Mart. Vochysiaceae 1 6761
Solanum erianthum D. Don. Solanaceae 1 6764
Total – 800 –
A biological explanation of the lognormal distribution is suggested by the sequential niche breakage model (Sugihara 1980), in which the niche hyper-space is split sequentially by constituent species. The abundance distribution reflects the niche structure of the community (MacArthur 1957, Whittaker 1965, May 1975, Pielou 1975). The portion of niche space occupied by each species is proportional to its abundance and the probability of a niche fragment being subdivided is independent of its size (Sugihara 1980). The sequential breakage yields different species abundance distributions, dividing the species into groups (Sugihara 1980), such as dominant and rare species.
16 14 12 10 8 6 4 2 0
0 1 2 4 8 16 32 64 128 256
Abundance class
Number of species
Figure 1. Abundance distribution of woody species sampled in a cerrado fragment in São Carlos, southeastern Brazil, with expected normal curve.
Dominance is an important component of community organization, since dominant species may exert a controlling effect upon other species, especially due to their competitive ability (Krebs 1994). Dominant species can act as key-species, whose activities determine community structure (Janzen 1986), providing resources or affecting its functioning (Krebs 1994). In the community we studied, due to its high relative density,
Anadenanthera falcata is the dominant species.
Our results pointed out that the abundance distribution of the woody component in a cerrado fragment fitted the lognormal model, with some species very abundant, some very rare, and most with intermediate abundances. Other questions may be answered with future studies: Do other cerrado plant communities fit the lognormal abundance distribution model? Is this pattern maintained in other cerrado physiognomies? And in the herbaceous component? Is this distribution model maintained when the community is submitted to disturbances, as frequent burnings or alien plant invasion?
Aknowledgments – We are grateful to CNPq/Pibic, for scholarship granted to the first author, and to Otávio Lino e Silva and Celso Alfredo Barbieri Júnior, for help in the field.
References
CASTRO, A.A.J.F., MARTINS, F.R., TAMASHIRO, J.Y. & SHEPHERD, G.J. 1999. How rich is the flora of the Brazilian cerrados? Annals of the Missouri Botanical Garden 86:192-224.
CIELO FILHO, R., MARTINS, F.R. & GNERI, M.A. 2002. Fitting abundance models in tropical arboreal communities of SE Brazil. Community Ecology 3:169-180.
COUTINHO, L.M. 1990. Fire in the ecology of the Brazilian cerrado. In Fire in the tropical biota (J.G. Goldammer, ed.). Springer, Berlin, p.81-103.
DEWDNEY, A.K. 2003. The stochastic community and the logistic J-distribution. Acta Oecologica 24:221-229. ENGEN, S., LANDE, R., WALLA, T. & DEVRIES, P.J. 2002.
Analyzing spatial structure of communities using the two-dimensional Poisson lognormal species abundance model. American Naturalist 160:60-73.
FISHER, R.A., COBERT, A.S. & WILLIAMS, C.B. 1943. The relation between the number of species and the number of individuals in a random sample of an animal population. Journal of Animal Ecology 12:42-58. FONSECA, G.A.B., MITTERMEIER, R.A., CAVALCANTI,
R.B. & MITTERMEIER, C.G. 2000. Brazilian Cerrado. In Hotspots, Earth’s biologically richest and most endangered terrestrial ecoregions. (R.A. Mittermeier, N. Myers, P.R. Gil & C.G. Mittermeier, eds.). Conservation International, Chicago, p.148-159.
GRAY, J.S. 1987. Species-abundance pattern. In Organization of communities, past and present(J.H.R. Gee & P.S. Giller, eds.). Blackwell Science, Oxford, p. 53-67.
GRAY, J.S. & MIRZA, F.B. 1979. A possible method for the detection of pollution-induced disturbance on marine benthic communities. Marine Pollution Bulletin 10:142-146.
HILL, J.K. & HAMER, K.C. 1998. Using species abundance models as indicators of habitat disturbance in tropical forests. Journal of Applied Ecology 35:458-460. HIRANO, S.S., NORDHEIM, E.V., ARNY, D.C. & UPPER, C.D.
1982. Lognormal distributions of epiphytic bacterial populations on leaf surfaces. Applied and Environmental Microbiology 44:695-700.
JANZEN, D.H. 1986. Keystone plant resources in the tropical forest. In Conservation Biology: The Science of Scarcity and Diversity. (M.E. Soulé, ed.). Sinauer, Sunderland, p.330-344.
JUDD, W.S., CAMPBELL, C.S., KELLOG, E.A. & STEVENS, P.F. 1999. Plant systematics: a phylogenetic approach. Sunderland, Sinauer.
KEMPTON, R.A. & TAYLOR, L.R. 1974. Logseries and log-normal parameters as diversity discriminants for the Lepidoptera. Journal of Animal Ecology 43:381-399. KEVAN, P.G., GRECO, C.F. & BELAOUSSOFF, S. 1997.
Lognormality of biodiversity and abundance in diagnosis and measuring of ecossystemic health: pesticide stress on pollinators on blueberry heaths. Journal of Applied Ecology 34:1122-1136.
KÖPPEN, W. 1931. Grundriss der Klimakunde. W. de Gruyter, Berlin.
KREBS, C.J. 1994. Ecology: The experimental analysis of distribution and abundance. Harper Collins, NewYork.
LIMPERT, E., STAHEL, W.A. & ABBT, M. 2001. Log-normal distributions across the sciences: keys and clues. BioScience 51:341-351.
LOPES, A.S. & COX, F.R. 1977. Cerrado vegetation in Brazil: an edaphic gradient. Agronomy Journal 69:828-831. MACARTHUR, R.H. 1957. On the relative abundance of birds
species. Proceeding of the National Academy of Science 43:293-295.
MAGURRAN, A.E. 1996. Ecological diversity and its measurement. Princeton University, Princeton. MAY, R.M. 1975. Patterns of species abundance and diversity.
In Ecology and evolution of communities (M.L. Cody & J.M Diamond, eds.). Harvard University, Cambridge, p.81-120.
MOTOMURA, I. 1932. A statistical treatment of associations. Japanese Journal of Zoology 44:379-383.
MUELLER-DOMBOIS, D. & ELLENBERG, H. 1974. Aims and methods of vegetation ecology. John Wiley & Sons, New York.
PATRICK, R. 1968. The structure of diatom communities in similar ecological conditions. The American Naturalist 102:173-183.
PIELOU, E.C. 1975. Ecological diversity. John Wiley, New York.
PLOTKIN, J.B. & MULLER-LANDAU, H.C. 2002. Sampling the species composition of a landscape. Ecology 83:3344-3356.
PRESTON, F.W. 1948. The commonness and the rarity of species. Ecology 29:254-283.
PRESTON, F.W. 1962. The canonical distribution of commonness and rarity. Ecology 43:185-215.
RATTER, J.A., RIBEIRO, J.F. & BRIDGEWATER, S. 1997. The Brazilian cerrado vegetation and threats to its biodiversity. Annals of Botany 80:223-230.
RAUNKIAER, C. 1918. Recherches statistiques sur les formations végétales. Biologiske Meddeleser Kongelige Danske Videnskabernes Selskab 1:1-80.
ROLIM, S.G. & NASCIMENTO, H.E.M. 1997. Análise da riqueza, diversidade e relação espécie-abundância de uma comunidade arbórea tropical em diferentes intensidades amostrais. Scientia Forestalis 52:7-16. SARMIENTO, G. 1983. The savannas of tropical America. In
Ecosystems of the world – tropical savannas (D.W. Goodall, ed.). Elsevier, Berlin, p.245-288.
SARMIENTO, G. 1984. The ecology of neotropical savannas. Harvard University, Cambridge.
SUGIHARA, G. 1980. Minimal community structure: an explanation of species abundance patterns. The American Naturalist 116:770-787.
TOKESHI, R. 1993. Species abundance patterns and community structure. Advances in Ecological Research 24:111-195.
WHITTAKER, R.H. 1965. Dominance and diversity in land plant communities. Science 147:250-260.
WHITTAKER, R.H. 1972. Evolution and measurement of species diversity. Taxon 21:213-251.