Dedicated Pediatricians in Emergency
Department: Shorter Waiting Times and
Lower Costs
Manuel Rocha Melo1,2*, Manuel Ferreira-Magalhães1,3, Filipa Flor-Lima1,
Mariana Rodrigues1, Milton Severo2,4, Luis Almeida-Santos1, Alberto Caldas-Afonso1,2,
Pedro Pita Barros5,6, António Ferreira7
1Department of Pediatrics, Integrated Pediatric Hospital, Centro Hospitalar de S. João, Porto, Portugal,
2Institute of Public Health, University of Porto, Porto, Portugal,3Center for Health Technologies and Information Systems Research, Faculty of Medicine, University of Porto, Porto, Portugal,4Department of Clinical Epidemiology, Predictive Medicine and Public Health, Faculty of Medicine, University of Porto, Porto, Portugal,5Lisbon Nova University, Lisboa, Portugal,6Centre for Economic Policy Research, London, United Kingdom,7Centro Hospitalar de S. João, Porto, Portugal
*manuel.melo@hsjoao.min-saude.pt
Abstract
Background
Dedicated pediatricians in emergency departments (EDs) may be beneficial, though no pre-vious studies have assessed the related costs and benefits/harms. We aimed to evaluate the net benefits and costs of dedicated emergency pediatricians in a pediatric ED.
Methods
Cost-consequences analysis of visits to a pediatric ED of a tertiary hospital. Two pediatric ED Medical Teams (MT) were compared: MT-A (May–September 2012), with general pedi-atrics physicians only; and MT-B (May–September 2013), with emergency dedicated pedia-tricians. The main outcomes analyzed were relevant clinical outcomes, patient throughput time and costs.
Results
We included 8,694 children in MT-A and 9,417 in MT-B. Medication use in the ED increased from 42.3% of the children in MT-A to 49.6% in MT-B; diagnostic tests decreased from 24.2% in MT-A to 14.3% in MT-B. Hospitalization increased from 1.3% in MT-A to 3.0% in MT-B; however, there was no significant difference in diagnosis-related group relative weight of hospitalized children in MT-A and MT-B (MT-A, 0.979; MT-B, 1.075). No differences were observed in ED readmissions or in patients leaving without being seen by a physician. The patient throughput time was significantly shorter in MT-B, with faster times to first medical observation. Within the cost domains analyzed, the total expenditures per children observed in the ED were 16% lower in MT-B: 37.87 euros in MT-A; 31.97 euros in MT-B.
a11111
OPEN ACCESS
Citation:Melo MR, Ferreira-Magalhães M, Flor-Lima F, Rodrigues M, Severo M, Almeida-Santos L, et al. (2016) Dedicated Pediatricians in Emergency Department: Shorter Waiting Times and Lower Costs. PLoS ONE 11(8): e0161149. doi:10.1371/journal. pone.0161149
Editor:Harry Zhang, Old Dominion University, UNITED STATES
Received:April 5, 2016
Accepted:August 1, 2016
Published:August 26, 2016
Copyright:© 2016 Melo et al. This is an open access article distributed under the terms of the Creative Commons Attribution License, which permits unrestricted use, distribution, and reproduction in any medium, provided the original author and source are credited.
Data Availability Statement:All relevant data are within the paper and its Supporting Information files.
Funding:The authors received no specific funding for this work.
Conclusion
The presence of dedicated emergency pediatricians in a pediatric ED was associated with significantly lower waiting times in the ED, reduced costs, and similar clinical outcomes.
Introduction
There are different models of pediatric emergency care worldwide.[1–5] Differences in facili-ties, age of admission, triage, referral or physician’s qualification may influence the outcomes in pediatric emergency care.[6–8]
Over the last decade, pediatric emergency medicine has been progressively recognized, [9–
10] first in the United States, Canada, [11,12] and Australia and later in Europe, [13,14] where it is now regarded as a subspecialty by the European Academy of Pediatrics.[15] However, the practice still varies widely across different countries and regions, [4] and little is known about the benefits of having dedicated emergency pediatricians in a pediatric ED.
Specific performance measures for pediatric emergency care were identified and should be used to assess efficiency of pediatric emergency care systems.[16,17] Evidence-based guide-lines are required to standardize pediatric emergency care models and clinical practice proce-dures. In this context, analysis of the net benefits and related costs of dedicated emergency pediatricians teams are of major importance. Cost-consequences analysis is a comprehensive economic evaluation that fits the society’s health values, [18] and can be applied to the assess-ment of dedicated emergency pediatricians in ED. Objective results of not only costs, but also consequences, will inform decision-makers and improve emergency care for children.
The present study aimed to assess the net benefits and costs of dedicated emergency pedia-tricians in a pediatric ED. The specific aims were to analyse the following outcomes: clinical outcomes; patient throughput time; and costs of hospital medication, diagnostic tests, consum-able materials, and medical staff.
Patients and Methods
Study Setting
Portuguese National Health System is a Beveridge-based system, supported by taxes and, there-fore, the access is universal and free for every citizen.
Centro Hospitalar de São João (CHSJ) is a public, mixed adult-children, and university ter-tiary-level hospital located in Porto, Portugal. Pediatric ED occupies a separate place within the hospital facilities, the catchment area is approximately 700 000 children/adolescents (0–17 years-old, inclusive) and there are on average 80 000 visits per year. Patients may direct them-selves to the ED or be referred by a health professional, and the admissions to this ED are uni-versal and totally free of charge. The patients undergo triage by trained nurses in accordance with the Pediatric Canadian Triage and Acuity Scale (Paed CTAS).[19]
Medical staffing working in this ED is organized in 8 medical teams composed by physicians from three different hospitals: four teams from CHSJ, three from Centro Hospitalar do Porto, and one from Matosinhos Hospital. Each team ensures coverage of 24 hours per week, divided into two shifts of 12 hours.
Until 2013, each shift comprised a medical team with five‘general pediatrics consultants’–
dedicated to the ED’and two‘general pediatrics consultants’composed each shift—MT-B. The medical teams were the only aspect that changed between these two periods; every other aspect of pediatric ED remained the same: facilities, electronic medical systems, non-medical staff (nurses and auxiliary personnel), and triage procedures.
‘General pediatricians’were consultant physicians with board certification in pediatrics. These general pediatricians work 40 hours per week in inpatient, outpatient clinics and ED; each of these consultants work 12 hours per week in the pediatric ED.‘Pediatricians dedicated to the ED’were also consultant physicians with board certification in pediatrics; however, these consultants had an additional multidisciplinary training in pediatric emergency medicine. This training was conducted in full-time regimen (40 hours per week) over a 6-month period, and included practice in: pediatric intensive care, neonatal intensive care, pediatric interhospital transport, orthopedics, otorhinolaryngology, general surgery, and anesthetics. After this train-ing period, pediatricians dedicated to ED started to work 40 hours per week exclusively in pedi-atric ED and interhospital transport of critically ill children.
Study Design and Participants
We performed a cost-consequences analysis of the implementation of MT-B in our pediatric ED, using patients’electronic medical records and hospital administrative databases. To exam-ine the performance of MT-A and MT-B, we selected comparable annual periods in consecu-tive years: May 1 to September 30, 2012 for MT-A; and May 1 to September 30, 2013 for MT-B.
We included all patients (0–17 years-old, inclusive) that visited the pediatric ED of CHSJ. The exclusion criteria were: patients evaluated by pediatric medical teams from Centro Hospi-talar do Porto and Matosinhos Hospital; and patients referred directly to other specialties in triage. Patients who left the pediatric ED without being seen by a physician (dropouts) were excluded from the overall analysis, but the frequency was compared between the two periods.
Confidentiality of participants was assured by patient records anonymization and de-identi-fication prior to analysis. This study was reviewed and approved by the Ethics Committee of CHSJ, Porto, Portugal.
Outcome Measures
The main comparisons were relevant clinical outcomes, patient throughput times, and costs. We also analysed demographic characteristics. Discharge diagnoses were classified in accor-dance with the International Classification of Diseases, Ninth Revision (ICD-9).[21]
The relevant clinical outcomes considered were: need for medication within the ED; need for diagnostic tests within the ED; number of hospitalisations; readmission to ED in the 72-hour period after discharge; death in the ED; and patients leaving without being seen by a physician. In order to address potential differences in hospitalisations, we assessed the com-plexity of the hospitalised patients with the diagnosis-related group relative weight.[22]
Patient throughput time was defined as the time from patient arrival to time of discharge from pediatric ED. This time was further divided into the following durations between: arrival and triage; triage and first medical observation; and first medical observation and discharge.
Cost analysis included four different cost domains: hospital medication given inside the ED; diagnostic tests; clinical consumables; and medical staff (regular salary and overtime remuneration).
medical staff management. So we did not account for the costs with nursing, security profession-als, facilities, administrative consumables or other general costs.
Statistical Analysis
Categorical variables (clinical outcomes) were characterized by counts and proportions. Numeri-cal variables (throughput times) that presented a right-skewed distribution were log transformed and described with geometric mean (meang) and standard deviation (SDg). To compare numeri-cal variables after log transformation, we used two-independent samplettest; for categorical var-iables, we employed a chi-square test. We categorized the effect size of the comparisons between the two ED models according to Cohen.[23] Considering that we are working with large sam-ples, measures of effect size were preferred over significance tests to remove the dependence on sample size and the associated high probability of significant differences. For continuous vari-ables (or the respective log transformation) the effect size was calculated as the difference between two means (MT-A and MT-B) divided by the pooled standard deviation. For
categori-cal variables we used the formula
ffiffiffiffiffiffiffiffiffiffiffiffiffiffiffiffiffiffiffiffiffiffiffiffiffiffiffiffiffiffiffiffiffiffi P
iðp1i p0iÞ 2
=p0i
q
, wherep0iis the proportion of theithcell underH0andp1iis the proportion of theithcell underH1(observed proportion). For compari-sons of the categorical variables (clinical outcomes), the effect size of 0.1–0.3 was considered small, 0.3–0.5 medium, and>0.5 large. For comparisons of numerical variables (throughput times), the effect size of 0.2–0.5 was considered small, 0.5–0.8 medium, and>0.8 large.
To measure the association between clinical outcomes and the main exposure, we used the odds ratio (OR) and respective 95% confidence interval (95%CI). We estimated the OR by means of an unconditional logistic regression.
We performed the cost analysis using the total cost in each time period (sum of the four cost domains for MT-A and for MT-B) divided by the number of patients observed in each one. The results for the costs are presented in euros per patient observed in the pediatric ED. We also performed a multiple quantile regression for the costs of diagnostic tests since that was the only cost domain where all the costs were specifically allocated to each patient observed in the ED.[24] We compare the diagnostic tests costs in MT-B with MT-A adjusting for age, month of admission, and level of triage. In particular, a quantile regression model follows the changes in coefficients and can indicate heterogeneity in the direction and magnitude of the associations between predictor variable (MT-B vs. MT-A) and the linear dependent variable (costs of diagnostic tests) from the mean estimates.
We conducted the statistical analysis using SPSS version 22 (SPSS IBM, New York, NY, USA). Quantile regression was estimated using the library quantreg from the software R 2.14.1. [25] The level of significance was fixed at 0.05.
Results
From a total of 56 298 visits to pediatric ED, we included 8 694 (15.4%) in MT-A and 9 417 (16.7%) in MT-B. The study flowchart is presented inFig 1and demographic data summarized
inTable 1. In the final sample, children aged 1 to 5 years old were the most frequent patients
visiting the pediatric ED (MT-A—n = 4 282, 49.3%; MT-B—n = 4 666, 49.5%).
Paed CTAS level 3 patients were the most common (MT-A—n = 4 117, 47.4%; MT-B—
n = 4 338, 46.1%). MT-B had more level 1 and level 2 Paed CTAS episodes than MT-A (MT-A
—n = 426, 4.9%; MT-B—n = 528, 5.6%;p= 0.049), as well as more resuscitation room (MT-A
—n = 55, 0.6%; MT-B—n = 106, 1.1%;p<0.001) and observation ward admissions (MT-A—
Clinical Outcomes
The number of children that received medication increased from 42.3% in MT-A to 49.6% in MT-B. Children who underwent diagnostic tests decreased from 24.2% in MT-A to 14.3% in
Fig 1. Study flowchart.Patients included in each medical team (MT-A and MT-B) are shown; exclusion criteria appear in the central boxes.
MT-B (Table 2). The number of children hospitalized increased from 1.3% in MT-A to 3.0% in MT-B. However, all the effect sizes of these comparisons were extremely low (Table 2). There was no significant difference on the diagnosis-related group relative weight of hospitalized chil-dren (MT-A, 0.979; MT-B, 1.075; p = 0.45).
Table 1. Sample characteristics.
Total MT-A MT-B p value
(n = 18 111) (n = 8 694) (n = 9 417) Gender, n (%)
Male 9 402 (51.9) 4 494 (51.7) 4 908 (52.1) 0.565
Female 8 709 (48.1) 4 200 (48.3) 4 509 (47.9)
Age, n (%)
<12 months 2 306 (12.7) 1 004 (11.5) 1 302 (13.8)
12–24 months 2 836 (15.7) 1 367 (15.7) 1 469 (15.6)
1–5 years 6 112 (33.7) 2 915 (33.5) 3 197 (33.9) <0.001
6–10 years 3 306 (18.3) 1 654 (19.0) 1 652 (17.5)
11–15 years 2 316 (12.8) 1 147 (13.2) 1 169 (12.4)
16 years 1 235 (6.8) 607 (7.0) 628 (6.7)
Month of visit, n (%)
May 3 906 (21.6) 2 099 (24.1) 1 807 (19.2)
June 3 829 (21.1) 1 537 (17.7) 2 292 (24.3)
July 3 560 (19.7) 1 913 (22.0) 1 647 (17.5) <0.001
August 3 086 (17.0) 1 485 (17.1) 1 601 (17.0)
September 3 730 (20.6) 1 660 (19.1) 2 070 (22.0)
Origin, n (%)
Primary care 818 (4.5) 412 (4,7) 406 (4.3)
Other hospital 153 (0.9) 82 (0.9) 71 (0.8)
Private clinic 105 (0.6) 53 (0.6) 52 (0.6) 0.115
Health-care call center 402 (2.2) 172 (2.0) 230 (2.4)
Outpatient department 22 (0.1) 9 (0.1) 13 (0.1)
Without referral 16 611 (91.7) 7 966 (91.7) 8 645 (91.8)
Canadian triage level, n (%)
Level 1 and 2 954 (5.3) 426 (4.9) 528 (5.6)
Level 3 8 455 (46.7) 4 117 (47.4) 4 338 (46.1)
Level 4 8 027 (44.3) 3 845 (44.2) 4 182 (44.4) 0.049
Level 5 675 (3.7) 306 (3.5) 369 (3.9)
Triage destination, n (%)
Pediatric resuscitation room 161 (0.9) 55 (0.6) 106 (1.1)
Observation ward 629 (3.5) 211 (2.4) 418 (4.4) <0.001
Waiting room 17 321 (95.6) 8 428 (97.0) 8 893 (94.5)
Disorders according to ICD-9*, n (%)
Infectious 2 869 (16.0) 1 456 (16.9) 1 413 (15.1)
CNS and Sense organs 1 480 (8.2) 692 (8.0) 788 (8.4)
Respiratory system 3 477 (19.3) 1 460 (16.9) 2 017 (21.6)
Digestive system 1 226 (6.8) 613 (7.1) 613 (6.6) 0.213
Signs and symptoms 4 180 (23.2) 2 034 (23.6) 2 146 (22.9)
Injury and poisoning 2 062 (11.5) 975 (11.3) 1 087 (11.6)
Others 2 696 (15.0) 1 402 (16.2) 1 294 (13.8)
ICD-9: International Classification of Diseases, Ninth Revision; CNS: Central Nervous System.
There was no statistically significant difference regarding readmissions to pediatric ED in the 72-hour period after discharge. In the periods under study, there was only one death within the ED (MT-A). There were 73 (0.8%) patients who left without being seen by a physician in MT-A and 85 (0.9%) in MT-B (p= 0.652).
Patient throughput time
Patient throughput time in the pediatric ED was significantly shorter in MT-B, as well as all the subdivisions of this time (Table 3). The effect sizes of those differences were classified as small except for duration between patient arrival and first medical observation, which had a medium effect size.
The meangduration between arrival and triage was less than 10 minutes in both MT-A and MT-B. The meangduration between triage and first medical observation was 23.4 minutes in MT-A and 12 minutes in MT-B (p<0.001; effect size 0.513) and was inversely proportional to the priority levels of triage (S1 Fig).
Cost Analysis
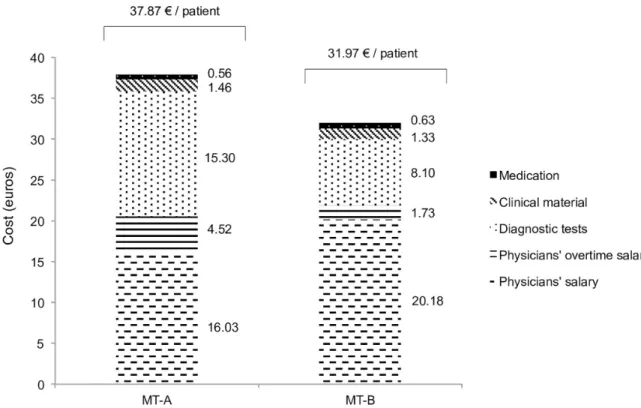
Within the cost domains analysed, the total expenditure per patient observed in the pediatric ED was 16% lower in MT-B (37.87 euros in MT-A and 31.97 euros in MT-B;Fig 2). The relative costs of diagnostic tests, clinical consumables, and physicians’overtime pay were lower in MT-B (relative decrease of 47%, 9%, and 62%, respectively). The relative costs of medication and phy-sicians’regular salary were higher in MT-B (relative increase of 26% and 13%, respectively).
Table 2. Clinical outcomes: proportions, effect size, and odds ratio (crude and adjusted) for comparisons between the two medical teams (MT-A and MT-B).
Total, n (%) MT-A, n (%) MT-B, n (%) Effect size Crude OR (95%CI) Adjusted OR (95%CI)
Medication use 8 348 3 677 4 671 0.103 1.34 1.40
(46.1) (42.3) (49.6) (1.27–1.42) (1.31–1.49)
Diagnostic test use 3 453 2 106 1 347 0.178 0.52 0.52
(19.1) (24.2) (14.3) (0.48–0.56) (0.49–0.57)
Hospitalization 397 115 282 0.082 2.30 2.26
(2.2) (1.3) (3.0) (1.85–2.87) (1.81–2.83)
Readmission 1 264 575 689 0.020 1.12 1.11
(7.0) (6.6) (7.3) (0.99–1.25) (0.99–1.25)
Bold values:p<0.001 for comparisons between the MT-A and MT-B OR, odds ratio; CI, confidence interval
Adjusted OR: adjusted to age, month of visit, and level of triage.
doi:10.1371/journal.pone.0161149.t002
Table 3. Patient throughput time (hours) in pediatric emergency department—comparison between the two medical teams (MT-A and MT-B).
Total, meang(SDg) MT-A, meang(SDg) MT-B, meang(SDg) Effect size
Patient throughput time in ED (hours) 1.84 (2.47) 2.08 (2.43) 1.65 (2.47) 0.248
Duration between arrival and triage (hours) 0.12 (1.98) 0.13 (2.06) 0.11 (1.88) 0.220 Duration between triage andfirst medical observation (hours) 0.28 (3.79) 0.39 (3.32) 0.20 (3.91) 0.513 Duration betweenfirst medical observation and discharge (hours) 0.48 (2.41) 0.58 (2.41) 0.40 (2.33) 0.414 Bold values:p<0.001 for comparisons between MT-A and MT-B.
SDg, geometric standard deviation.
In the multivariate quantile regression, we observed that the highest savings in diagnostic tests observed in MT-B were mainly driven by a lower use of the cheaper (38% lower) and the costliest (15% higher) diagnostic tests. The costs for medium expenditure with diagnostic tests were similar in the two models (S2 Fig).
Discussion
This is the first study that evaluates net benefits (clinical outcomes and patient throughput time) and costs of dedicated emergency medicine pediatricians in the pediatric ED. The cost-consequences approach allowed us to perform a comprehensive analysis, aiming to impact the future decision-making in pediatric emergency care. We were able to describe and com-pare the two models using most of the recommended performance indicators for pediatric ED with the highest utility score, as ranked by the Royal College of Physicians and Surgeons of Canada.[16]
In our study, the differences between general pediatricians and pediatricians dedicated to ED were mainly two: 1) the training program, i.e. a 6-month extra training period in pediatric emer-gency medicine for pediatricians dedicated to ED; 2) clinical activity, i.e. pediatricians dedicated to ED have a full-time work (40 hours per week) in pediatric ED and interhospital transport of critically ill children, as opposed to general pediatricians that work 40 hours per week in several areas of pediatric department (inpatient, outpatient clinics and ED) and, of these, only 12 hours per week in ED. We propose that the differences in training and clinical practice may give a greater know-how in treating children in ED, leading to better outcomes in the emergency set-ting: higher confidence in managing medication in the ED and less diagnostic tests use may decrease waiting times in the ED and, altogether, decrease the costs in pediatric ED.
Fig 2. Specific costs per patient observed in the pediatric emergency department in medical teams (MT-A and MT-B).
Clinical Outcomes
There is a lack of published studies about diagnostic tests and medication prescription within the pediatric ED. In our study, we observed a decrease in diagnostic testing in MT-B and an increase in medication use, even when adjusted for patient age, level of triage, and month of ED visit. According to the specificity of the training program and clinical activities, pediatri-cians dedicated to ED were probably more prone to have an integrated approach to the chil-dren admitted to ED. This may explain why pediatric emergency physicians have had more restrictive criteria for employing diagnostic testing in an emergency setting and, in turn, may have had greater confidence in managing medication. Further studies are needed to address this hypothesis. Nevertheless, those differences were considered clinically irrelevant (see the low effect size inTable 2) and may also be related to our large sample size and the power to detect small differences. This point also applies to the increase in hospitalisations observed in MT-B (see the low effect size inTable 2). Moreover, we did not observed any difference in diag-nosis-related group relative weight between the two periods, indicating that physician’s clinical criteria on 14ospitalization remained the same in MT-A and MT-B. The overall rate of 14ospi-talization observed is similar to that found in other pediatric ED settings.[26]
The rates of readmission to the ED after 72 hours and of patients left without being seen were extremely low in both periods and no differences were found. Previous studies have reported higher proportions (7%-16%) of patients leaving without being seen.[27,28]
Patient throughput time
The total patient throughput time inside the pediatric ED, as well as all the subdivided times, were significantly shorter in MT-B, with acceptable effect sizes (small to medium effect sizes;
Table 3). We believe that this reduction in duration may be partly a consequence of the fewer
diagnostic tests performed and lack of need to wait for test results.
These findings support the effectiveness of dedicated emergency pediatricians in reducing waiting times / length of stay in the pediatric ED. Keijzers et al. reported a reduction of the total ED length of stay (in an adult-child mixed ED) with a pediatric medical team, but they were unable to find an effect on the waiting time to see a doctor.[29] In our setting, both mod-els were composed of pediatricians only (or pediatric residents); the difference was in‘general pediatricians’vs‘dedicated emergency pediatricians’.
We did not make satisfaction inquiries, however, previous reports have demonstrated the importance of shorter waiting times on carer satisfaction levels and in the likelihood of recom-mending the pediatric ED.[29]
Costs
MT-B showed a 16% reduction in the total costs analysed (medications, diagnostic tests, clini-cal consumables, and physicians’salaries). The highest saving was in physicians’overtime pay (62% reduction). That saving was accompanied by a slight increase in the physicians’regular salaries. That change was anticipated since the emergency pediatricians had been hired, and consequently general pediatrics physicians worked less overtime.
Strengths
Portuguese National Health System access is universal and free for every citizen so, our study population is representative of all the children, without having the possible confounding effect of social factors like health insurance or socioeconomic status. MT-A and MT-B differed only in the composition of the pediatric medical teams; all the other features were identical. This allowed us to assess the effect of having dedicated emergency pediatricians in a pediatric ED. In addition, we focus our analysis on the children attended by pediatricians and excluded patients referred to other specialties (Fig 1). We also chose the same time of year in 2012 and 2013 to minimize possible bias related to the incidence of acute pathologies linked to different seasons. Finally, the study sample size allowed us to greatly reduce the probability of type II errors.
Limitations
This study had some limitations. There were small differences in some baseline characteristics between the two models (Table 1); however, we adjusted our estimates to those variables, and the differences in the baseline characteristics were probably detected because of the large sam-ple. The comparison between two different periods may had also not account for the small changes in practices that could have been occurred; nevertheless, we did not identify any major change in practices in pediatric ED. Finally, our results are fitted to the population of the stud-ied hospital, and extrapolation to other settings has to be made with caution.
Conclusion
The presence of dedicated emergency pediatricians in a pediatric ED was associated to signifi-cantly lower waiting times in the ED, less diagnostic tests use and reduced costs. Clinical out-comes were similar in the two models studied. More studies on utility, benefits and costs of specialized pediatric emergency teams in pediatric ED are needed in order to help decision makers to improve pediatric emergency care models, maximizing health results in this setting.
Supporting Information
S1 Fig. Comparison of estimated marginal means of duration between triage and first med-ical observation in MT-A and MT-B.Blue line: MT-A. Green line: MT-B.
(TIFF)
S2 Fig. Multivariate quantile regression for costs with diagnostic tests in MT-B compared with MT-A, adjusted for age, month of admission, and level of triage.Slash-dotted line: mean difference of MT-B compared with MT-A. Gray zone: 95% confidence interval for the mean difference. Red solid line shows the mean difference of MT-B compared with MT-A using the usual least squares linear regression.
(TIFF)
Author Contributions
Conceived and designed the experiments:MRM MFM ACA AF.
Performed the experiments:MRM MFM FFL MR.
Analyzed the data:MRM MFM MS.
Contributed reagents/materials/analysis tools:MS LAS PPB.
References
1. Van Veen M, Moll HA. Reliability and validity of triage systems in paediatric emergency care.Scand J Trauma Resusc Emerg Med. 2009; 17:38. doi:10.1186/1757-7241-17-38PMID:19712467
2. Fernández A, Pijoan JI, Ares MI, Mintegi S, Benito FJ. Canadian Paediatric Triage and Acuity Scale: assessment in a European paediatric emergency department.Emergencias. 2010; 22:355–360. 3. American Academy of Pediatrics, Committee on Pediatric Emergency Medicine; American College of
Emergency Physicians, Pediatric Committee; Emergency Nurses Association Pediatric Committee. Joint policy statement—guidelines for care of children in the emergency department.Pediatrics. 2009; 124(4):1233–1243. doi:10.1542/peds.2009-1807PMID:19770172
4. Mintegi S, Shavit I, Benito J, REPEM group (Research in European Paediatric Emergency Medicine). Paediatric emergency care in europe: a descriptive survey of 53 tertiary medical centers.Pediatr Emerg Care. 2008; 24(6):359–363. doi:10.1097/PEC.0b013e318177a762PMID:18562877 5. Models of Emergency Care. Sydney. NSW Ministry of Health; 2012.http://www.health.nsw.gov.au/
Performance/Publications/ed-model-of-care-2012.pdfAccessed January 29, 2016.
6. Sacchetti A, Baren J, Carraccio C. The paradox of the nested pediatric emergency department.Acad Emerg Med. 2005; 12(12):1236–1239. PMID:16293893
7. Davies F, Gaushe-Hill M, Chu S, Cheema B, Ang A, Caceres L, et al. 2012 International Standards of Care for Children in Emergency Departments. Melbourne. International Federation for Emergency Medicine—Paediatric Special Interest Group; 2012.http://www.ifem.cc/Resources/
PoliciesandGuidelines.aspxAccessed September 24, 2015.
8. Dharmar M, Marcin JP, Romano PS, Andrada ER, Overly F, Valente JH, et al. Quality of Care of Chil-dren in the Emergency Department: Association with Hospital Setting and Physician Training.J Pediatr. 2008; 153(6):783–789. doi:10.1016/j.jpeds.2008.05.025PMID:18617191
9. Li M, Baker MD, Ropp LJ. Pediatric emergency medicine: a developing subspecialty.Pediatrics. 1989; 84(2):336–42. PMID:2748264
10. Pou Fernández J, Benito Fernández J. Pediatría de urgencias: una nueva especialidad.An Esp Pediatr. 2002; 56(1):2–4.
11. Curriculum Subcommittee, Section of Emergency Medicine, American Academy of Pediatrics. Pediat-ric emergency medicine (PEM) fellowship curPediat-riculum statement.Pediatr Emerg Care. 1993; 9(1):60–
66. PMID:8488151
12. Babl FE, Weiner DL, Bhanji F, Davies F, Berry K, Barnett P. Advanced training in pediatric emergency medicine in the United States, Canada, United Kingdom, and Australia: An international comparison and resources guide.Ann Emerg Med. 2005; 45(3):269–275. PMID:15726049
13. Benito J, Mintegi S, Ruddy RM, Gonzalez del Rey JA. Changing Clinical Practices and Education in Pediatric Emergency Medicine Through Global Health Partnerships.Clin Pediatr Emerg Med. 2012; 13 (1):37–43.
14. Salter R, Maconochie IK. Implementation of recommendations for the care of children in UK emergency departments: national postal questionnaire survey.BMJ. 2005; 330(7482):73–74. PMID:15579478 15. Benito J, Mintegi S, Luaces C, Liviana D, Chérón G, Martinot A, et al (Working Group on Paediatric
Emergency Medicine). The European Syllabus for Paediatric Emergency Medicine. European Acad-emy of Paediatrics; Paediatric Section of the UEMS; UEMS Section of the European Board of Emer-gency Medicine; 2011.http://www.simeup.com/doc/syllabus.pdfAccessed January 29, 2016. 16. Hung GR, Chalut D. A consensus-established set of important indicators of pediatric emergency
department performance.Pediatr Emerg Care. 2008; 24(1):9–15. doi:10.1097/pec.0b013e31815f39a5 PMID:18165798
17. Alessandrini E, Varadarajan K, Alpern ER, Gorelick MH, Shaw K, Ruddy RM, et al. Emergency depart-ment quality: An analysis of existing pediatric measures.Acad Emerg Med. 2011; 18(5):519–526. doi: 10.1111/j.1553-2712.2011.01057.xPMID:21569170
18. Coast J. Is economic evaluation in touch with society's health values?BMJ. 2004; 329(7476):1233–6. PMID:15550430
19. Gouin S, Gravel J, Amre DK, Bergeron S. Evaluation of the Paediatric Canadian Triage and Acuity Scale in a paediatric ED.Am J Emerg Med. 2005; 23(3):243–247. PMID:15915392
20. Paiva JA, Silva AM, Almeida AL, Seco CM, Gomes CM, Ribeiro E, et al. Reavaliação da Rede Nacional de Emergência e Urgência; 2012. http://www.portaldasaude.pt/NR/rdonlyres/0323CC90-45A4-40E4-AA7A-7ACBC8BF6C75/0/ReavaliacaoRedeNacionalEmergenciaUrgancia.pdfAccessed January 29, 2016.
22. Fetter RB, Shin Y, Freeman JL, Averill RF, Thompson JD. Case mix definition by diagnosis related groups.Med Care. 1980; 18(2):1–53.
23. Cohen J. A power primer.Psychol Bull. 1992; 112(1):155–159. PMID:19565683 24. Koenker RW, Bassett QW. Regression quantiles.Econometrica. 1978; 46:33–50
25. R Core Team (2013). R: A language and environment for statistical computing. R Foundation for Statis-tical Computing, Vienna, Austria.http://www.R-project.org/. Accessed January 29, 2016.
26. Hampers LC, Faries SG, Poole SR. Regional after-hours urgent care provided by a tertiary children’s hospital.Pediatrics. 2002; 110(6):1117–1124. PMID:12456908
27. Ng Y, Lewena S. Leaving the paediatric emergency department without being seen: understanding the patient and the risks.J Paediatr Child Health. 2012; 48(1):10–15. doi:10.1111/j.1440-1754.2011. 02187.xPMID:21988657
28. Gaucher N, Bailey B, Gravel J. Who Are the Children Leaving the Emergency Department Without Being Seen by a Physician?Acad Emerg Med. 2011; 18(2):152–157. doi:10.1111/j.1553-2712.2010. 00989.xPMID:21314774