UNIVERSIDADE FEDERAL DO CEARÁ CENTRO DE TECNOLOGIA
CURSO DE ENGENHARIA DE PETRÓLEO
FRANCISCO BRUNO XAVIER TELES
A SIMPLIFIED DESIGN OF A HYDRAULIC FRACTURING JOB IN A TIGHT GAS RESERVOIR
FRANCISCO BRUNO XAVIER TELES
A SIMPLIFIED DESIGN OF A HYDRAULIC FRACTURING JOB IN A TIGHT GAS RESERVOIR
Monography presented to the Petroleum Engineering course of the Universidade Federal do Ceará in 2017, as a partial request for obtaining the title of Bachelor of Petroleum Engineering.
Supervisor: Prof. Msc. Pedro Felipe Gadelha Silvino
Dados Internacionais de Catalogação na Publicação Universidade Federal do Ceará
Biblioteca Universitária
Gerada automaticamente pelo módulo Catalog, mediante os dados fornecidos pelo(a) autor(a)
T272s Teles, Francisco Bruno Xavier.
A simplified design of a hydraulic fracturing job in a tight gas reservoir / Francisco Bruno Xavier Teles. – 2017.
41 f. : il. color.
Trabalho de Conclusão de Curso (graduação) – Universidade Federal do Ceará, Centro de Tecnologia, Curso de Engenharia de Petróleo, Fortaleza, 2017.
Orientação: Prof. Me. Pedro Felipe Gadelha Silvino.
1. Well stimulation. 2. Hydraulic fracturing. 3. Unconventional reservoirs. 4. Fracture. 5. Tight gas. I. Título.
To God.
ACKNOWLEDGEMENTS
I would like to thank my entire family for always believing in my potential and wishing all the best for my future. Special thanks to my mother Solange Xavier Aragão, my father Antônio Aragão Teles, my sister Rafaela Xavier, and my grandmother Alice Justino Aragão for all the support, love and for always hoping on my achievements. All my effort is for you.
Thanks to my girlfriend Ligia for companionship and learning experiences during the academic years in Brazil and in the USA. I am very thankful for having you and sharing the same dreams. Thanks Nivaldo and Leni for the talks and advices you both gave about studies and life.
I am honored to have made many friends at UFC and I would like to thank them. Lara Timbó, Milena Ricarte, Matheus Prata, Bruna Pinto, Renan Ozório, Gabriel Lima, George Meneses, João Pedro Sales, Leonardo Sales, Manoel Maia, Clarissa Dantas, and Konstantinos Polemis, thanks for the partnership, talks, studies together, rides, drink and joke times. You all somehow contributed to my formation.
I would like to thank all the friends and colleagues from the Society of Petroleum Engineers (SPE) Student Chapter at UFC. It was great to work with you.
Thanks CAPES for providing me a scholarship in the program Science without Boarders. I am glad to have had the opportunity to study in the USA at Missouri University of Science and Technology.
I would like to thank the PERTT Lab team at LSU, specially Paulo, Renato, and Érika for providing me the internship opportunity, for the mentoring, talks, advices and support.
Thanks to all friends and supervisors I had when part of GPSA at NPL and LPA. Thanks Funcap and Petrobras for the scholarships.
Thanks to friends Dilayne Santos, Eduardo Wietholder, and Henrique Borges, for the partnership, studies moments, and talks in Missouri.
Special thanks to Erbene Carvalho and Eubio Lima. You both were like a family to me in my academic years.
Thanks to my professor and supervisor Msc. Pedro Felipe Gadelha Silvino for all the support, mentoring, and talks about the petroleum engineering course.
Thanks NSI Technologies for providing the STIMPLAN software license and the project data during the Well Stimulation course at Missouri University of Science and Technology.
“The best preparation for tomorrow is doing your best today.”
ABSTRACT
Hydraulic fracturing is a well stimulation technique very efficient for low to moderate permeability reservoirs. In the last decades, this method has been intensively used for exploring unconventional reservoirs in many regions of the world. This technique consists on pumping fluid with additives in a high pressure into the formation, this pressure must be high enough to break the rock and propagate. Once the fracture is created, fluid with the stabilizer agent, also called proppant, which has the function of keeping the fracture opened and conductive is pumped in a slurry stage. This process provides a permeable channel in the formation, making the flow of the formation fluids easier, and leading to a more productive interest zone. In this work, using STIMPLAN, a hydraulic fracturing design was developed for a gas reservoir, in which its properties, type of materials, and operational parameters were considered. Based on some reservoir physical properties, obtained from logs and pressure data information, a proppant and fluid injection agenda were proposed for two volumetric limitations aiming to obtain an optimum fracture design. As result, an optimum design with the desired fracture propped length and non-dimensional conductivity was obtained.
LIST OF FIGURES
Figure 1 Fracking illustration ... 14
Figure 2 Hydraulic fracturing job equipment overview ... 15
Figure 3 Triangle resource ...17
Figure 4 Ceramic proppant illustration ... 22
Figure 5 PKN fracture geometry ... 25
Figure 6 Gamma ray measurements by depth in meters ... 29
Figure 7 Two-dimensional representation of the fracture obtained in the simulation for design 1 (15,000 BBL) ... 33
LIST OF GRAPHS
Graph 1 Nolte-Smith diagram ... 24
Graph 2 Hornet plot ... 30
Graph 3 Bottom-hole pressure versus injection time ... 31
Graph 4 Nolte-Smith diagram for design 1 ... 32
LIST OF TABLES
Table 1 Definition of unconventional resources ... 16
Table 2 Assessment of recoverable resources of global unconventional oil... 18
Table 3 Assessment of recoverable resources of global unconventional natural gas . 19 Table 4 Fluid treatment additives ... 20
Table 5 Density and closing pressure by type of proppant ... 22
Table 6 Results for design 1 ... 32
ABBREVIATIONS
FOI Folds of Increase
API American Petroleum Institute
KCl Potassium Chloride
SYMBOL DESCRIPTION
% Percentage
FCD Non dimensional fracture conductivity
°C Degree celsius
mD Milidarcy
in Inches
m Meters
m3 Cubic meters
t Tons
min Minutes
psi Pounds per square inch
lb Pounds
gal Gallons
s Skin factor
Drainage radius Well radius
Breakdown pressure
P Reservoir pressure
Maximum horizontal tension Minimum horizontal tension Rock tension Net pressure Surface pressure Hydraulic pressure Friction pressure Perforation pressure In-situ stress
k Formation permeability
Fracture permeability
w Fracture width
Fracture half length
SUMMARY
1 INTRODUCTION ... 14
2 LITERATURE REVIEW ... 16
2.1 Conventional and unconventional reservoirs ... 16
2.2 Unconventional resources in the world ... 18
2.3 Hydraulic fracturing ... 19
2.3.1 Fracture materials (Proppant and Fluid) ... 19
2.3.2 Fracture mechanics and propagation ... 23
2.3.3 Propagation and geometry ... 24
2.3.4 Fracture design ... 25
2.4 Formation evaluation and logs ... 26
2.5 Reservoir considerations ... 27
2.6 Objectives ... 27
2.6.1 General objectives ... 27
2.6.2 Specific objectives ... 28
3 METHODOLOGY ... 29
4 RESULTS AND DISCUSSION ... 31
4.1 Design 1 ... 31
4.2 Design 2 ... 33
5 CONCLUSION ... 36
14
1 INTRODUCTION
According to the International Energy Agency (IEA), fossils fuels are responsible for supplying most of the world’s energy demand when compared to other energy resources. However, nowadays conventional resources of oil are not enough to supply the future demand of energy if energy consumption continues at the same level. This leads to the search for ways of increasing hydrocarbon production from unconventional reservoirs.
The unconventional reservoirs are oil and gas deposits that cannot be produced due to their low porosity and permeability, or when the produced volume without a stimulation is not economically viable. In the past years, horizontal drilling together with hydraulic fracturing allowed to get very high volume of shale gas and oil, which were not produced in a profitable way (GOMAA et al., 2014).
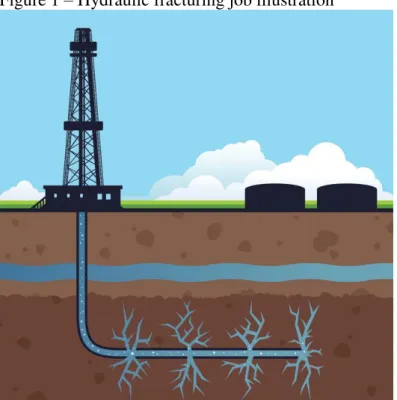
Fracking job consists on high-pressure injection of fluids, generally water with additives, in oil or/and gas reservoirs. This pressure must be high enough to create fractures on the rock. When the breakdown pressure is reached the rock opens and fluid is still being injected so the fracture can propagate. To keep the fracture opened and conductive, and thus permeable, after the treatment, proppant agent is injected with the fluid (DANESHY, 2010). Figure 1 shows a good illustration of how this process occurs.
Figure 1 – Hydraulic fracturing job illustration
15
A well-executed fracking design can reach a vast stimulated area and get a permeability six times greater than the original one (ECONOMIDES, 1994). Because of that, hydraulic fracturing is one of the most complete methods for stimulating an oil or natural gas reservoir. Figure 1 shows a scheme with equipment and materials in a fracking treatment.
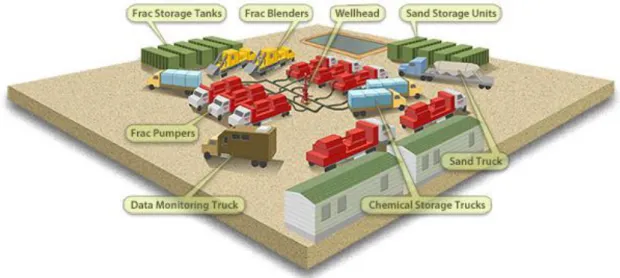
Figure 1 – Hydraulic fracturing job equipment overview
Source: Frac Focus Chemical Disclosure Registry accessed on 2th July, 2017.
We can see on the figure below, the storage tanks and units where the fracking fluids, chemicals, and proppants are stored. Some of the trucks pump the fluids and materials into the wells. In addition, there is a data monitoring truck, where all the frac job is monitored and operated by the engineers and technicians.
16
2 LITERATURE REVIEW
2.1 Conventional and unconventional reservoirs
The difference between conventional and unconventional resources is related to the type of formation that makes up the reservoir and how easy or hard it is to explore. Both conventional and unconventional reserves refer to an amount of hydrocarbons that is economically feasible to be extracted. Therefore, some reservoir properties as permeability and porosity are what mainly differs these type of reservoirs.
Conventional resources encloses high permeability reservoirs that can be produced by standard methods, being these resources easy and less expensive to produce. According to Castro (2015), reservoirs with permeability higher than 1mD are categorized as conventional reservoirs. On the other hand, unconventional resources are those with permeability lower than 1mD, including low-permeability (<0.1 mD) sandstones and self-sourcing reservoirs (ZOU et al., 2015). Unconventional reservoirs have properties that made them extremely
difficult to produce oil or gas. Therefore, these unconventional reservoirs need high technology and the use of stimulation techniques to be recovered in a viable way.
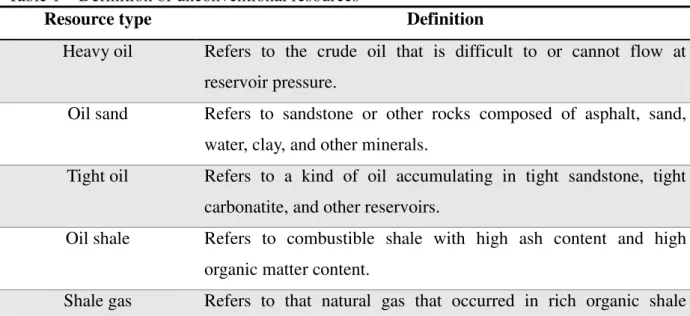
In order to simplify the understanding of different types of unconventional oil and gas resources, Wang (2016) established some definitions and classification criteria for all types of unconventional resources. Table 1 shows a short version of the definition proposed in his study.
Table 1 – Definition of unconventional resources
Resource type Definition
Heavy oil Refers to the crude oil that is difficult to or cannot flow at reservoir pressure.
Oil sand Refers to sandstone or other rocks composed of asphalt, sand, water, clay, and other minerals.
Tight oil Refers to a kind of oil accumulating in tight sandstone, tight carbonatite, and other reservoirs.
Oil shale Refers to combustible shale with high ash content and high organic matter content.
17
reservoir in free and adsorbed states.
Tight gas Refers to natural gas accumulated in tight sandstone and other reservoirs. The tight gas resources have a methane content of more than 85%.
Coalbed methane Refers to hydrocarbon gas occurring in coal seam. Source: Adapted from Wang (2016).
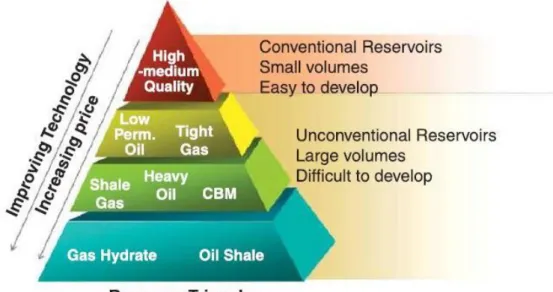
To better understand the particularities of conventional and unconventional resources, Old et al. (2008) and Dong et al. (2012) suggested that these reservoir types can be
assigned to various resources classes in a triangle, and their positions in the triangle reflect the reservoir quality, abundance, and technology required for recovery.
The diagram, shown on Figure 3, illustrates what was previously mentioned. According to the literature, this triangle demonstrates that approximately 10% of the total recoverable hydrocarbon resources are conventional oil and gas (red region described by the small volumes and easy to develop resources), whereas 90% of the recoverable hydrocarbons are from unconventional resources, with larger volume and difficult to develop reservoirs, as displayed by the base of the triangle.
Figure 3 – Triangle resource
Source: Dong et al. (2012)
18
development and production of the reservoir. Holditch and Lee (1987) affirm that unconventional reserves are much greater than conventional ones. This high energy capacity should be explored and, for this purpose, a significant field of study about new technology and production methods is required.
2.2 Unconventional resources in the world
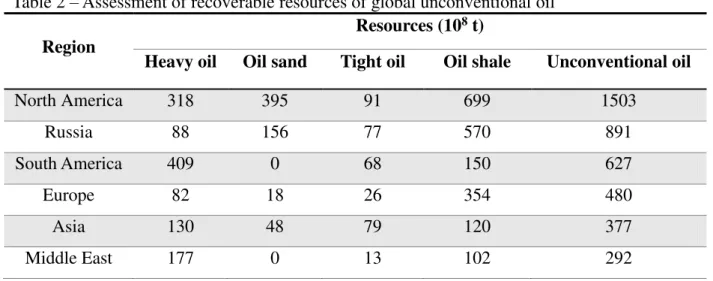
Wang et al. (2016) performed an assessment study to evaluate unconventional oil
and gas resources around the world. They evaluated the recoverable potential of 346 basins around the world. This study revealed that the global unconventional oil resources capacity is 4,421x108 t, being 1,267x108 t of heavy oil, 641x108 t of oil sands, 414x108 t of tight oil,
2,099x108 t of shale oil. Besides that, the global recoverable unconventional gas resources are
estimated in 227x1012 m3, being 161x1012 m3 of shale gas, 17x1012 m3 of tight gas, and
49x1012 m3 of coalbed methane.
The assessment presented by Wang et al. (2016) also says recoverable
unconventional oil resources are mainly concentrated in 54 countries, and the first 10 countries on the list are United States, Russia, Canada, Venezuela, Brazil, China, Belarus, Saudi Arabia, France, and Mexico, accounting for 82.4% of the global total. Unconventional gas resources are mainly concentrated in 37 countries, and the first 10 countries on the list are United States, China, Russia, Canada, Australian, Iran, Saudi Arabia, Argentina, Libya, and Brazil, with resources totalizing 76.8% of the global total.
Table 2 and 3 show the assessment of recoverable oil and gas volumes distribution in each region of the world, respectively.
Table 2 – Assessment of recoverable resources of global unconventional oil
Region Resources (10
8 t)
Heavy oil Oil sand Tight oil Oil shale Unconventional oil
North America 318 395 91 699 1503
Russia 88 156 77 570 891
South America 409 0 68 150 627
Europe 82 18 26 354 480
Asia 130 48 79 120 377
19
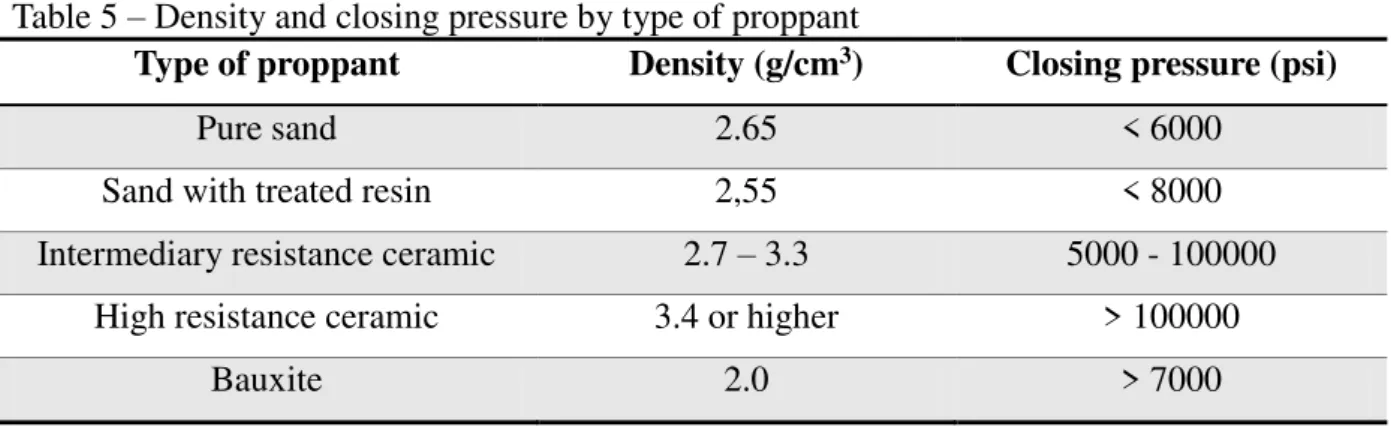
Africa 63 24 42 68 197
Oceania 0 0 18 36 54
Total 1267 641 414 2 099 4 421
Source: Adapted from Wang et al. (2016).
Table 3 – Assessment of recoverable resources of global unconventional natural gas
Region Resources (10
12 m3)
Shale gas Tight gas Coalbed methane Unconventional Gas
North America 34 5 17 56
Asia 26 9 14 49
Russia 15 0 15 30
Middle East 21 0 0 21
Africa 19 0 0 19
South America 19 0 0 19
Europe 16 1 0 17
Oceania 11 2 3 16
Total 161 17 49 227
Source: Adapted from Wang et al. (2016).
2.3 Hydraulic fracturing
2.3.1 Fracture materials (Proppant and Fluid)
The main materials in a hydraulic fracturing process are the fluid and the proppant agent. To keep the fracture opened and ensure it will have an acceptable conductivity, proppant must be carried by the fluid through the formation. The most common fluid in this process is a mix of water and some additives. The presence of additives is important to improve proppant transport, to adjust flow in the formation and to reduce friction during the treatment. However, in water sensitive formations, oil based fluid (such as kerosene and diesel) should be used.
20
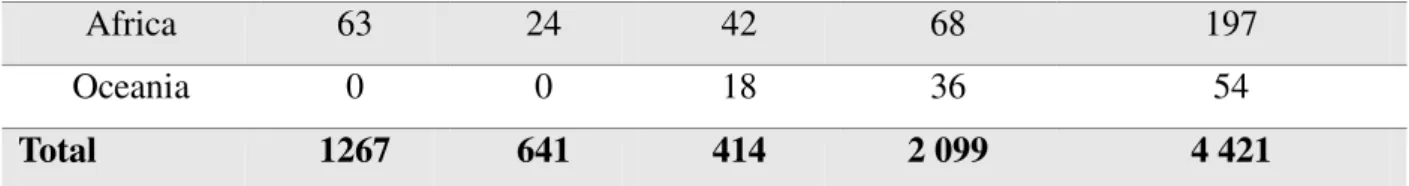
the latter is responsible for keeping the fractures opened and conductive. The other 2% of the fracking fluid consist of a series of additives, each one with its specific function. Table 4 describes some additives that may be present in the hydraulic fracturing fluid and their respective function.
Table 4 – Fluid treatment additives
Product Description of purpose Results in the well
Acids
Help on mineral dissolution and on the induction of fractures on the reservoir rock. Cleans up perforation intervals of cement and drilling mud prior to fracturing fluid injection.
Reacts with minerals present in the formation, producing salt, water and neutralized carbon dioxide.
Bactericide agent
Eliminates bacteria that are present in the water, preventing them from producing corrosive sub products.
Reacts with organisms that can be present on the treatment fluid and/or in the formation.
Breakers Retard the breaking of the treatment
gels.
In the formation, it reacts with the crosslinker and gel making it possible the recovery of the fracturing fluid.
Clay stabilizer
Prevents swelling of clays in the formation clays, which could block pore spaces.
Reacts with the clays present in the formation through the ionic exchange of Sodium and Potassium.
Corrosion inhibitor Prevents corrosion on the metallic equipment present in the wells.
Connects to the metallic surfaces as tubes and other bottom-hole equipment.
Crosslinker
Keeps the fluid viscosity in the treatment when the temperature increases.
Combined with the breaker in the formations, it forms salts that returns to the surface with the water.
21
pressure loss. It also, allows fracture fluids to be injected at optimum rates.
in the presence of high
temperatures and some
chemicals it can be consumed by organisms.
Iron control
Prevents the precipitation of
carbonates and sulfates which could plug off the formation.
Reacts with minerals in the formations, creating salts, carbon dioxide and water.
pH adjusting agent
Adjusts and controls the pH to keep the effectiveness of other additives such as crosslinkers.
Reacts with acid agents in the treatment fluid keeping the pH neutral.
Fouling Inhibitor Prevents the fouling deposition on bottom hole and surface equipment.
Connects to bottom-hole equipment preventing from fouling deposits.
Surfactant
Reduces fracturing fluid surface tension and increases the fluid treatment viscosity.
Keeps the fluid viscosity high until to breaker becomes active.
Source: Adapted from Oliveira (2012).
According to Wieland (1971), fluids that are more viscous are better for transportation and suspension of proppant. The use of such fluids leads to longer fractures and higher proppant concentration, in other words, they are capable to generate fractures with a higher flow capacity. Though, many times it is better to use fluids with low viscosity, since they are cleaner, meaning they will not leave residues that can affect its conductivity in the fracture.
The choice of transport fluid in a design is an important step: every formation has its own peculiarities and, depending on the desired results, there is the best treatment fluid to be chosen. The mechanism of proppant transport of slickwater, a common fluid for fracturing in shale reservoirs, is different from standard water. Since slickwater has only small concentration of polymers, it does not require high viscosity or elasticity to keep the proppant in suspension. In this case, if the design requires a higher fluid suspension capacity, it is better to use a hybrid fracturing treatment fluid system, in which the injection of slickwater and gelled fluids are alternated creating complex fracture network in tight formations (CHONG et
22
The proppants are solid materials, basically sand, treated sand or man-made ceramic materials, bauxite, resin, whose main function is to keep the fracture opened during and after the treatment. Figure 4 shows how some of these materials look like, in this case a ceramic proppant is shown. Besides the material type, the size of proppant is very important in a hydraulic fracturing job. These agents are divided in different sizes, generally between 8 and 140 mesh. The mesh size is the number of openings across one square inch of screen (LIANG et al., 2015)
.
Thus, high mesh sizes lead to high number of openings, which meanssmall proppants.
Figure 4 – Ceramic proppant illustration
Source: Adapted from Saldungaray and Palish (2013).
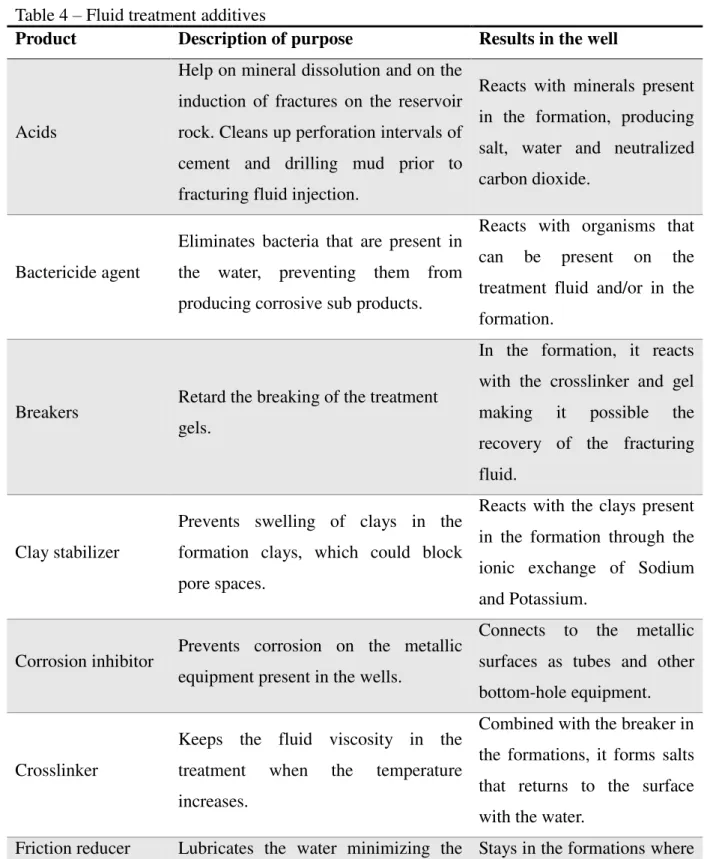
Besides the type of material and size, another important characteristic of proppants is their resistance. Proppants made of sand are the most used due to their low cost and abundance, however they are not very resistant and their closing pressure is below 6000 psi. On the other hand, sand treatment with resins leads to more resistant proppants, which have a higher closing pressure. Table 5 shows some proppants and their densities and closing pressures.
Table 5 – Density and closing pressure by type of proppant
Type of proppant Density (g/cm3) Closing pressure (psi)
Pure sand 2.65 < 6000
Sand with treated resin 2,55 < 8000
Intermediary resistance ceramic 2.7 – 3.3 5000 - 100000
High resistance ceramic 3.4 or higher > 100000
Bauxite 2.0 > 7000
23
2.3.2 Fracture mechanics and propagation.
The in-situ stresses in a formation are classified in three main stresses, generally the first is the highest stress resulted from the pressure of the underlying layers. In this environment, the fracture direction is normal to the least stress. So, the fracture opens against the three smaller stresses and grows in the direction of the lowest. In most of the cases, the minimum horizontal stress is the smallest one, creating vertical fractures.
As fluid is injected with a high flow rate, the pressure increases until it reaches the breakdown pressure. This pressure depends on the reservoir pressure, formation mechanical properties, the three main stresses and the formation tensile strength (DANESHY, 2010). According to Terzaghi (1923), the breakdown pressure for vertical wells is given by the following equation:
P T
Pbd 3H h 0 [1]
where, σh and σH are the minimum and maximum horizontal tension, respectively; T0 is the
rock tension and P is the reservoir pressure.
The fracture geometry is controlled by the net pressure exerted in the formation. This pressure is responsible for opening the fracture and for its propagations, and it consists of the difference between the fracture propagation pressure and the fracture closing pressure.
According to Kim e Wang (2011), the calculation of the net pressure can be given by the bottomhole pressure, which depends on the surface pressure, hydrostatic pressure and fluid friction pressure drop, subtracted by the perforation pressure drop and in-situ tension, as shown on Equation 2:
1
surf hyd fric perf
net P P P P
P [2]
The analysis of the net pressure is an important step during a hydraulic fracturing job. A logarithm diagram performed by Nolte and Smith (1981) represents the behavior of the net pressure as a function of injection time. This diagram is a powerful tool for the interpretation of the fracture geometry over the process. Nolte and Smith (1981) divided the process into four distinct modes, which describe different behaviors over the operation, as shown on Graph 1.
24
Graph 1 – Nolte-Smith Diagram
Source: Adapted from Britt (2015).
Mode 1 represents the period the height is confined only in the perforated region. The fracture grows only in length as fluid is injected. This mode is represented on the graph by a curve with slope between 1/8 and 1/4.
Mode 2 is the region where the curve has a zero slope, indicating a constant net pressure during a certain amount of time. There is a stable height growth and fluid loss to the formation due to the presence of natural fractures. The fluid injection pressure being compensated by the fluid loss characterizes this constant net pressure.
Mode 3 is represented by the unit slope curve. In this region, the net pressure growth is proportional to injection time, which can be due to the fact that fracture reached its maximum length or because it reached a high tension zone, as a shale content region.
In contrast, the fracture can change from Mode 2 to Mode 4, where the curve has a negative slope. A characteristic of this region is a fast and uncontrolled height growth due to it reaching a low tension region, it can also be a consequence of a screen-out due to fluid loss in Mode 2.
2.3.3 Optimum fracture and geometry
25
conductivity (FCD) can be calculated with Equation 3, which relates the formation capacity to
feed fluid to the fracture kxf and the fracture capacity to carry fluid kfw.
where kf is the fracture permeability (after the treatment), w is the fracture width, k is the
formation permeability and xf is the fracture half length. Some of these fracture properties is
illustrated on the Perkins-Kern-Nordgren (PKN) geometry, shown in Figure 5, which is normally used when the fracture length is much greater than the fracture height.
Figure 5 –PKN fracture geometry
Source: Adapted from PetroWiki. Accessed on 5th July, 2017.
According to Britt (2015), the optimum FCD for an oil reservoir fracturing (steady
state flow) is 2, and for a gas reservoir (transient flow) the optimum FCD is 10.
2.3.4 Fracture Design
The design is the most important step in a fracking process. This step consists on the calculation of fluid volume to be injected in each stage, choice of proppant, determination of flow rate and injection pressure. The fracture properties are the fracture height, width and half-length. It is important to mention that the fracture length is divided in two components,
f f CD
kx w k
26
the hydraulic length and the propped length. Creating a fracture with the longest possible length with proppant is the goal of all hydraulic fracturing jobs.
Each stage of a hydraulic fracturing job has its own operational conditions, as volume, type of proppant, type of fluid and injection flow. In the first stage, called pad, only fluid is injected in the well to fracture the formation. After this fracture has been propagated, the slurry stage starts. In this stage, the flow is mixed with sand (proppant) and it is injected in the fracture opened by the pad stage (GUO, 2007).
More details about each stage in a hydraulic fracturing treatment are discussed below:
Pad: in this stage fracturing fluid is injected without proppant agent. The pressure must be higher than the formation fracture pressure, so the fracture can propagate until the desired radius.
Slurry: in this stage, there is a gradual mix of proppant in the injection fluid. The injection of the slurry (fluid and proppant) must follow the pump schedule performed for this design.
Flush: after all fluid from the pad stage has been lost to the formation, a fluid is pumped to clean up the path created by the fracture.
Equation 4 shows in a simplified way how productivity increases after the treatment is related for steady state flow, for moderate to high permeability formations (between 2 and 5 mD). Folds of Increase (FOI) is given by the ratio of post treatment production and pretreatment production (Darcy Equation) and relates the well’s effective radius after the treatment with the damages before the formation has been fractured, the skin factor. ) ln( ) ln( ' w e w e r r S r r
FOI [4]
where re is the drainage radius, rw is the actual wellbore radius, rw’ is the effective well radius
and S is the skin factor.
2.4 Formation evaluation and logs
27
place, pre and post fracture rate of recovery.
Two of the most important aspects of formation evaluation are geological and core analysis. The evaluation of the formation material and measurement of the physical and chemical properties are crucial to a comprehensive formation evaluation (HOLDITCH; ROBINSON; WHITEHEAD, 1987). Core analysis is the best technique for obtaining some
rock properties as Young’s modulus and Poisson’s ratio. The Young’s modulus of the formation is the only fracturing parameter that can be directly measured through compression tests. This measurement improves the analysis of other geomechanical parameters.
The orientation and geometry of hydraulic fracturing can be determined by making an azimuthal gamma ray measurement (SIMPSON and GADEKEN, 1993; CHEN et al.,
2017). These radioactive log measurements are also important for determining where to frac, since it provides an indication of lithology. The Dipole Sonic Log provides critical information in defining the closure stress beds for determining fracture height growth parameters.
2.5 Reservoir considerations
In a hydraulic fracturing design, many factors that may directly influence the characteristic of the fracture should be considered. Reservoir properties as porosity, permeability, saturation and net pay must be analyzed in a project. Such properties, except the permeability, can be estimated through well logging analyses. The permeability and reservoir pressure can be obtained through well testing.
Another factor also controlled by formation properties is the fluid loss. This loss strongly affects the volume and fluid selection, so it should be considered during the project development as well. Geomechanical data from well testing and completion data must also be considered.
2.6 Objectives
2.6.1 General objectives
28
reservoir. All parameters mentioned before were considered, objecting to obtain a fracture with optimum FCDand acceptable drainage area.
2.6.2 Specific objectives
To find the net pay zone;
To find the reservoir pressure and permeability by well testing analysis;
Design pump schedule for two different scenarios: first for injection of 15000 BBL and then for 2000 BBL;
29
3 METHODOLOGY
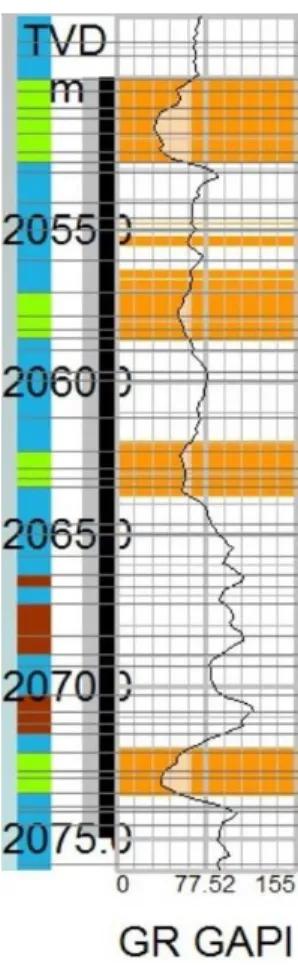
This design was developed from real data of a vertical well and formation of the field located in Chile. The reservoir properties are: perforation depth between 2050 and 2075 m, porosity of 17.6%, water saturation of 51.3%, drainage radius of 160 acres, and bottom-hole temperature of 92C. These properties were previously provided and obtained from log measurements and core tests data. Other reservoir properties were obtained after importing formation logs and pressure data to the software, and then the STIMPLAN could provide the well testing analysis and formation evaluation through logs. It was specified that the area of interest is a glauconite formation.
To identify the desired layer for the input of the software, a lithology log (Gamma Ray) was used. The formation zones to be fractured are where the gamma ray logs are below 65 °API. Figure 6 shows the gamma ray measurements by depth, the net pay for the formation is the lighter orange part, being the total net pay height of 7.6 m. The injection pressure data, measured on the surface was imported to the software as well, and from them it was determined some reservoir properties, minimum horizontal stress and breakdown pressure.
Figure 6 – Gamma ray measurements by depth in meters
30
The bottom-hole pressure was determined by adding the well hydrostatic pressure to the surface pressure available. For this, it was considered a density of 9.0 lb/gal for the completion fluid. The reservoir pressure and permeability were obtained from analyses of the bottom-hole pressure versus time (build-up test), using the Horner Plotgraph in STIMPLAN. Graph 2 shows this plot, from where these reservoir properties were obtained.
Graph 2 – Horner plot
Source: author.
The geomechanical profile from the logs and reservoir data obtained from the well tests, were used, first, to develop a design limited to 15,000 barrels of fluid volume. Then a second design was proposed, but limited to 2,000 barrels of fluid volume. For both designs, it was considered two fluids for the fracking: slick water (water containing a low concentration of polymers) and cross-linked gel (50 X-Link_HPG), this latter was chosen due to its high viscosity which makes it good to carry proppant.
Many options for the pump schedule were considered in the design, objecting to obtain a reasonable FCD and fracture length. For the first scenario, it were necessary nineteen
stages, being four stages with 610.5 barrels for the pad, and more fifteen stages with 847.2 barrels each one with proppant (Ottawa Sand 20/40). The pumping flow rate for each stage varied from 20 to 50 barrels per minute.
31
4 RESULTS AND DISCUSSION
4.1 Results for Design 1
For this design, the hydrostatic pressure for a depth of 2062.3 meters (mid perforation depth), was 3220.7 psi. Through well testing analyses (build-up test), the values obtained for reservoir pressure and permeability were 3622.3 psi e 0.0128 mD, respectively. This value of permeability is low, and according to the literature, the optimum fracture should be long.
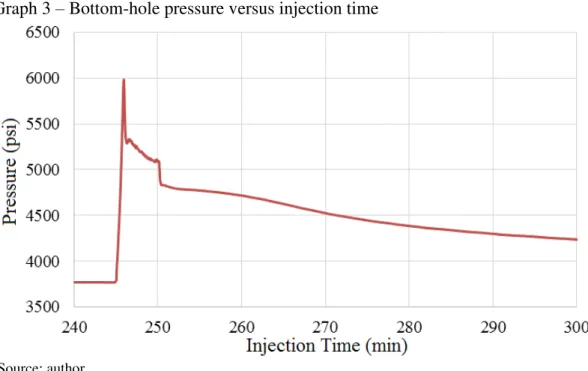
From the real pressure versus injection time data plotted in Graph 3, the breakdown pressure was determined by the peak of the curve, being approximately 5920 psi.
Graph 3 – Bottom-hole pressure versus injection time
Source: author.
Table 6 presents the results obtained for this fracture. It can be noted that due to the high fluid volume injected, the fracture is long. In this case, the fracture propped length was approximately the same as the hydraulic length. On the other hand, the maximum fracture height is relatively high, being extended until an upper area to the perforation area. This shows the tendency of the formation to develop higher fractures.
32
Table 6 – Results for design 1
Properties Value
Half length (m) 2173
Propped length (m) 1893
Fluid loss (bpm) 7.92
Maximum height (m) 155.3
Average width (in) 0.19
FCD 9.52
Source: author.
For this design, the obtained FCD was 9.52, which is very close to the optimum
value for gas reservoirs that is 10.
On Graph 4, the behavior of the net pressure versus injection time for this project is shown. We can note the behavior of Mode 1 of Nolte and Smith (1981) diagram in the first seventeen minutes. Then, there is an uncontrolled height growth following by oscillations of grow in height and length as shown between seventeen and approximately four hundreds minutes. Finally, after this, just an uncontrolled height growth is present, when a low-tension region is reached, characterizing Mode 4.
Graph 4 – Nolte-Smith diagram for design 1
Source: author.
33
geometry, if this design was executed on the field. The blue region corresponds to the pad region, and the green region is the slurry region, in which the proppant agent is present. Looking at Figure 7, it can be noted that the increase on fluid viscosity (by changing from pad stage to slurry stage) contributed to an increase in fracture height, making it to extend beyond the perforation zone, as it was expected.
Figure 7 – Two-dimensional representation of the fracture obtained in the simulation for injecting 15,000 BBL (blue region: pad; green region: slurry)
Source: author.
4.2 Results for Design 2
34
Table 7 – Results for design 2
Properties Value
Half length (m) 658
Propped length (m) 596
Fluid loss (bpm) 2.25
Maximum height (m) 66.6
Average width (in) 0.21
FCD 9.18
Source: author.
On figure 8, it is possible to observe the fracture propagation and its bi-dimensional geometry. By looking at this figure, it can be noted that the increase on fluid viscosity (by changing from pad stage to slurry stage) did not contributed to an increase of the fracture height as in design 1. In addition, we can see that for this design the proppant agent did not spread for almost all pad area. This could be due to the used proppant concentration or the treatment fluid. Probably, for the design with only 2,000 barrels of injection fluid, the more viscous fluid should be used, so it can carry the proppant to a larger area.
Figure 8 – Two-dimensional representation of the fracture obtained in the simulation for injecting 2,000 BBL (blue region: pad; green region: slurry)
35
Graph 5 shows the behavior of the net pressure versus injection time when injection 2,000 BBL with the proposed pumping schedule. We can note the behavior of Mode 1 of Nolte and Smith (1981) diagram in the first ten minutes. Then, the critical pressure is presented between ten and twenty three minutes, when the curve slope is zero. Finally, after 65 minutes of injection time, a low-tension region is reached, where the fracture behavior is characterized by Mode 4, in which uncontrolled height growth happens.
Graph 5 – Nolte-Smith diagram for design 2
36
5 CONCLUSION
It can be concluded that the two presented designs showed good results for fracking of this formation. The obtained fractures have a long length, which, according to the literature, is a good geometry for low permeability gas reservoir. However, it is better to use the larger volume design since it provides a longer fracture. The resulted FCDwas close to the
optimum value for gas reservoirs, which shows a good relationship between fracture conductivity and length in both designs.
Through logging analysis on the software, it was possible to estimate the height of the interest zone and then put this value as input. The well testing analysis was very helpful, being essential to find the reservoir permeability and pressure.
Another point to mention is the fact that the geometry for the designed fracture confirms the behavior of Nolte-Smith diagram, which evidences its importance in a data analyses for a project.
It was possible to confirm that the use of more viscous fluids affects the fracture geometry, as shown for injection of cross-linked fluid, whichmade the fracture grows quickly in height, more than if only slick water was used. However, the use of this fluid made it possible to get a longer propped length, as proppant agent was distributed over a reasonable part of the fracture. We can conclude the used technique brought interesting results for this reservoir, showing that the hydraulic fracturing is a good method to maximize the production in low permeability reservoirs.
37
REFERENCES
BRITT, L. Fracturing Fundamentals. Missouri University of Science and Technology, Rolla, 2015.
CASTRO, R. D. A. Estudo da aplicação de fraturamento hidráulico em reservatórios de baixa permeabilidade com características da bacia do Parnaíba. Trabalho de Conclusão de Curso – Departamento de Engenharia de Petróleo, Universidade Federal do Rio Grande do Norte, 2015.
CHEN, Q.; ZHANG, F.; LIU, J.; ZHANG, Q.; TIAN, L.; WU, H. A New Borehole Gamma Ray Imaging Method To Determine Hydraulic Fracture Using GD Neutron Tracer Logging. SPWLA 58th Annual Logging Symposium, Oklahoma, 2017.
CHONG, K. K.; GRIESER, Q.V.; PASSMAN, A.; TAMAYO, C.H.; MODELAND, N.; BURKE, B. A Completions Guide Book to Shale-Play Development : A Review of Successful Approaches Towards Shale-Play Stimulation in the Last Two Decades. Canadian Unconventional Resources & International Petroleum Conference, p. 1–27, 2010.
DANESHY, A. Hydraulic Fracturing To Improve Production. SPE Tech 101, Vol. 6, No. 3, p. 14–17, 2010.
DONG, Z.; HOLDITCH, S.A.; MCVAY, D.A; AYERS, W.B. Global Unconventional Gas Resource Assessment. SPE The Canadian Unconventional Resources Conference,
November, 2011.
DONGXIAO, Z.; TINGYUN, Y. Environmental impacts of hydraulic fracturing in shale gas development in the United States. Petroleum Exploration and Development, v. 42, n. 6, p. 876–883, 2015.
38
GOMAA, A. M.; QU, Q.; MAHARIDGE, R.; NELSON, S.; REED, T. New Insights into Hydraulic Fracturing of Shale Formations. International Petroleum Technology
Conference, Doha, p. 1, 2014.
GUO, B.; LYONS, W. C; GHALAMBOR, A. Petroleum Production Engineering, 2007.
HOLDITCH, S. A.; LEE, W. J. Keys To Realizing Potential Of Unconventional Gas. Texas, EUA, 2007. p 3.
HOLDITCH, S. A.; ROBINSON, B.M.; WHITEHEAD, W.S.; Prefracture and Postfracture Formation Evaluation Necessary To Characterize the Three-Dimensional Shape of a Hydraulic Fracture. SPE International Meeting on Petroleum Engineering, Beijing, 1987.
KIM, G.; WANG, J. Y. Interpretation of Hydraulic Fracturing Pressure in Low-Permeability Gas Formations. SPE Production and Operations Symposium, Oklahoma, 2011.
LIANG, F.; SAYED, M.; AL-MUNTASHERI, G. A.; CHANG, F.F.; LI, L. A comprehensive review on proppant technologies. Petroleum, v. 2, n. 1, p. 26–39, 2015.
NOLTE, K. G.; SMITH, M. B. Interpretation of Fracturing Pressures. Journal of Petroleum Technology, v. 33, n. 9, p. 1,767-1,775, 1981.
OLD, S.; HOLDITCH, S.A.; AYERS, W.B.; MCVAY, D.A. PRISE: Petroleum Resource Investigation Summary and Evaluation. SPE Eastern Regional/AAPG Eastern Section Joint Meeting, p. 11–15, 2008.
OLIVEIRA, A. DO A. DE. Seleção De Poços Para Operações De Estimulação Utilizando Inteligência Artificial. Projeto de Graduação – Curso de Engenharia de Petróleo da Escola Politécnica, Universidade Federal do Rio de Janeiro, 2012.
39
SIMPSON, G. A.; GADEKEN, L. L. Interpretation of Directional Gamma Ray Logging Data for Hydraulic Fracture Orientation. SPE Rocky Mountain Regional/Low
Permeability Reservoirs Symposium, p. 95–106, Denver, 1993.
TERZAGHI, K. Die Berechnung der Durchlässingkeitsziffer des Tones aus dem Verlauf der Hydrodynamischen Spannungsersheinungen. Viena, p.105:132, 1923.
WANG, H.; MA, F.; TONG, X.; LIU, Z.; ZHANG, X.; WU, Z.; LI, D.; WANG, B.; XIE, Y.; YANG, L. Assessment of global unconventional oil and gas resources. Petroleum Exploration and Development, v. 43, n. 6, p. 925–940, 2016.
WIELAND, D. R. Recent Trends in Hydraulic Fracturing. Eastern Regional Meeting of Society of Petroleum Engineers of AIME, Charleston, 1971.
ZOU, C.; YANG, Z.; DAI, J.; DONG, D.; ZHANG, B.; WANG, Y.; DENG, S.; HUANG, J.; LIU, K.; YANG, C.; WEI, G.; PAN, S. The characteristics and significance of conventional and unconventional Sinian-Silurian gas systems in the Sichuan Basin, central China. Marine and Petroleum Geology, v. 64, p. 386–402, 2015.
Frac Focus Chemical Disclosure Registry. Hydraulic Fracturing: The Process. Available at: < http://fracfocus.ca/hydraulic-fracturing-how-it-works/hydraulic-fracturing-process>
Accessed on: 02/07/2017.
International Energy Agency. Key World Energy Statistics 2015. Available at:
<https://www.iea.org/publications/freepublications/publication/KeyWorld_Statistics_2015.pd >. Accessed on: 02/07/2017.
PetroWiki. Fracture propagation models. Available at:
<http://petrowiki.org/Fracture_propagation_models#cite_note-r6-6>. Accessed on: 05/07/2017.
Mother Earth News. The Case for a Ban on Fracking. Available at: