Data collected on large-scale surveys around the
seamounts and islands of northeastern Brazil
provide information on the hyperiid amphipod
populations. Thirty-six species were identiied.
Most of the species belong to the Infraorder
Physocephalata, representing 21 genera and 13
families. Thirteen species (
Vibilia australis, L.
latissimus, L. macrophthalmus, L. schizogeneios,
Phronima atlantica, Phrosina semilunata, Primno
brevidens, Eupronoe minuta, Oxycephalus clause,
Rhabdosoma whitei, Amphithyrus bispinosus,
Leptocotis tenuirostris and Tetrathyrus forcipatus
)
have not previously been recorded in this region. The
spatial distribution of the hyperiid amphipods was
very patchy. Each area of these amounts and islands
of northeastern Brazil has diferent oceanographic
features and can be characterised by a clearly deined
group of most abundant species.
AbstrAct
Descriptors:
Zooplankton, Variability, Distribution,
Oceanographic Characteristics, Oceanic region.
Dados coletados em cruzeiro de larga escala em torno
dos montes submarinos e ilhas ao largo do Nordeste
do Brasil forneceram informações sobre os anfípodes
hyperiideos. Foram identiicadas 36 espécies, a maioria
pertencente à infraordem Physocephala, representando
21 gêneros e 13 famílias. Treze espécies,
Vibilia australis,
L. latissimus, L. macrophthalmus, L. schizogeneios,
Phronima atlantica, Phrosina semilunata, Primno
brevidens, Eupronoe minuta, Oxycephalus clause,
Rhabdosoma whitei, Amphithyrus bispinosus,
Leptocotis tenuirostris e Tetrathyrus forcipatus são
registros novos para a região Nordeste brasileira. A
distribuição espacial dos anfípodes hyperiideos foi
altamente irregular. Veriicou-se que cada área ao redor
dos montes submarinos e ilhas ao longo da área estudada
apresentaram diferentes características oceanográicas e
puderam ser caracterizadas por um grupo deinido de
espécies mais abundantes.
resumo
Descritores:
Zooplâncton, Variabilidade, Distribuição,
Características Oceanográficas, Região oceânica.
INTRODUCTION
Hyperiid amphipods are signiicant components of epipelagic and mesopelagic communities. In mesoplankton and macroplankton they are only less in abundance than
the copepods, euphausiids, chaetognaths, and gelatinous
animals (VINOGRADOV, 2005). They are distributed
in the water column from the surface layers to the
bathypelagial depths, but most of the 250 currently known species occur within the 0 to 100 m layer (VINOGRADOV
et al., 1996). Due to their relatively weak vertical
migrations, most plankton surveys deal with the epipelagic hyperiid fauna in diferent regions; however, the factors
that determine the distributional patterns of this group are
not fully understood (LAVANIEGOS; OHMAN, 1999), particularly in tropical latitudes. MONTÚ (1994) reported hyperiid amphipod distributions in the northeast of Brazil and LIMA and VALENTIN (2001) in the southeast. This present study is the irst to report on planktonic amphipods and their relation, in the northeast of Brazil, to speciic
environmental factors
The islands in the Atlantic Ocean of northeastern Brazil include the North Brazilian Chain, the Fernando de Noronha Chain and the Saint Peter and Saint Paul Archipelago. With the exception of that of Saint Peter and Saint Paul, these regions also contain several seamounts, with depths (at the summit) ranging from 20 to 250 m and displaying a great variety in size and shape. The main oceanic currents inluencing these areas are the South Equatorial Current (SEC) and the North Brazil Current (NBC), both lowing at the surface and the Equatorial Undercurrent (EUC) lowing through the subsurface layer (RICHARDSON; MCKEE, 1984; PETERSON; STRAMMA, 1991). Submarine relief (e.g., seamounts and islands) and local currents may inluence the hydrological
processes.
The efects of mesoscale low around and over
seamounts result in higher primary production and
increased abundances of phytoplankton and zooplankton. Seamounts alter the surrounding physical regime, often
causing nutrient enrichment by vertical mixing of water
masses (DOWER et al., 1992). Topographical features
may enhance foraging success by concentrating prey
through changes in vertical and horizontal water velocity (HERNÁNDEZ-LEÓN, 1991).
Various types of horizontal and turbulent mixing can result in the aggregation or dispersion of planktonic populations. Some zooplankton have wide distributions
that encompass a broad spectrum of environmental conditions, while others are restricted to narrow limits
of temperature and salinity, which are known to be the most important parameters afecting the distribution and abundance of plankton (MOUNY; DAUVIN, 2002).
In this study, we have analysed the composition, distribution and abundance of the hyperiid amphipods in relation to the general oceanographic characteristics
around the seamounts and islands of northeastern Brazil; an oceanic region that has a diferent hydrographic regime due to topography-low interactions on thermohaline structures. The working hypothesis was that the
composition and distribution pattern of the hyperiid
amphipod species are diferent in each of the four areas studied according to the hydrographical features analyzed
and the increasing biomass and species density in the regions with topographical upwelling.
MATERIAL AND METHODS
The study area, in the Atlantic Ocean of the northeastern coast of Brazil (between 0º and 6º S), includes four areas (Figure 1): the St. Peter and St. Paul Archipelago, located at 0º 56.2’ N and 29º 20.6’ W; the Fernando de Noronha Chain, located from 3º to 5º S and 32º to 38º W; the North Brazilian Chain, located from 1º to 3º S and 37º to 39º W and the oceanic area, located from 0º to 2º S and 30º to 34º W.
A total of 60 samples were collected in the study area during expeditions made between January and April 1997 (Figure 1). At each station oblique zooplankton tows were made with a Bongo net with a 50 cm diameter and 500µm mesh opening, from 200 m depth to the surface. Plankton samples were ixed in seawater with a solution of 4% formaldehyde neutralised with sodium tetraborate.
The abundance of individuals in each sample was
estimated by the volume of water iltered by the net and expressed as individuals per 100 m3. Species identiication
was based on the morphological descriptions given by
BOLTOVSKOY (2005). The horizontal distribution and
abundance patterns were determined for each species. All specimens have been deposited in the collection of
the Plankton Laboratory, Zoology Department, Federal University of Bahia.
Seawater samples for the analysis of phytoplankton
biomass (chlorophyll a) were collected using Nisken
the basis of STRICKLAND and PARSONS (1972). Determination of the zooplankton biomass (organic
weight) was carried out according to the methodology
of OMORI and IKEDA (1992). Temperature and
salinity surfaces were measured using a self-contained
Conductivity, Temperature and Depth meter (CTD) (SPE 911 plus).
Data analysis
All variables (temperature (Cº)), salinity, organic weight (g.100m-3) and chlorophyll a (mg L-1), were tested
for normality using the Kolmogorov and Smirnov test and for homogeneity using the Bartlett test and, when necessary,
were transformed accordingly. In order to determine the
statistical signiicance of the spatial variability of biotic
and abiotic factors and hyperiid amphipods abundance a
Kruskal-Wallis one-way analysis was performed with an alpha value of 0.05.
Ten species were selected on which to perform multivariate analysis. Thus, the data matrix consisted
of 60 stations and 10 species. A similarity matrix was
calculated using the Euclidean distance index and cluster
analysis was undertaken taking into account sampling
units (stations) and species. The cluster dendrogram was cut when the resulting cluster groups were ecologically
interpretable; the similarity cut-of levels showed 42%
similarity for the station clusters.
A canonical correspondence analysis (CCA) was
performed to determine the existing relationships between abundance of the species and the oceanographic variables
(temperature, salinity, chlorophyll a and organic weight).
CCA is a unimodal for non-linear multivariate gradient analysis and was employed using the CANOCO program. The CCA used environmental information to constrain
a reciprocal averaging ordination between taxa and the
respective sample (TER BRAAK, 1986).
RESULTS
Hydrography, chlorophyll a and zooplank
-ton biomass
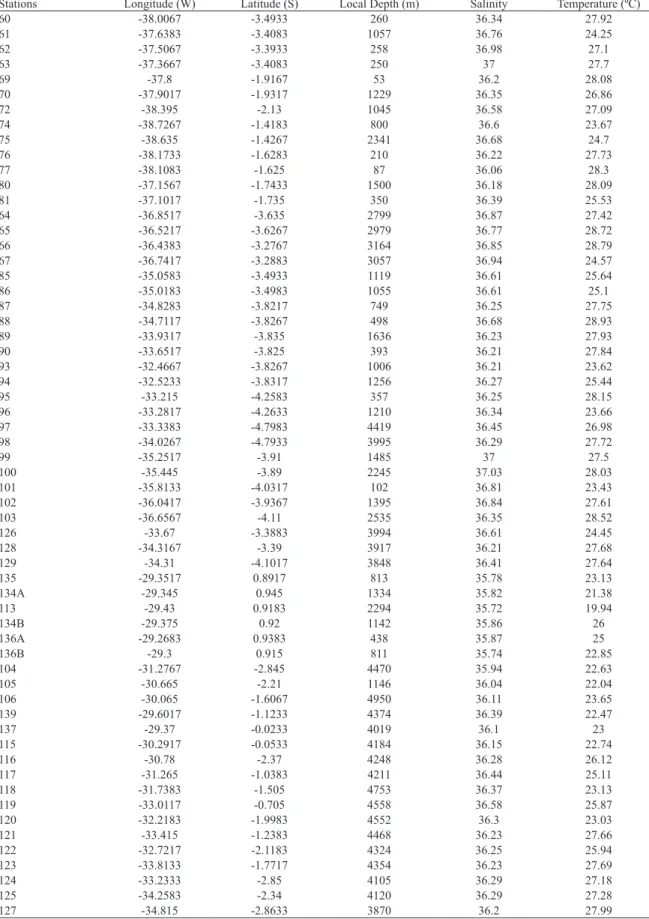
Average water temperature at 1% light penetration was 25.9ºC (minimum of 21.38ºC and maximum of 8.96 ºC). Average salinity at 1% light penetration was 36.39 PSU, with only small variations (minimum of 35.74 and maximum of 37.03) (Table 1). The horizontal distribution of the salinity showed high values in the North Brazilian Chain and the Fernando de Noronha Chain and lower values in the Saint Peter and Saint Paul Archipelagos.
Salinity proiles down to 150 m showed a slight
increase with depth. These typical distributions were encountered at all stations. The thermocline was present throughout the whole area.
The chlorophyll a luctuated between 0.19 and
3.03 mg.L-1. In general the lowest values were observed in
the North Brazilian Chain and the highest in the oceanic area and Saint Peter and Saint Paul Archipelagos.
The Kruskal-Wallis test (p < 0.01) revealed signiicant
diferences in temperature, salinity and chlorophyll a as between the four sampling areas.
Zooplankton biomass as calculated from the Bongo catches (500 µm) presented lower values oscillating between 0.26 and 4.07 g.100 m-3 (Figure 2). The distribution
Table 1. Position and hydrographical data of the stations.
Stations Longitude (W) Latitude (S) Local Depth (m) Salinity Temperature (ºC)
60 -38.0067 -3.4933 260 36.34 27.92
61 -37.6383 -3.4083 1057 36.76 24.25
62 -37.5067 -3.3933 258 36.98 27.1
63 -37.3667 -3.4083 250 37 27.7
69 -37.8 -1.9167 53 36.2 28.08
70 -37.9017 -1.9317 1229 36.35 26.86
72 -38.395 -2.13 1045 36.58 27.09
74 -38.7267 -1.4183 800 36.6 23.67
75 -38.635 -1.4267 2341 36.68 24.7
76 -38.1733 -1.6283 210 36.22 27.73
77 -38.1083 -1.625 87 36.06 28.3
80 -37.1567 -1.7433 1500 36.18 28.09
81 -37.1017 -1.735 350 36.39 25.53
64 -36.8517 -3.635 2799 36.87 27.42
65 -36.5217 -3.6267 2979 36.77 28.72
66 -36.4383 -3.2767 3164 36.85 28.79
67 -36.7417 -3.2883 3057 36.94 24.57
85 -35.0583 -3.4933 1119 36.61 25.64
86 -35.0183 -3.4983 1055 36.61 25.1
87 -34.8283 -3.8217 749 36.25 27.75
88 -34.7117 -3.8267 498 36.68 28.93
89 -33.9317 -3.835 1636 36.23 27.93
90 -33.6517 -3.825 393 36.21 27.84
93 -32.4667 -3.8267 1006 36.21 23.62
94 -32.5233 -3.8317 1256 36.27 25.44
95 -33.215 -4.2583 357 36.25 28.15
96 -33.2817 -4.2633 1210 36.34 23.66
97 -33.3383 -4.7983 4419 36.45 26.98
98 -34.0267 -4.7933 3995 36.29 27.72
99 -35.2517 -3.91 1485 37 27.5
100 -35.445 -3.89 2245 37.03 28.03
101 -35.8133 -4.0317 102 36.81 23.43
102 -36.0417 -3.9367 1395 36.84 27.61
103 -36.6567 -4.11 2535 36.35 28.52
126 -33.67 -3.3883 3994 36.61 24.45
128 -34.3167 -3.39 3917 36.21 27.68
129 -34.31 -4.1017 3848 36.41 27.64
135 -29.3517 0.8917 813 35.78 23.13
134A -29.345 0.945 1334 35.82 21.38
113 -29.43 0.9183 2294 35.72 19.94
134B -29.375 0.92 1142 35.86 26
136A -29.2683 0.9383 438 35.87 25
136B -29.3 0.915 811 35.74 22.85
104 -31.2767 -2.845 4470 35.94 22.63
105 -30.665 -2.21 1146 36.04 22.04
106 -30.065 -1.6067 4950 36.11 23.65
139 -29.6017 -1.1233 4374 36.39 22.47
137 -29.37 -0.0233 4019 36.1 23
115 -30.2917 -0.0533 4184 36.15 22.74
116 -30.78 -2.37 4248 36.28 26.12
117 -31.265 -1.0383 4211 36.44 25.11
118 -31.7383 -1.505 4753 36.37 23.13
119 -33.0117 -0.705 4558 36.58 25.87
120 -32.2183 -1.9983 4552 36.3 23.03
121 -33.415 -1.2383 4468 36.23 27.66
122 -32.7217 -2.1183 4324 36.25 25.94
123 -33.8133 -1.7717 4354 36.23 27.69
124 -33.2333 -2.85 4105 36.29 27.18
125 -34.2583 -2.34 4120 36.29 27.28
Figure 2. Horizontal distribution of organic weight (g.100 m-3) around seamounts and islands of northeastern Brazil.
of biomass followed the isotherms very clearly (Figure 2).
High biomass values (> 4 g.100 m-3) were found in areas
where temperature at 1% light penetration did not exceed 23.5ºC. At higher water temperatures, such as around the Fernando de Noronha and North Brazilian Chains, biomass ranged between 0.2 and 1.6 g.100 m-3. The results
showed a decline in zooplankton biomass progressing southward in the study area (from the Saint Peter and Saint Paul Archipelago to the Fernando de Noronha Chain) (Figure 2). According to the Kruskal-Wallis
test (p ≤ 0.005), the biomass values were signiicantly
diferent between areas.
Specific composition
Thirty-six species were identiied from the 60 samples
around the seamounts and islands within the study area
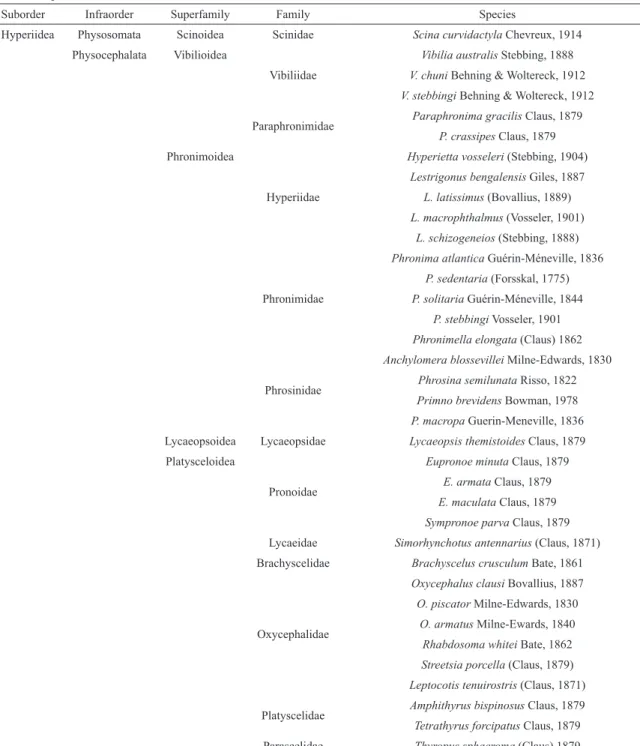
of the northeastern coast of Brazil. Most of the species
belong to the Infraorder Physocephalata, representing 21 genera and 13 families (Table 2). Hyperiid amphipod
abundances difered signiicantly across the four sampling regions (Kruskal-Wallis one-way ANOVA, p ≤ 0.001).
Only 10 species were suiciently abundant as to
permit a more detailed discussion of their ecology. The
most abundant species was Eupronoe armata, representing
9.58% of the hyperiid amphipods, followed by Eupronoe maculata (9.22%), Lestrigonus bengalensis (8.46%) and Paraphronima gracilis (7.78%). The ten most abundant
species together accounted for 70% of total abundance
(Figure 3).
Spatial distribution
In this study, the average species density was
81.74 ± 56.47 ind.100m-3; the total density at individual
sites ranged between 13.33 and 274.29 ind.100m-3. The
spatial distribution of the hyperiid amphipods shows
greater density in the oceanic area close to the Saint Peter and Saint Paul Archipelagos (Figure 4).
The density values of the species ranged from 0.2 to 38.3 ind.100 m-3 (Table 3 (http://www.io.usp.br/index.
php/arquivos/send/355-vol-64-no-4-2016/4087-1233-tabela-3)). Eupronoe armata, Lestrigonus bengalensis,
Anchylomera beossevillei and Tetrathyrus forcipatus
were distributed all over the sampling area, being most
abundant in the Fernando de Noronha Chain and the North Brazilian Chain and exhibiting lower abundances in the oceanic area (Figure 5).
Eupronoe maculate, Paraphronima gracilis,
Hyperietta vosseleri and Lestrigonus latissimus had a wide spatial distribution, being mostly found in the oceanic
area and the Saint Peter and Saint Paul Archipelagos, luctuating between a minimum of 0.92, 0.91, 0.82 and 1.15 ind.100m-3 and a maximum of 31.91, 25.11, 21.52
and 29.89 ind.100m-3, respectively (Figure 6). Lestrigonus macrophthalnus was found in all areas in low abundances,
except for two stations near the Saint Peter and Saint Paul Archipelagos (Figure 7).
Relationships between the species of hype
-riid amphipods and environmental variables
In the CCA the irst two axes were the most important (Table 4). Normally, eigenvalues between 0.3 and 0.5 indicate the good dispersal of species along the respective axes (TER BRAAK, 1986; TER BRAAK; VERDONSCHOT, 1995). This applies to the irst axis of
Table 2. Species list around seamounts and islands of Northeastern Brazil.
Suborder Infraorder Superfamily Family Species
Hyperiidea Physosomata Scinoidea Scinidae Scina curvidactyla Chevreux, 1914
Physocephalata Vibilioidea
Vibiliidae
Vibilia australis Stebbing, 1888 V. chuni Behning & Woltereck, 1912 V. stebbingi Behning & Woltereck, 1912
Paraphronimidae Paraphronima gracilis Claus, 1879
P. crassipes Claus, 1879
Phronimoidea
Hyperiidae
Hyperietta vosseleri (Stebbing, 1904) Lestrigonus bengalensis Giles, 1887
L. latissimus (Bovallius, 1889) L. macrophthalmus (Vosseler, 1901)
L. schizogeneios (Stebbing, 1888)
Phronimidae
Phronima atlantica Guérin-Méneville, 1836 P. sedentaria (Forsskal, 1775) P. solitaria Guérin-Méneville, 1844
P. stebbingi Vosseler, 1901 Phronimella elongata (Claus) 1862
Phrosinidae
Anchylomera blossevillei Milne-Edwards, 1830 Phrosina semilunata Risso, 1822 Primno brevidens Bowman, 1978 P. macropa Guerin-Meneville, 1836
Lycaeopsoidea Lycaeopsidae Lycaeopsis themistoides Claus, 1879
Platysceloidea
Pronoidae
Eupronoe minuta Claus, 1879 E. armata Claus, 1879 E. maculata Claus, 1879 Sympronoe parva Claus, 1879
Lycaeidae Simorhynchotus antennarius (Claus, 1871)
Brachyscelidae Brachyscelus crusculum Bate, 1861
Oxycephalidae
Oxycephalus clausi Bovallius, 1887 O. piscator Milne-Edwards, 1830
O. armatus Milne-Ewards, 1840 Rhabdosoma whitei Bate, 1862 Streetsia porcella (Claus, 1879) Leptocotis tenuirostris (Claus, 1871)
Platyscelidae Amphithyrus bispinosus Claus, 1879
Tetrathyrus forcipatus Claus, 1879
Parascelidae Thyropus sphaeroma (Claus) 1879
The eigenvalues were fairly similar for the irst
and second axes and the correlation between species composition and environmental variables was high
(Table 4). Taken together this suggests that the measured
environmental variables account for most of the variance in the species data. The four environmental variables
explained 39.7% of the variance in species composition (0.407/1.025, Table 4).
The dispersion of CCA species scores resulted from
linear combinations of the environmental variables.
Strong environmental gradients were important correlates with abundance of species in the CCA. Temperature and salinity correlated most strongly with CCA 1. Another suite of environmental variables correlated with CCA 2 and CCA 1, including chlorophyll a and organic weight
Figure 3. Relative abundance of hyperiid amphipods species around seamounts and islands of northeastern Brazil.
Figure 4. Distribution of total hyperiid density (org. 100m-3) around seamounts and islands of northeastern Brazil.
Figure 5. Distribution of Tetrathyrus forcipatus, Lestrigonus bengalensis, Eupronoe armata and
Figure 6. Distribution of Hyperietta vosseleri, Eupronoe maculate, Lestrigonus latissimus and
Paraphronima gracilis (org. 100m-3) around seamounts and islands of northeastern Brazil.
Figure 7. Distribution of Primno macropa and Lestrigonus macrophthalnus (org. 100m-3) around seamounts and islands of northeastern Brazil.
CCA 1 occurred mostly at high salinity and temperature stations, whereas species with high values on CCA 1 and low values on CCA 2 occurred mostly at stations where
high chlorophyll a and organic weight were recorded.
To interpret ecological correlations the hyperiid amphipods structure was examined with respect to both
CCA axes and their associated environmental relationships. Species with positions near the centre of the ordination
(such as Eupronoe maculata) had low correlation with
all the environmental variables. The density of the
species Lestrigonus bengalensis, Tetrathyrus forcipatus
and Anchylomera bessevillei were relatively high at Fernando de Noronha Archipelago where the salinity and temperature were also high. In contrast, the densities of,
for instance, Primno macropa, Paraphronima gracilis,
Hyperietta vosseleri and Lestrigonus latissimus were high in the oceanic area where temperature and salinity
were low. Lestrigonus macrophthalnus has an ainity for
waters with lower temperatures where chlorophyll a and
organic weight are high (Figure 8).
The cluster analysis showed two groups (Figure 9): one group with 42% similarity though another group resulted if the cut of level was maintained at 35% similarity. The station groups are closely linked, corresponding to the species typical of each area, as noted in the CCA.
DISCUSSION
Hydrography, chlorophyll a and zooplankton
biomass
SOUZA et al. (2013) discuss the hydrographic structure
and the distribution of chlorophyll a around seamounts
and islands of northeastern Brazil in detail. They present temperature and salinity proiles of single stations as well as temperature and salinity distributions along diferent transects down to about 400m depth.
The stations 137, 139 and 134B, located much closer to the Saint Peter and Saint Paul Archipelagos, were
characterised by low temperature and salinity at the
Figure 8. Biplot of the species scores and important environmental correlation vectors in the irst two canonical correspondence analysis
dimensions.
Figure 9. Dendrogram from the analysis of sampling stations using Euclidean distance
classiication.
originating in deeper waters. They found evidence of upwelling reaching into the mixed layer and into the
euphotic zone, with the mixed layer reaching a depth of 50
m. The highest abundances of chlorophyll a coincided with
stations where upwelling was recorded by the authors.
Highest biomass values were also found in the
oceanic area and closer to the Saint Peter and Saint Paul Archipelagos, coincident with and likely supported by the
high concentrations of chlorophyll a. These diferences
which could boost phytoplankton production by injecting greater amounts of nutrients into the euphotic zone.
In general, the biomass of the area studied was very
low. BOLTOVSKOY (2005) mentions that maximum zooplankton biomass in the southwestern Atlantic occurs in nerític waters, with values reaching 100 g.100m-3 in
the top 200 m layer. NEUMANN-LEITÃO (1999) found
incoastal and oceanic waters of northeastern Brazil that
total biomass of the zooplankton variedfrom 12.14 mg.m-3
(ofshore station) to 117.14 mg.m-3 (inshore station).
Studies carried out in coastal and oceanic Brazilian area show that the western part of the South Atlantic Ocean displays levels of biomass and productivity typical of oligotrophic areas (BRANDINI, 1990; TEXEIRA; GAETA, 1991; METZLER et al., 1997). The low biomass
and productivity levels in the Atlantics waters of eastern Brazil are associated with the warm temperature and high salinity surface Tropical Water mass of the Brazil Current (SUSINI-RIBEIRO, 1999).
Specific composition
The hyperiid species collected in the Atlantic Ocean of Northeast of Brazil in 1997 are widespread in the
tropical world ocean, and most of them have been previously recorded in the tropical and subtropical Atlantic
Ocean (MONTÚ, 1994; LIMA; VALENTIN, 2001; VINOGRADOV et al., 1996; VINOGRADOV, 1999).
Thirteen species (Vibilia australis, L. latissimus, L. macrophthalmus, L. schizogeneios, Phronima atlantica,
Phrosina semilunata, Primno brevidens, Eupronoe minuta, Oxycephalus clause, Rhabdosoma whitei,
Amphithyrus bispinosus, Leptocotis tenuirostris and
Tetrathyrus forcipatus) had not previously been recorded
of northeastern Brazil.
VINOGRADOV (2005) stated that the hyperiid fauna
of a certain region could be characterised roughly by the
dominant species group. Overall, at least 23 species of hyperiids share the seamounts and islands of the northeast of Brazil with other fauna in the shelf waters (MONTÚ, 1994). The dominant species group of the northeast of Brazil seems to be diferent from that identiied in the south and southeast of Brazil (Lestrigonus bengalensis,
Simorhynchotus antennarius and Brachyscelus crusculum) (LIMA; VALENTIN, 2001), although L. bengalensis was among the dominant species. In the
Caribbean Sea, this species is less abundant (GASCA; SHIH, 2001; GASCA; SUÁREZ-MORALES, 2004) and in the Sargasso Sea L. bengalensis is not among the 20
most abundant hyperiid species (GASCA, 2007). This
species is reported to display a wide range of variation in
terms of morphological characteristics (BOWMAN, 1973; VINOGRADOV et al., 1996).
In tropical regions, high concentrations of hyperiids rarely occur. However, even in the tropics their biomass
can reach 5 g.m-3 in isolated swarms of Anchylomera,
Phronima or Primno (VINOGRADOV; RUDJAKOV, 1971). BRUSCA (1981) referred to some records of
Anchylomera blossevillei of Washington in his revision
of the northeast Paciic hyperiids, while Phrosina semilunata was found exclusively in Californian waters.
Of Baja California they were associated with oligotrophic waters during the winter of 2005 (LAVANIEGOS; HEREU, 2009).
The diversity of tropical hyperiids is high, although precise data on species compositions and geographic
variability are still scarce. This lack of information may
result from long-standing poor taxonomy in a number of families (e. g., Hyperiidae, Phronimidae and some others)
and the diiculty of assessing faunal distributions based on small standard plankton nets (VINOGRADOV, 2005).
Spatial distribution
The highest hyperiid abundance in the oceanic area
close to the Saint Peter and Saint Paul Archipelagos was possibly a consequence of high food availability
as high chlorophyll concentrations, as well as highest
abundances total zooplankton community, were found in this area. According to SOUZA et al. (2013), these higher
concentrations were due to the general hydrographic
regime and the weak upwelling caused by the efects of
topographical features.
Several studies undertaken in eastern Brazilian waters on the distribution of zooplankton (VANNUCCI, 1957; VALENTIN, 1984) indicated an impact from upwelling on the plankton distribution. GASCA (2003) found that the upwelling was the mesoscale feature that most afected the structure of the hyperiid community in the southern Gulf of Mexico. WILSON et al. (2003) obtained similar results
in Australian waters; they attributed the main changes in the macrozooplankton assemblages to the diferent efects of the upwelling and downwelling. LAVANIEGOS and HEREU (2009) studied Hyperiid amphipods of Baja California and showed that the California Current produces a secondary productive peak during autumn and
winter in the oceanic domain, while the main productive
Gulf of California, showed a strong bias towards neritic waters. LIMA and VALENTIN (2001) believed that this
species may be a more important component of the inshore
plankton than had previously been thought.
GASCA (2004) found that hyperiids were ive times
more abundant in neritic areas than in the oceanic waters
of the Gulf of Mexico. In this survey, overall neritic densities were greater than those in the oceanic zones. L. bengalensis dominated in both environments.
Although records of hyperiids in nearshore areas are
not uncommon, they are essentially pelagic animals; only
Lestrigonus bengalensis tends to inhabit coastal waters
(BOWMAN, 1973; VINOGRADOV et al., 1996).
Hyperiid spatial distribution is described as very
patchy (THURSTON, 1976; SCHULEMBERGER, 1977). The patchy zooplankton distribution may contribute to the variations found in density records. Low salinity, daytime sampling and low volumes of iltered sea water may also interfere with measured hyperiid densities (LIMA; VALENTIN, 2001). Many hyperiid species are distributed
in broad vertical ranges but are more abundant in the
upper layer during the night (MACQUART-MOULIN, 1993; VINOGRADOV et al., 1996).
According to LAVAL (1980), the biology and
probably part of the distributional patterns of the hyperiids
can be closely linked to the dynamics and behavior of the gelatinous zooplankton community (medusae,
siphonophores, salpae) with which they are associated.
Some hyperiid species, such as Phronima and Phronimella, depend on gelatinous substrates for extended maternal
care (AOKI et al., 2013). Other species like Hyperoche mediterrana (HOOGENBOOM; HENNEN, 1985), Vibilia armata and Lestrigonus schizogeneios (LAVAL,
1980) deposit embryos at variable stages of development
in a gelatinous host.
In general, each area around the seamounts and
islands of northeastern Brazil has diferent oceanographic
divided into cold-water and warm-water species. Warm-water hyperiid species may also have fairly broad ranges, covering not only tropical but also subtropical areas
(VINOGRADOV, 1999). Most warm-water hyperiids are
circumtropical. These include representatives of all hyperiid
families and practically all genera (except Cyllopus,
Hyperiella and probably some abyssal Physosomata).
Some families (mainly Oxycephalidae, Platyscelidae, Parascelidae, Lycaeopsidae and Anapronoidae but also Pronoidae, Brachyscelidae, Lycaeidae) are entirely warm-water based (VINOGRADOV, 2005).
In this study Lestrigonus bengalensis, Tetrathyrus
forcipatus and Anchylomera bessevillei were associated
with high salinity and high temperature, Primno
macropa, Paraphronima gracilis, Hyperietta vosseleri
and Lestrigonus latissimus showed a close relation
to low temperature and low salinity and Lestrigonus
macrophthalnus was associated with high chlorophyll
a and high organic weight. In the eastern Tropical
Paciic, GASCA et al. (2012) found a high dominance
of Hyperioides sibaginis and Lestrigonus bengalensis:
these species favoured the warm conditions associated with El Niño. However, high tolerance to changes in
hydrographic conditions was reported for L. bengalensis
in Queensland (ZEIDLER, 1984) and the Taiwan Strait (LIN; CHEN, 1988). For the three dominant amphipod
species (C. challengeri, P. abyssalis and T. paciica) in the
Oyashio region, the abundance and biomass peaks were in
the summer and reproduction occurred during spring and
summer (ABE et al., 2016).
Epipelagic species are more susceptible to changes in upper layer temperatures and are good indicators of water
advection (LAVANIEGOS, 2014). VALENCIA et al.
(2013) found diferent hyperiid assemblages in the Panama Bight, perhaps modulated by a combination of factors, including: suppressed upwelling, increased temperature
Present-day distributions of zooplankton are established over geological time and relect past dispersal
patterns as well as the physiological and ecological
requirements of the species. A wide variety of potential responses of diferent zooplankton taxa may be part of this complex pelagic community (GASCA et al., 2012).
Within the bounds of their geographical regions,
zooplanktons exhibit patchy distributions on a wide range
of space- and time-scales. Patchiness may result from responses to physical turbulence or mixing, or to chemical gradients, such as salinity changes. Patchiness may also result from interactions between prey and predators, or it
may relect other biological events, such as reproduction (LALLI; PARSONS, 1999)
The functional structure of the pelagic ecosystem is determined by physical, chemical and geological
factors and the associated biological responses (PLATT; SATHYENDRANATH, 1999). Our analysis provides
evidence that the local hyperiid community structure can be related to the topographical and hydrographical
features around seamounts and islands in the waters of the northeastern coast of Brazil.
ACKNOWLEDGEMENTS
The authors express their thanks to the Ministry of the
Environment, Direction of Hydrography and Navigation
and ANTARES oceanographical ship, for supporting this study though the REVIZEE program. This study was partly supported by CNPq (Conselho Nacional de Desenvolvimento Cientiico e Tecnológico) as part of the
post-doctoral scholarship.
REFERENCES
ABE, Y.; YAMADA, Y.; SAITO, R.; MATSUNO, K.; YAMAGUCHI, A.; KOMATSU, K.; IMAI, I. Short-term changes in abundance and population structure ofdominant pelagic amphipod species in the Oyashio region during the spring phytoplankton bloom. Reg. Stud. Mar. Sci., v. 3, p. 154-162, 2016.
AOKI, M. N.; MATSUMOTO-OHSHIMA, C.; HIROSE, E.; NISHIKAWA, J. Mother-young cohabitation in Phronimella elongata and Phronima spp. (Amphipoda, Hyperiidea, Phronimidae). J. Mar. Biol. Assoc. UK., v. 93, n. 6, p. 1553-1556, 2013.
ANTEZANA, T. Plankton of southern Chilean fjords: trends and linkages. Sci. Mar., v. 63, Supl. 1, p. 69-80, 1999.
BOLTOVSKOY, D. Zooplankton of the South Atlantic Ocean. A taxonomic reference work with identiication guides and spatial distribution patterns. World Biodiversity Database Compact Disc Series. Expert Center for Taxonomic Identiication Bioinformatics, Multimedia Interactive Software.Amsterdam, 2005. DVD ROM.
BOWMAN, T. E. Pelagic amphipods of the genus Hyperia and closely related genera (Hyperiide: Hyperiidae). Smithson. Contrib. Zool., v. 136, p. 1-76, 1973.
BRANDINI, F. P. Hydrography and characteristics of the phytoplankton in shelf and oceanic waters of southeastern Brazil during winter (July/August 1982) and summer (February/March 1984). Hydrobiologia, v. 196, n. 2, p. 111-148, 1990.
BRINTON, E.; FLEMINGER, A.; SIEGEL-CAUSEY, S. The temperate and tropical planktonic biotas of the Gulf of California. Calif. Coop. Ocean. Fish. Invest. Rep., v. 27, p. 228-266, 1986. BRUSCA, G. J. Annotated keys to the Hyperiidea (Crustacea:
Amphipoda) of North American coastal waters. Los Angeles: Allan Hancock Foundation, 1981. 76 p.
DOWE, R. J.; FREELAND, H.; JUNIPER, K. A strong biological response to oceanic low past Cobb seamount. Deep-Sea Res. A. Oceanogr. Res. Pap., v. 39, n. 7-8, p. 1139-1145, 1992. GASCA, R.; SHIH, C. T. Hyperiid amphipods of surface waters
of the western Caribbean Sea (1991). Crustaceana, v. 74, n. 5,
p. 489-499, 2001.
GASCA, R. Hyperiids (Crustacea, Amphipoda) and spring mesoscale features in the Gulf of Mexico. Mar. Ecol., v. 24, n. 4, p. 303-317, 2003.
GASCA, R.; SUÁREZ-MORALES, E. Distribution and abundance of hyperiid amphipods (Crustacea: Peracarida) of the Mexican Caribbean Sea (August 1986). Caribb. J. Sci., v. 40, n. 1, p. 23-30, 2004.
GASCA, R. Distribution and abundance of hyperiid amphipods in relation to summer mesoscale features in the southern Gulf of Mexico. J. Plankton Res., v. 26, n. 9, p. 993-1003, 2004. GASCA, R. Hyperiid amphipods of the Sargasso Sea. Bull. Mar.
Sci., v. 81, n. 1, p. 115-125, 2007.
GASCA, R.; FRANCO-GORDO, C.; GODÍNEZ-DOMÍNGUEZ, E.; SUÁREZ-MORALES, E. Hyperiid amphipod community in the Eastern Tropical Paciic before, during, and after El Niño 1997-1998. Mar. Ecol. Prog. Ser., v. 455, p. 123-139, 2012. HAMAMÉ, M.; ANTEZANA, T. Chlorophyll and zooplankton in
microbasins along the Strait of the Magellan-Beagle Channel passage. Sci. Mar., v. 63, Supl. 1, p. 35-42, 1999.
HERNÁNDEZ-LEÓN, S. Accumulation of mesozooplankton in a wake area as a causative mechanism of the “island-mass efect”. Mar. Biol., v. 109, n. 1, p. 141-147, 1991.
HOOGENBOOM, J.; HENNEN, J. Étude sur les parasites dumacrozooplancton gélatineux dans la rade de Villefranche-sur-Mer (France), avec description des stades de développement de Hyperoche mediterranea Senna (Amphipoda, Hyperiidae). Crustaceana, v. 49, v. 1, p. 233-243, 1985.
LALLI, C. M.; PARSONS, T. R. Biological Oceanography: An introduction. 2nd ed. Burlington: Elsevier Butterworth-Heinemann, 1999.
LAVAL, P. Hyperiid amphipods as crustacean parasitoids associated with gelatinous zooplankton. Oceanogr. Mar. Biol. Ann. Rev., v. 18, p. 11-56, 1980.
MACQUART-MOULIN, C. Répartition verticale, migrations et stratiications supericielles desmysidacés et amphipodes pélagiques sur les marges mediterraneenne et atlantique françaises. J. Plankton Res., v. 15, n. 10, p. 1149-1170, 1993. MAZZOCCHI, M. G.; IANORA, A. A faunistic study of the copepod assemblages in the Strait of Magellan. Boll. Oceanol. Teor. Appl., v. 9, n. 2-3, p. 163-177, 1991.
METZLER, P. M.; GILBERT, P. M.; GAETA, A. S.; LUDLAM, J. M. New and regenerated production in the South Atlantic of Brazil. Deep Sea Res. Part 1. Oceanogr. Res. Pap., v. 44, n. 33, p. 363-384, 1997. Ludlam†
MONTÚ, M. Northern Brazilian pelagic amphipods, Suborder Hyperiidea (Crustacea). Nauplius, v. 2, n. 1, p. 131-134, 1994. MOUNY, P.; DAUVIN, J. C. Environmental control of mesozooplankton community structure in Seine estuary (English Channel). Oceanol. Acta, v. 25, n. 1, p. 13-22, 2002. NEUMANN-LEITÃO, S.; GUSMÃO, L. M.; SILVA, T.
A.; NASCIMENTO-VIEIRA, D. A.; SILVA, A. P. Mesozooplankton biomass and diversity in coastal and oceanic waters of Northeastern Brazil. Arch. Fish. Mar. Res., v. 47, n. 2-3, p. 153-165, 1999.
OMORI, M.; IKEDA, T. Methods in marine zooplankton ecology. Malabar: Krieger Publishing, 1992. 332 p.
PETERSON, R. G.; STRAMMA, L. Upper-level circulation in the South Atlantic Ocean. Prog. Oceanogr., v. 26, n. 1, p. 1-73, 1991.
PLATT, T.; SATHYENDRANATH, S. Spatial structure of pelagic ecosystem processes in the global ocean. Ecosystems, v. 2, n. 5, p. 384-394, 1999.
RICHARDSON, P. L.; MCKEE, T. K. Average Seasonal-Variation of the Atlantic Equatorial Currents From Historical Ship Drifts. J. Phys. Oceanogr., v. 14, p. 1226-1238, 1984. SHULENBERGER, E. Hyperiid amphipods from the zooplankton
community of the North Paciic central gyre. Mar. Biol., v. 42, n. 4, p. 375-385, 1977.
SOUZA, C. S.; LUZ, J. A. G.; MACEDO, S.; MONTES, M. J. F.; MAFALDA JR, P. O. Chlorophyll a and nutrient distribution around seamounts and islands of the tropical south-western Atlantic. Mar. Freshw. Res., v. 64, n. 2, p. 168-184, 2013. STRICKLAND, J. D. H.; PARSONS, T. R. A Practical Handbook
of Seawater Analyses. 2nd ed. Ottawa: Fisheries Research Board of Canada, 1972.
the SOND cruise, 1965. II. The Hyperiidea and general discussion. J. Mar. Biol. Assoc. UK, v. 56, p. 383-470, 1976. VALENCIA, B.; LAVANIEGOS, B. E.; GIRALDO, A.;
RODRÍGUEZ-RUBIO, E. Temporal and spatial variation of hyperiid amphipod assemblages in response to hydrographic processes in the Panama Bight, eastern tropical Paciic. Deep Sea Res. Part 1. Oceanogr. Res. Pap., v. 73, p. 46-61, 2013. VALENTIN, J. L. Analyse des paramètres hydrobiologiques dans
la remontée de Cabo Frio (Brésil). Mar. Biol., v. 82, n. 3, p. 259-276, 1984.
VANNUCCI, M. On Brazilian hydromedusae and their distribution in relation to diferent water masses. Bol. Inst. Oceanogr., v. 8, n. 1-2, p. 23-109, 1957.
VINOGRADOV, M. E.; RUDJAKOV, J. A. Diel changes in the vertical distribution of the replaced plankton volumes in the western equatorial Paciic. In: VINOGRADOV, M. E. (Ed.). Functioning of pelagic communities in the tropical regions of the ocean. Moscow: Nauka, 1971. p. 179-188.
VINOGRADOV, M. E.; VOLKOV, A.; SEMENOVA, T. N. Hyperiid Amphipods (Amphipoda, Hyperiidea) of the World Oceans. Washington: Smithsonian Institution Libraries, 1996.
VINOGRADOV, G. Amphipoda. In: BOLTOVSKOY, D. (Ed.). Zooplankton of the Southwestern Atlantic. Leiden: Backhuys Publishers, 1999. p. 1141-1240.
VINOGRADOV, G. Amphipoda. In: BOLTOVSKOY, D. (Ed.). Zooplankton of the South Atlantic Ocean: A taxonomic reference work with identiication guides and spatial distribution patterns. World Biodiversity Database Compact Disc Series. Expert Center for Taxonomic Identiication. Bioinformatics, Multimedia Interactive Software. Amsterdam, 2005. DVD ROM.
WILSON, S. G., CARLETON, J. H.; MEEKAN, M. G. Spatial and temporal patterns in the distribution and abundance of macrozooplankton on the southern North West Shelf, Western Australia. Estuar. Coast. Shelf Sci., v. 56, n. 5-6, p. 897-908, 2003.
ZEIDLER, W. Hyperiidea (Crustacea: Amphipoda) from Queensland Waters. Aust. J. Zool. Suppl. Ser., v. 59, p. 1-93, 1978.