A Computational Approach to Identifying
Gene-microRNA Modules in Cancer
Daeyong Jin1, Hyunju Lee1*
1School of Information and Communications, Gwangju Institute of Science and Technology, Gwangju, South Korea
Abstract
MicroRNAs (miRNAs) play key roles in the initiation and progression of various cancers by regulating genes. Regulatory interactions between genes and miRNAs are complex, as multiple miRNAs can regulate multiple genes. In addtion, these interactions vary from pa-tient to papa-tient and even among papa-tients with the same cancer type, as cancer development is a heterogeneous process. These relationships are more complicated because transcrip-tion factors and other regulatory molecules can also regulate miRNAs and genes. Hence, it is important to identify the complex relationships between genes and miRNAs in cancer.
In this study, we propose a computational approach to constructing modules that repre-sent these relationships by integrating the expression data of genes and miRNAs with gene-gene interaction data. First, we used a biclustering algorithm to construct modules consisting of a subset of genes and a subset of samples to incorporate the heterogeneity of cancer cells. Second, we combined gene-gene interactions to include genes that play im-portant roles in cancer-related pathways. Then, we selected miRNAs that are closely asso-ciated with genes in the modules based on a Gaussian Bayesian network and Bayesian Information Criteria. When we applied our approach to ovarian cancer and glioblastoma (GBM) data sets, 33 and 54 modules were constructed, respectively. In these modules, 91% and 94% of ovarian cancer and GBM modules, respectively, were explained either by direct regulation between genes and miRNAs or by indirect relationships via transcription factors. In addition, 48.4% and 74.0% of modules from ovarian cancer and GBM, respec-tively, were enriched with cancer-related pathways, and 51.7% and 71.7% of miRNAs in modules were ovarian cancer-related miRNAs and GBM-related miRNAs, respectively. Fi-nally, we extensively analyzed significant modules and showed that most genes in these modules were related to ovarian cancer and GBM.
Author Summary
A microRNA (miRNA) is a small RNA molecule that regulates the expression of mRNA genes. A miRNA can regulate multiple genes, and a gene can be regulated by multiple miRNAs. The regulation of genes by miRNAs may vary from patient to patient, even if they suffer from the same type of cancer. In this study, we identify the relationships a11111
OPEN ACCESS
Citation:Jin D, Lee H (2015) A Computational Ap-proach to Identifying Gene-microRNA Modules in Cancer. PLoS Comput Biol 11(1): e1004042. doi:10.1371/journal.pcbi.1004042
Editor:Isidore Rigoutsos, Thomas Jefferson Univer-sity, UNITED STATES
Received:February 6, 2014
Accepted:November 16, 2014
Published:January 22, 2015
Copyright:© 2015 Jin, Lee. This is an open access article distributed under the terms of theCreative Commons Attribution License, which permits unre-stricted use, distribution, and reproduction in any me-dium, provided the original author and source are credited.
Funding:This research was supported by Basic Sci-ence Research Program through the National Re-search Foundation of Korea (NRF) funded by the Ministry of Education (NRF-2013R1A1A2058053), and the Bio-Synergy Research Project (NRF-2013M3A9C4078138) of the Ministry of Science, ICT and Future Planning through the National Research Foundation. The funders had no role in study design, data collection and analysis, decision to publish, or preparation of the manuscript.
between genes and miRNAs in cancer patients using expression data. Because these rela-tionships are complicated by the involvement of transcription factors, which are among the most influential regulators of genes, we also attempt to explain the triple relationship among genes, miRNAs, and transcription factors. We constructed modules consisting of a set of genes and miRNAs, in which the expression levels are highly correlated. In most of these modules, genes and miRNAs are related to specific cancer types; their relationships are explained both by direct regulation of genes by miRNAs and by indirect relationships via transcription factors.
Introduction
Cancer is one of the leading causes of death worldwide. Although remarkable progress has been achieved in cancer therapies, the molecular mechanisms of cancer have not yet been fully identified. Among various regulations of cancer-related genes and pathways in several stages, the regulation of genes by microRNAs (miRNAs) in cancer cells has drawn particular atten-tion, because many miRNAs are located in chromosomal regions that are frequently altered in cancer [1]. MiRNAs are small RNAs, known as important regulators of genes through binding to 3’UTR regions of target genes [2]. In many cancer types, miRNAs have been studied as im-portant biomarkers for diagnosis and prognosis of cancer, as many miRNAs function as onco-genes or tumor suppressors by regulating other oncoonco-genes or tumor suppressor onco-genes [1,3].
Because miRNAs regulate genes by binding to the 3’UTR regions of genes, many methods were developed to identify conserved sequence regions between miRNAs and mRNAs [4]. However, sequence-based approaches generate many false positive bindings sites and cannot identify functional changes of genes. Hence, the expressions of genes and miRNAs were also integrated to address possible negative correlations between the two sets of expression data [5,
6]. With the advances in high throughput technologies, large-scale mRNA expression and miRNA expression data sets from the same tumor samples have become available, due to col-laborative efforts such as The Cancer Genome Atlas (TCGA) project. [7,8]. These data sets en-able researchers to apply computational approaches to identify relationships between mRNAs and miRNAs and help understand their effects in cancer.
Another important approach to understanding relationships between mRNAs and miRNAs is to analyze multiple genes and miRNAs simultaneously by constructing modules of them rather than analyzing each gene-miRNA pair separately [5,9,10]. It is widely known that a miRNA can regulate multiple genes [11], and a gene can be targeted by multiple miRNAs [12]. Changes in these numerous relationships can significantly alter the biological functions or sig-naling pathways associated with a specific cancer [13]. Although it is known that several path-ways, such as the p53 and TGF-beta signaling pathpath-ways, are related to ovarian cancer [14,15], the functions of miRNAs in these pathways have not yet been fully explained.
Relationships between genes and miRNAs become even more complicated because mole-cules such as transcription factors or signal transducers regulate genes and miRNAs. For exam-ple, p53, the most frequently mutated gene in cancer, regulates hundreds of genes and a set of miRNAs, including miR-24 family, miR-145, miR-107, and miR-192 [17,18]. In [19], the au-thors constructed modules that contain highly correlated genes and miRNAs in their expres-sion levels and found that miR-200a regulates the transcription factor ZEB1, which regulates genes contained in the same module as miR-200a.
To enhance the understanding of relationships between genes and miRNAs, we propose a framework that combines a biclustering approach and a Gaussian Bayesian network. Using the biclustering approach, gene-sample modules are first constructed based on gene expression and gene-gene interaction data sets. Here, a subset of genes that are correlated with each other in a subset of samples is clustered, because gene aberrations are different among patients, even if cancer occurs in the same organ or tissue type [20]. Next, using a Gaussian Bayesian network, gene-miRNA modules are constructed to identify miRNAs that regulate genes in gene-sample modules. Here, we use the expression data on genes and miRNA. When we applied our ap-proach to ovarian cancer data sets and glioblastoma (GBM) data sets from TCGA, we identi-fied several modules consisting of genes and miRNAs related to ovarian cancer and GBM. In many modules, relationships between genes and miRNAs were explained either by direct regu-lations of genes by miRNAs or by indirect reregu-lationships via transcription factors. In addition, functional pathway enrichment tests using several biological and signaling pathways demon-strated that these modules were biologically coherent. Based on ratios of cancer-related genes and cancer-related miRNAs, we extensively analyzed several significant modules and per-formed network analyses of these modules to demonstrate the regulation of genes by miRNAs.
Materials and Methods
Materials
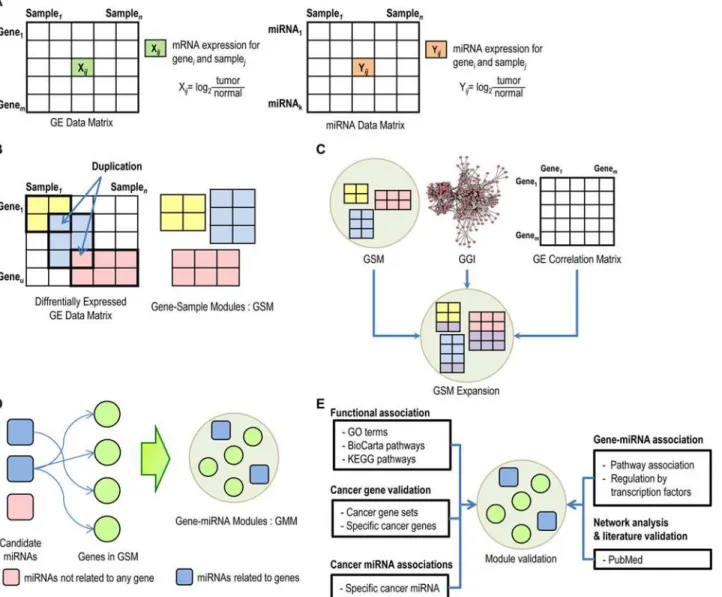
Ovarian cancer. We collected mRNA expression and miRNA expression data sets for 587 tumor samples and 8 unmatched normal samples for ovarian cancer from TCGA [8]; mRNA and miRNA expression data were generated using an Affymetrix HG-U133A microarray and an Agilent H-miRNA_8X15K microarray, respectively. We normalized the expression levels of 12,042 genes using log2 ratios between tumor samples and the average of normal samples for each gene, and then selected 2,933 differentially expressed genes using at-test (p-value<0.001). Similarly, we normalized the expression levels of 479 miRNAs using the log2 ratios between tumor samples and the average of normal samples for each miRNA (Fig. 1 (A)).
Glioblastoma. We collected mRNA expression and miRNA expression data sets for 482 tumor samples and 10 unmatched normal samples for GBM [7]. These data sets were
generated using the same microarray platforms used in the ovarian cancer study. After normal-ization, we selected 4,059 differentially expressed genes using at-test (Bonferroni corrected
p-value<0.05). We used the expression levels of 423 miRNAs normalized using normal
samples.
Selecting a p-value threshold for a t-test. The degree of expression changes depending on the cancer type. In this study, the number of differentially expressed genes was small in ovarian cancer compared to GBM. Hence, we used a less strict threshold for ovarian cancer.
Gene-gene interactions. We collected gene-gene interaction data from the HPRD database [21].
Constructing gene-sample modules
might be related to similar functions or pathways in the development of cancer. We also hy-pothesized that a gene might have multiple functions and could function in several pathways. To incorporate these hypotheses, we use a biclustering algorithm to allow the duplication of genes and samples in multiple clusters. First, we construct a matrix of differentially expressed genes and samples, and then we normalize the expression values for each gene using a z-score to determine the tendency toward changes of gene expression in the samples. Next, we apply a SAMBA biclustering algorithm [22] to the normalized matrix to construct modules in which genes and samples are highly correlated (Fig. 1 (B)). The SAMBA biclustering algorithm mod-els gene expression data in a bipartite graphG= (U,V,E), where genes inVare represented as nodes on one side and samples inUon the other side. There is an edge inEbetween a genevin Figure 1. Overview of the proposed approach.(A) Collect gene expression and miRNA expression data sets from paired tumor samples, and calculate log2 ratios between tumor samples and normal samples. (B) Construct gene-sample modules (GSM) from a differentially expressed gene expression matrix using a biclustering algorithm, which allows duplications of genes and samples in multiple modules. (C) Add genes to GSM using gene-gene interactions, if the included genes increase the average PCC values among genes in the module. (D) Construct gene-miRNA modules (GMM) by selecting gene-regulating miRNAs in GSM. Use a Gaussian Bayesian network and the BIC score to evaluate the relationship between genes and miRNAs. (E) To determine the functional relevance of the modules, test whether the genes from the modules are enriched for specific biological functions or signaling pathways. To validate that modules are related to a specific cancer, check that the genes and miRNAs are related to the specific cancer.
Vand a sampleuinUif the expression value of genevchanges significantly in sampleu, hav-ing high absolute expression values. The biclusterhav-ing algorithm generates subgraphs from the bipartite graph, in which most of the genes are connected to most of the samples as edges. These subgraphs represent highly correlated gene-sample clusters, where the tendency toward gene expression changes is similar for a subset of samples. Additional details are provided in
Fig. S1. We calculate the statistical significance of each module based on a null hypothesis that the expression level of a gene is independent of the expression level of other genes for samples in a module, assessing that the average Pearson correlation coefficients (PCCs) of gene expres-sion levels for genes in the module are higher than the ones from random modules for selected samples. For each module, we conduct the following test.
(Step 1)Construct a random module by randomly selecting the same numbers of genes and samples from the normalized matrix.
(Step 2)Calculate the PCC matrix of expression level values of genes in the module across a subset of samples. Then, calculate the average value of the PCC matrix, excluding diagonal elements.
(Step 3)Repeat Steps 1 and 2Ntimes, letting the average value from thei-th permutation serve as the randomavg(i).
(Step 4)Let the average PCC value of genes in the observed module be the moduleavg.
(Step 5)Calculate thep-value of the observed module using the following equation, where I is an indicator function.
p value¼
PN
i¼1Iðmoduleavg<randomavgðiÞÞ
N
When we calculate thep-value, we try to take into account that observed modules are not inde-pendent of each other as genes overlap among modules. Hence, we construct random modules where genes in the modules share the same overlap ratio as the observed modules.
Recent research has shown that not all of the genes in cancer-related pathways undergo ex-pression or genomic changes [23]. Consequently, certain genes that play important roles in cancer-related pathways might not be differentially expressed. To include functionally related genes in the gene-sample modules, we expand the gene-sample modules using a gene-gene in-teraction network. If a gene interacts directly with at least one gene in a module, then this gene can be regarded as a candidate gene for the module. For each module, we collect candidate genes and calculate the average PCC values of expressions between a candidate gene and the genes in the module. We add candidate genes to the module in descending order from the gene having the highest PCC value until the average PCC values of the expressions of genes in the module do not increase.
Constructing gene-miRNA modules
is represented by a Gaussian Bayesian network. IfXiis normally distributed around a mean that linearly depends on its parents, then the conditional probability ofXigiven its parents PaG(Xi) = {Yj,. . .Yk} can be represented by
PðXijPa GðX
iÞÞ ¼PðXijYj;. . .;YkÞ Nða0þ
X
j0
aj0Yj0;s2Þ ð1Þ
Then, the likelihood ofXandYcan be represented by
LðX;YÞ ¼PðX1;X2;. . .;Xn;Y1;Y2;. . .YmÞ ¼
Yn
i¼1
PðXijPa GðX
iÞÞ ð2Þ
To determine which sets of miRNAs explain the expression levels of genes in gene-sample modules, we use a Bayesian information criterion (BIC) as a measure for determining a Bayes-ian network structure between genes and miRNAs, which can be represented by
BIC¼logðLÞ logM
2 þOð1Þ; ð3Þ
whereMis the sum of the number of genes and miRNAs. To determine the parentsPaG(Xi) of a geneXiyielding the optimal BIC score, we should consider all combinations of miRNAs; however, this approach is highly time-consuming. To reduce the search space, we select candi-date miRNAs whose average of absolute Spearman’s rank correlation coefficient (SCC) values for genes in a given module are within the topT% among all miRNAs. Note that we use SCC values for selecting candidate miRNAs to reduce the effects of possible outliers in the PCC. From candidate miRNAs, wefirst add a miRNA with the highest SCC value as a regulator and calculate the BIC score. Then, we add miRNAs with the next highest SCC values, until adding more miRNAs no longer improves the BIC score. After adding miRNAs to gene-sample mod-ules using the above approach, modmod-ules with fewer than two miRNAs arefiltered out because these modules cannot represent the combinatorial effects of genes and miRNAs. Finally, gene-miRNA modules are obtained.
Module validation
To validate the relationships between genes and miRNAs in the modules, we consider four cases of gene regulations. In the first case, genes are directly bound and regulated by miRNAs. To validate this case, we select gene-miRNA pairs from miRTarbase [25] and MicroCosm (http://www.ebi.ac.uk/enright-srv/microcosm/htdocs/targets/v5/). Interacting pairs in miR-Tarbase are validated by various molecular experiments. Among them, reporter assays and western blot analysis confirm direct interactions. We compare the gene-miRNA pairs in our modules with these direct interactions in miRTarbase. MicroCosm provides computationally predicted binding sites for miRNAs in genomic sequences. Among these pairs, we select only gene-miRNA pairs with a negative correlation in expression values. From this process, we col-lect target genes for each miRNA, which we use for validation. Then, we perform a hypergeo-metric test for each miRNA in the modules to check for enrichment of genes in a module against the target genes of a miRNA.
regulated by TFs or TFs are regulated by miRNAs. In the second case, we consider a relation-ship in which the miRNAs in a module regulate TFs, and these TFs regulate genes in the mod-ule. Here, it is not necessary that TFs be members of the modmod-ule. We identify relationships between TFs and genes using the ChIP-X database [26]. For each TF in the database, we per-form a hypergeometric test to determine if there is enrichment of genes in a module against the target genes of the TF. Here, the correlation of expression values between the miRNA and the TF must be negative, and the correlation values between the TF and the mRNA can be either positive or negative.
In the third case, genes and miRNAs are regulated by a common TF. In this case, correla-tions of expression values between gene-TF and miRNA-TF should be both positive or both negative.
In the fourth case, interacting pairs in miRTarbase [25], experimentally validated by the coexpression of miRNA and mRNA, are used to validate gene-miRNA pairs in our module. Molecular experiments for this case include quantitative real-time PCR (qPCR), microarrays, stable isotope labeling with amino acids in culture (SILAC) and pulsed SILAC.
To determine the functional relevance of the modules, we test whether the genes from the modules are enriched for specific biological functions or signaling pathways. We perform a pathway enrichment test using gene ontology (GO) biological process terms [27], KEGG path-ways [28], and BioCarta pathways (http://www.biocarta.com). First, we download these path-ways from GSEA (http://www.broadinstitute.org/gsea) and apply a hypergeometric test to each module, obtaining thep-values. We exclude biological functions or signaling pathways con-taining more than 300 genes, as such functions are too general. SupplementaryFig. S2shows the distribution of GO biological functions as well as KEGG and BioCarta pathways. It can be seen that 51 of 825 GO terms contain more than 300 genes. To address any issues with multiple comparisons, we compute theq-values from thep-values based on a Benjamini & Hochberg correction. Then, we use aq-value<0.05 for the enrichment threshold.
To validate that modules are related to the specific cancer, we first examine whether en-riched pathways are related to the cancer being evaluated. For this task, we collect 2,032 cancer genes from the allOnco database (http://www.bushmanlab.org/links/genelists), which is a col-lection of list of cancer genes from several databases [29–32], 379 ovarian cancer genes from the Dragon Database for Exploration of Ovarian Cancer Genes (DDOC [33]), and 98 GBM genes from the literature ([34,35]). Then, we calculate the ratios of these cancer genes in the modules. We also collect 100 ovarian cancer miRNAs and 92 GBM miRNAs from the Human miRNA & Disease Database (HMDD [36]). Then, we calculate the ratios of ovarian cancer-re-lated miRNAs in the modules.
Associating modules with cancer subtype
Genes involved in the development of cancer vary depending on cancer subtypes. In several pa-pers [8,37–39], the expression levels of marker genes are used to determine the subtype. For example, GBM samples were classified as a proneural subtype if marker genes DLL3, NKX2–2, SOX2, ERBB3, and OLIG2 were overexpressed [8]. Similarly, we check whether modules iden-tified by our approach are related to a specific subtype of cancers using marker genes.
compare the expression levels of the marker genes of samples in a module to the expression lev-els of samples in the other subtype clusters using thet-test. If thep-values of markers genes of the subtype are significant, we consider the module to be related to the given subtype.
Results
Gene-Sample modules for ovarian cancer and GBM
To construct gene-sample modules, we applied the SAMBA biclustering algorithm to the gene expression matrix, allowing duplication of genes and samples in modules using an overlap fac-tor of 0.5 in [0, 1], where 1 represents non-overlap. For ovarian cancer and GBM, we identified 90 and 135 modules, respectively, that represent similar tendencies of gene expression changes for a subset of samples. After performing 1000 permutation tests, we selected 58 and 88 mod-ules with aq-value<0.05 for ovarian cancer and GBM, respectively. Then, we enlarged these
modules by adding genes using gene-gene interactions. On average, we added 15 and 33 genes to each module for ovarian cancer and GBM, respectively.
Gene-miRNA modules for ovarian cancer and GBM
We constructed gene-miRNA modules from gene-sample modules by including miRNAs. As described in the Methods section, we pre-selected the candidate miRNAs based on the SCC val-ues between the genes and the miRNAs and then added miRNAs to the module, which in-creased the BIC score. As shown inFig. 2, we applied 20 different SCC thresholds (T% in [1%, 20%] of candidate miRNAs among all miRNAs) to reduce the search space. InFig. 2 (A), the number of modules for ovarian cancer decreased as the thresholds decreased. We observed similar trends when the PCC was used instead of the SCC or when we did not integrate the gene-gene interaction data.Fig. 2also shows that the ratios of cancer genes, ovarian cancer genes, and ovarian cancer miRNAs were similar for various SCC thresholds>5%, and that these ratios increased when SCC thresholds decreased.Fig. S3shows similar results for GBM. Note that we filtered out modules with fewer than two miRNAs, as such modules cannot repre-sent the combinatorial effects of genes and miRNAs.
for all of the GBM modules. Based on the pathway enrichment test, 74.0% of the modules were enriched in biological functions or signaling pathways.
Because our approach includes genes belonging to multiple modules, we calculated the over-lap ratios of genes and miRNAs among the modules. The overover-lap ratio is defined asjm1\m2j/
jm1[m2j, wherem1andm2are the number of genes or miRNAs in module 1 and module 2,
Figure 2. Performance comparison of gene-miRNA modules for ovarian cancer.For ovarian cancer, we compared the performance of gene-miRNA modules generated from four cases: SCC with GGI information, SCC without GGI information, PCC with GGI information, and PCC without GGI information. For all cases, thex-axis presents different percentages of candidate miRNAs (T%) among all miRNAs when constructing gene-miRNA modules. For each case, the number of modules (A), the ratios of cancer genes (B), the ratios of ovarian cancer genes (C), the ratios of ovarian cancer miRNAs (D), the average number of enriched pathways (E), and the ratios of modules enriched with at least one pathway (F) are shown.
respectively. Figs.S4andS5show the overlap ratios among the modules. The average overlap ratios of genes were 1.6% and 2.0% for ovarian cancer and GBM, respectively, and the average overlap ratios of miRNAs were 7.3% and 14.2% for ovarian cancer and GBM, respectively. The overlap ratios of miRNAs are higher than the overlap ratio of genes, indicating that a miRNA regulates many genes involved in several pathways.
Relationship among genes, miRNAs and TFs in modules
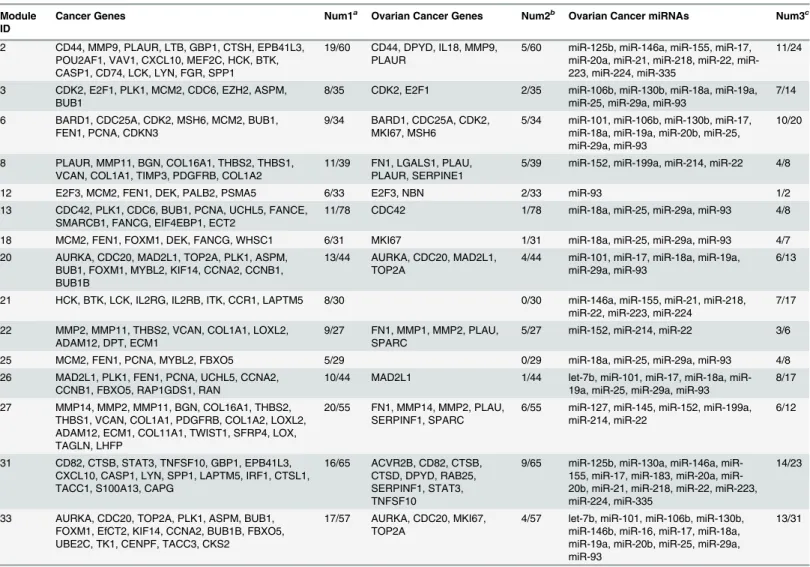
As described in the Methods section, we examined the direct relationships between genes and miRNAs and their indirect relationships through TFs in the identified modules, as well as ex-perimentally validated interactions between genes and miRNAs. For the ovarian cancer mod-ules, we tested the direct relationship based on whether potential targets of a miRNA in the module were enriched for the genes in the same module using MicroCosm.Table 2shows 8 miRNAs and their target genes in 12 ovarian cancer modules. For example, inTable 2, let-7b Table 1. Cancer genes, ovarian cancer genes and ovarian cancer miRNAs for selected modules.
Module ID
Cancer Genes Num1a
Ovarian Cancer Genes Num2b
Ovarian Cancer miRNAs Num3c
2 CD44, MMP9, PLAUR, LTB, GBP1, CTSH, EPB41L3,
POU2AF1, VAV1, CXCL10, MEF2C, HCK, BTK, CASP1, CD74, LCK, LYN, FGR, SPP1
19/60 CD44, DPYD, IL18, MMP9,
PLAUR
5/60 miR-125b, miR-146a, miR-155, miR-17,
20a, 21, 218, 22, miR-223, miR-224, miR-335
11/24
3 CDK2, E2F1, PLK1, MCM2, CDC6, EZH2, ASPM,
BUB1
8/35 CDK2, E2F1 2/35 miR-106b, miR-130b, miR-18a, miR-19a,
miR-25, miR-29a, miR-93
7/14
6 BARD1, CDC25A, CDK2, MSH6, MCM2, BUB1,
FEN1, PCNA, CDKN3
9/34 BARD1, CDC25A, CDK2,
MKI67, MSH6
5/34 miR-101, miR-106b, miR-130b, miR-17,
miR-18a, miR-19a, miR-20b, miR-25, miR-29a, miR-93
10/20
8 PLAUR, MMP11, BGN, COL16A1, THBS2, THBS1,
VCAN, COL1A1, TIMP3, PDGFRB, COL1A2
11/39 FN1, LGALS1, PLAU,
PLAUR, SERPINE1
5/39 miR-152, miR-199a, miR-214, miR-22 4/8
12 E2F3, MCM2, FEN1, DEK, PALB2, PSMA5 6/33 E2F3, NBN 2/33 miR-93 1/2
13 CDC42, PLK1, CDC6, BUB1, PCNA, UCHL5, FANCE,
SMARCB1, FANCG, EIF4EBP1, ECT2
11/78 CDC42 1/78 miR-18a, miR-25, miR-29a, miR-93 4/8
18 MCM2, FEN1, FOXM1, DEK, FANCG, WHSC1 6/31 MKI67 1/31 miR-18a, miR-25, miR-29a, miR-93 4/7
20 AURKA, CDC20, MAD2L1, TOP2A, PLK1, ASPM,
BUB1, FOXM1, MYBL2, KIF14, CCNA2, CCNB1, BUB1B
13/44 AURKA, CDC20, MAD2L1,
TOP2A
4/44 miR-101, miR-17, miR-18a, miR-19a,
miR-29a, miR-93
6/13
21 HCK, BTK, LCK, IL2RG, IL2RB, ITK, CCR1, LAPTM5 8/30 0/30 miR-146a, miR-155, miR-21, miR-218,
miR-22, miR-223, miR-224
7/17
22 MMP2, MMP11, THBS2, VCAN, COL1A1, LOXL2,
ADAM12, DPT, ECM1
9/27 FN1, MMP1, MMP2, PLAU,
SPARC
5/27 miR-152, miR-214, miR-22 3/6
25 MCM2, FEN1, PCNA, MYBL2, FBXO5 5/29 0/29 miR-18a, miR-25, miR-29a, miR-93 4/8
26 MAD2L1, PLK1, FEN1, PCNA, UCHL5, CCNA2,
CCNB1, FBXO5, RAP1GDS1, RAN
10/44 MAD2L1 1/44 let-7b, 101, 17, 18a,
miR-19a, miR-25, miR-29a, miR-93
8/17
27 MMP14, MMP2, MMP11, BGN, COL16A1, THBS2,
THBS1, VCAN, COL1A1, PDGFRB, COL1A2, LOXL2, ADAM12, ECM1, COL11A1, TWIST1, SFRP4, LOX, TAGLN, LHFP
20/55 FN1, MMP14, MMP2, PLAU,
SERPINF1, SPARC
6/55 miR-127, miR-145, miR-152, miR-199a,
miR-214, miR-22
6/12
31 CD82, CTSB, STAT3, TNFSF10, GBP1, EPB41L3,
CXCL10, CASP1, LYN, SPP1, LAPTM5, IRF1, CTSL1, TACC1, S100A13, CAPG
16/65 ACVR2B, CD82, CTSB,
CTSD, DPYD, RAB25, SERPINF1, STAT3, TNFSF10
9/65 125b, 130a, 146a,
155, 17, 183, 20a, miR-20b, miR-21, miR-218, miR-22, miR-223, miR-224, miR-335
14/23
33 AURKA, CDC20, TOP2A, PLK1, ASPM, BUB1,
FOXM1, EfCT2, KIF14, CCNA2, BUB1B, FBXO5, UBE2C, TK1, CENPF, TACC3, CKS2
17/57 AURKA, CDC20, MKI67,
TOP2A
4/57 let-7b, miR-101, miR-106b, miR-130b,
miR-146b, miR-16, miR-17, miR-18a, miR-19a, miR-20b, miR-25, miR-29a, miR-93
13/31
a
Num1 represents the number of cancer genes / the number of all genes in a module, b
Num2 the number of ovarian cancer genes / the number of all genes in a module, and c
Num3 the number of ovarian cancer miRNAs / the number of all miRNAs in a module.
may directly regulate several genes (ESPL1, DEPDC1, BUB1B, AURKB and UBE2C) in module 33. Additionally, 19 gene-miRNA direct interaction pairs that were experimentally confirmed in miRTarbase are shown inTable 3. Previously, it was confirmed using a luciferase reporter assay and the western blot method that miR-93 targets E2F1. Also, it was confirmed using a lu-ciferase reporter assay that miR-125b targets BCL3 in ovarian cancer cell [41]. All 156 gene-miRNA interaction pairs experimentally validated in miRTarbase are shown inTable S7, which includes both direct and coexpression based interactions.
Table S8shows the indirect relationships in 19 ovarian cancer modules, where genes and miRNAs are co-regulated by the same TF. Note that some TFs are not members of the mod-ules. Regulation of miRNAs by TFs is validated by literature evidence (PubMed IDs are shown in the table), and the significance of the regulations of the genes in the modules by TFs was demonstrated usingp-values that were obtained based on the ChIP-X database [26]. In many modules, one TF regulates multiple miRNAs and multiple genes. For example,Fig. 3 (A)shows ovarian cancer module 22, in which the TF EGR1 positively regulates several genes (AEBP1, COL1A1, COL5A1, COL5A3, COL6A1, ITGA5, LOXL2, MMP11, MMP2 and THBS2) and miRNAs (miR-214 and miR-152).Fig. 3 (B)shows ovarian cancer module 8, in which EGR1 positively regulates several genes (AQP1, BGN, CALB2, CEND1, COL1A1, COMP, HNT, IRX5, ITGA5 and ITGB1) and miRNAs (miR-214, miR-152, miR-199a and miR-199b) in the module at the same time. In both cases, we can infer that the genes and miRNAs are indirectly related via EGR1.
Table S9shows another type of indirect relationship in ovarian cancer, where miRNAs regu-late TFs, and the TFs reguregu-late genes in 14 ovarian cancer modules. Regulation of TFs by miR-NAs was found in the literature, and is shown in the third column of the table. One example of this relationship is shown inFig. 3 (C): let-7b directly regulates the TF BACH1, and BACH1 regulates several genes (BUB1, CCNA2, CENPF, MCM10, BIRC5, TK1, OIP5, KIF11, RRM2 and CENPA); miR-156b and let-7b regulate the TF E2F1, which regulates several genes and Table 2. miRNAs regulate genes in ovarian cancer modules.
Module ID miRNA ma
kb
xc p
-valued
Genes
2 miR-185 757 60 9 1.21E-02 RASSF4,CTSH,POU2AF1,PSCD4,AIM2,LCK
3 miR-7 997 35 7 2.26E-02 BUB1,ASPM,SEC61A2,CDK2,COQ7,SYT17
6 miR-7 997 34 7 1.94E-02 BUB1,POLE2,KIF23,CDK2,MCM6
7 miR-331 892 25 5 3.38E-02 PYCRL,SHARPIN,PLEC1
13 miR-7 997 78 12 2.60E-02 BUB1,POLE2,MCM6,BXDC2,RBBP9,SMARCB1,GAD1
15 miR-9 863 35 6 3.62E-02 MXD3,C6orf134,DDX25
15 miR-29b 1266 35 9 8.60E-03 DNAH7,COL4A6,DDX25
17 miR-29a 1038 29 7 1.00E-02 MYBL2,TDG,PPIE,MSH2
17 miR-29b 1266 29 7 2.75E-02 TIMELESS,TDG,FAF1
25 miR-7 997 29 8 1.91E-03 FBXO5,POLE2,KIF23,MCM6
26 miR-29b 1266 44 10 1.41E-02 CHEK1,TIMELESS,RIT1,DYNLT1
29 miR-93 946 23 5 3.03E-02 CDCA8,MED8,RLF
30 let-7b 1050 26 6 2.19E-02 EHMT2,RNF5,RGL2
33 let-7b 1050 57 11 9.28E-03 ESPL1,DEPDC1,BUB1B,UBE2C,AURKB
a m, b
k, and c
x represent the number of genes regulated by the miRNA collected from MicroCosm, the number of genes in the module, and the number of genes regulated by the miRNA in the module, respectively. The significant numbers of genes in each module are regulated by the miRNA, and the significances are shown in
d
p-value.
other miRNAs in the modules; and miR-101, miR-29a, miR-29b and miR-29c regulate the TF MYCN, which regulates genes in the module. This module is related to ovarian cancer-related pathways such as those involved in mitosis and the cell cycle.
Similarly, relationships among genes, miRNAs, and TFs in GBM modules are shown in
Fig. 4and in TablesS10,S11, andS12.Table S10shows 8 miRNAs and their target genes in 12 GBM modules. Genes targeted by miRNAs were highly enriched in these modules. In addition, TablesS11andS12show indirect relationships between genes and miRNAs through TFs.
Fig. 4 (A)shows one example of an indirect relationship in GBM module 11, where even though genes might not be directly regulated by miRNAs, they are indirectly related via two TFs: RUNX1 and TCF4. For ease of reference, the genes in module 11 were divided into three groups (GA,GBandGC): the TF RUNX1 positively regulates miR-221, miR-222, and genes in GAandGB; miR-155 negatively regulates the TF TCF4; and TCF4 positively regulates genes in GBandGC. Similarly,Fig. 4 (B)shows that miR-29a regulates the TF MYCN, which regulates several genes and miR-93 in GBM module 5. Experimentally validated 438 gene-miRNA inter-actions from the miRTarbase are shown inTable S13, including 112 direct interactions. In ad-dition, we verified in the literature that miR-21 interacts with BMPR2 and miR-222 interacts with ICAM1 in GBM cell [42].
Fig. S6summarizes these direct and indirect relationships in the ovarian cancer and GBM modules. These analyses show that, in total, 91% (30 out of 33) of ovarian cancer modules and 94% (51 out of 54) of GBM modules can be explained by direct regulations or indirect relation-ships, which allows us to understand how genes are regulated in modules.
Pathway enrichment tests and network analysis for ovarian cancer
To determine the functional relevance of modules identified in ovarian cancer, we performed pathway enrichment tests for GO biological processes, KEGG pathways, and BioCarta Table 3. Experimentally validated gene-miRNA interactions with strong evidence from miRTarbase in ovarian cancer modules.
Module ID Gene miRNA Validation Method PubMed ID
2 EPB41L3 miR-223 Luciferase reporter assay, Western blot 21628394
2 MEF2C miR-223 Luciferase reporter assay 18278031
2 MEF2C miR-21 Immunofluorescence, In situ hybridization, Luciferase reporter assay 21170291
3 E2F1 miR-93 Luciferase reporter assay, Western blot 19486339
3 E2F1 miR-106b Luciferase reporter assay, Western blot 19486339
3 EZH2 miR-25 Luciferase reporter assay, qRT-PCR, Western blot 22399519
5 CREBZF miR-221 Reporter assay, Microarray 20018759
6 CCNE2 miR-26a Luciferase reporter assay, Western blot 19524505
13 CDC42 miR-29a Luciferase reporter assay, Western blot 19079265
14 BCL3 miR-125b Luciferase reporter assay 20658525
14 HK2 miR-125b Luciferase reporter assay, qRT-PCR 22593586
18 NASP miR-29a Luciferase reporter assay, Western blot 22080513
26 CCNA2 let-7b Immunoblot, Immunofluorescence, Luciferase reporter assay, qRT-PCR 18379589
27 TWIST1 miR-214 Luciferase reporter assay, qRT-PCR, Western blot 22540680
27 MMP14 miR-145 Reporter assay, Microarray 21351259
31 STAT3 miR-21 Western blot, Other 20048743
31 STAT3 miR-20b qRT-PCR, ELISA, ChIP, Western blot 20232316
31 EPB41L3 miR-223 Luciferase reporter assay, Western blot 21628394
31 TNFSF10 miR-222 Western blot 18246122
32 TOB1 miR-218 Luciferase reporter assay 23060446
33 CCNA2 let-7b Immunoblot, Immunofluorescence, Luciferase reporter assay, qRT-PCR 18379589
Figure 3. Regulations among genes, miRNAs, and TFs in ovarian cancer modules.For three ovarian cancer modules-22 (A), 8 (B), and 33 (C)-the expression values of genes, miRNAs, and TFs are shown. Arrows represent genes and miRNAs regulated by TFs or other miRNAs. Genes and miRNAs are members of each module, but TFs do not belong to the modules.
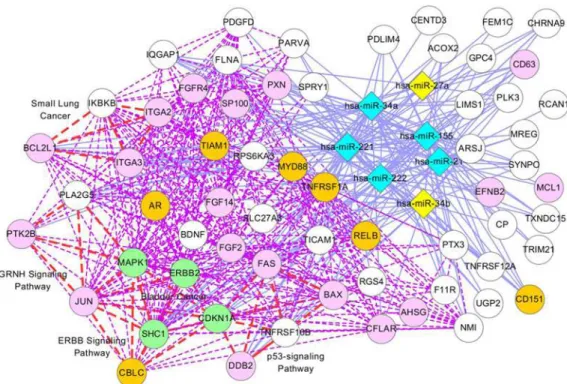
pathways. We found that 16 out of 33 modules (48.4%) were enriched in at least one function.
Table 4presents enriched functions or signaling pathways for selected modules. Several mod-ules have many enriched functions or pathways related to ovarian cancer, such as the p53 sig-naling pathway [43], ECM receptor interactions [44], and cell cycles [45]. TablesS14,S15, and
S16present lists of all enriched pathways. As mentioned previously, on average, 19.1% of genes in our modules were cancer genes and 5.7% were ovarian cancer genes. Our further manual lit-erature search revealed that most of the cancer genes in several modules are also ovarian can-cer-related genes, suggesting that cancer genes in the modules have a high potential to be ovarian cancer-related genes. In addition, most of the enriched modules had at least one ovari-an covari-ancer gene, supporting the idea that all enriched modules might be related to ovariovari-an covari-an- can-cer. Therefore, we extensively analyzed modules 22 and 8 because module 22 has a relatively high fraction of ovarian cancer genes (12.8%) and cancer genes (28.2%) and is enriched for im-portant pathways in ovarian cancer, and module 8 also contains a high fraction of ovarian can-cer genes (18.5%), cancan-cer genes (33.3%), and three enriched pathways related to ovarian cancer.
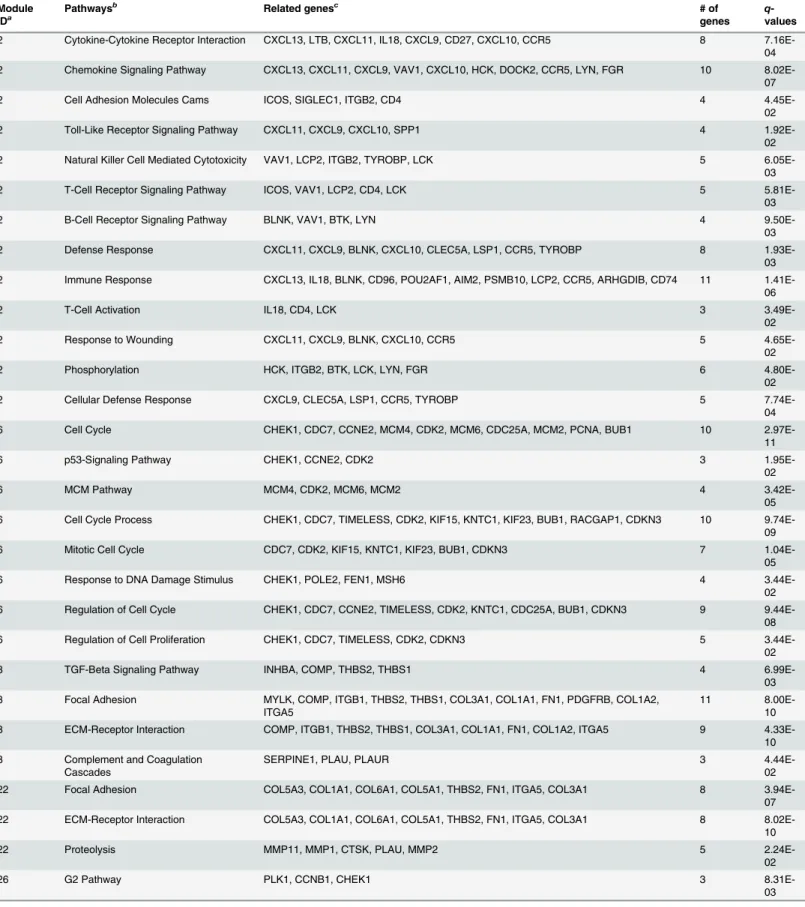
Fig. 5shows a network representation of module 22, where 25 genes (2 genes are not shown) and 6 miRNAs are presented as nodes. In this module, 5 genes (FN1, MMP2, MMP1, PLAU, and SPARC), colored in green, were identified as ovarian cancer-related genes in the DDOC database. Moreover, the literature showed that 14 genes (ITGA5, COL6A1, THBS2, COL1A1, MMP19, MMP11, CTSK, ECM1, GREM1, VCAN, LOXL2, ADAM12, FAP, and INHBA), colored in pink, are ovarian cancer genes (shown inTable S17) and that these genes have high-average SCC values with at least one miRNA colored in sky blue. Most of the genes enriched in ECM receptor interaction, focal adhesion and proteolysis pathways are green or pink nodes, suggesting that these pathways are closely related to ovarian cancer. The literature Figure 4. Regulations among genes, miRNAs, and TFs in GBM modules.For two GBM modules, 11 (A) and 5 (B), the expression values of genes, miRNAs, and TFs are shown. Arrows represent genes and miRNAs regulated by TFs or other miRNAs. Genes and miRNAs are members of each module, but TFs do not belong to the modules.
Table 4. Ovarian cancer modules with enriched pathways.
Module IDa
Pathwaysb
Related genesc
# of genes
q -values
2 Cytokine-Cytokine Receptor Interaction CXCL13, LTB, CXCL11, IL18, CXCL9, CD27, CXCL10, CCR5 8
7.16E-04
2 Chemokine Signaling Pathway CXCL13, CXCL11, CXCL9, VAV1, CXCL10, HCK, DOCK2, CCR5, LYN, FGR 10
8.02E-07
2 Cell Adhesion Molecules Cams ICOS, SIGLEC1, ITGB2, CD4 4
4.45E-02
2 Toll-Like Receptor Signaling Pathway CXCL11, CXCL9, CXCL10, SPP1 4
1.92E-02
2 Natural Killer Cell Mediated Cytotoxicity VAV1, LCP2, ITGB2, TYROBP, LCK 5
6.05E-03
2 T-Cell Receptor Signaling Pathway ICOS, VAV1, LCP2, CD4, LCK 5
5.81E-03
2 B-Cell Receptor Signaling Pathway BLNK, VAV1, BTK, LYN 4
9.50E-03
2 Defense Response CXCL11, CXCL9, BLNK, CXCL10, CLEC5A, LSP1, CCR5, TYROBP 8
1.93E-03
2 Immune Response CXCL13, IL18, BLNK, CD96, POU2AF1, AIM2, PSMB10, LCP2, CCR5, ARHGDIB, CD74 11
1.41E-06
2 T-Cell Activation IL18, CD4, LCK 3
3.49E-02
2 Response to Wounding CXCL11, CXCL9, BLNK, CXCL10, CCR5 5
4.65E-02
2 Phosphorylation HCK, ITGB2, BTK, LCK, LYN, FGR 6
4.80E-02
2 Cellular Defense Response CXCL9, CLEC5A, LSP1, CCR5, TYROBP 5
7.74E-04
6 Cell Cycle CHEK1, CDC7, CCNE2, MCM4, CDK2, MCM6, CDC25A, MCM2, PCNA, BUB1 10
2.97E-11
6 p53-Signaling Pathway CHEK1, CCNE2, CDK2 3
1.95E-02
6 MCM Pathway MCM4, CDK2, MCM6, MCM2 4
3.42E-05
6 Cell Cycle Process CHEK1, CDC7, TIMELESS, CDK2, KIF15, KNTC1, KIF23, BUB1, RACGAP1, CDKN3 10
9.74E-09
6 Mitotic Cell Cycle CDC7, CDK2, KIF15, KNTC1, KIF23, BUB1, CDKN3 7
1.04E-05
6 Response to DNA Damage Stimulus CHEK1, POLE2, FEN1, MSH6 4
3.44E-02
6 Regulation of Cell Cycle CHEK1, CDC7, CCNE2, TIMELESS, CDK2, KNTC1, CDC25A, BUB1, CDKN3 9
9.44E-08
6 Regulation of Cell Proliferation CHEK1, CDC7, TIMELESS, CDK2, CDKN3 5
3.44E-02
8 TGF-Beta Signaling Pathway INHBA, COMP, THBS2, THBS1 4
6.99E-03
8 Focal Adhesion MYLK, COMP, ITGB1, THBS2, THBS1, COL3A1, COL1A1, FN1, PDGFRB, COL1A2,
ITGA5
11
8.00E-10
8 ECM-Receptor Interaction COMP, ITGB1, THBS2, THBS1, COL3A1, COL1A1, FN1, COL1A2, ITGA5 9
4.33E-10
8 Complement and Coagulation
Cascades
SERPINE1, PLAU, PLAUR 3
4.44E-02
22 Focal Adhesion COL5A3, COL1A1, COL6A1, COL5A1, THBS2, FN1, ITGA5, COL3A1 8
3.94E-07
22 ECM-Receptor Interaction COL5A3, COL1A1, COL6A1, COL5A1, THBS2, FN1, ITGA5, COL3A1 8
8.02E-10
22 Proteolysis MMP11, MMP1, CTSK, PLAU, MMP2 5
2.24E-02
26 G2 Pathway PLK1, CCNB1, CHEK1 3
8.31E-03
Table 4. (Continued)
Module IDa
Pathwaysb Related genesc # of
genes
q -values
26 Regulation of Cell Cycle FBXO5, BIRC5, CCNA2, MAD2L1, TIMELESS, CHEK1, GMNN, CDC7 8
1.14E-05
33 Cell Cycle BUB1, TTK, ESPL1, PLK1, BUB1B, CCNA2, CDC20, CCNB2 8
8.53E-06
33 Microtubule Based Process TTK, KIF11, KIF23, PRC1, NUSAP1, KIF4A, KPNA2 7
2.64E-06
33 Regulation of Cell Cycle BUB1, FBXO5, TTK, BUB1B, UBE2C, NUSAP1, CCNA2, CKS2, BIRC5 9
2.51E-06
a
Several ovarian cancer modules are shown with enriched b
pathways and c
cancer genes. We selected these modules based on the importance of terms and the ratios of cancer genes and ovarian cancer genes.
doi:10.1371/journal.pcbi.1004042.t004
Figure 5. Network presentation of module 22 in ovarian cancer.In this network, diamonds represent miRNAs: sky-blue nodes for ovarian cancer miRNAs from the HMDD database, pink nodes for ovarian cancer miRNAs supported by the literature, and yellow nodes for the remaining miRNAs. Genes are represented by circles: pink nodes for ovarian cancer genes validated by the literature, green nodes for ovarian cancer genes validated by the DDOC database, orange nodes for cancer genes, and white nodes for the remaining genes. A blue solid line indicates that the MCC value between a gene and a miRNA is larger than 0.3. A purple line indicates that the linked genes are enriched together with at least one function. For example, COL6A1, COL5A3, THBS2, FN1, COL1A1, COL5A1, COLA1A, and COL3A1 are enriched with at least one function together (ECM receptor pathway or Focal adhesion pathway).Table S17presents PubMed identifiers for ovarian cancer genes in pink nodes.
confirms that these pathways are related to ovarian cancer [44,46,47]. In this module,
COL3A1 might be related to ovarian cancer, as it is a known cancer gene targeted by all ovarian cancer miRNAs and belongs to ECM receptor and focal adhesion pathways. COL5A1 and COL5A3 are also likely to be ovarian cancer genes: they are targeted by ovarian cancer miRNAs and enriched in the above pathways, although they are not known cancer genes. Similarly, DPT also might be an ovarian cancer gene, as it is a cancer gene and is targeted by all ovarian cancer miRNAs. Evidence in the literature shows that the previously known ovarian cancer-re-lated miRNAs miR-152, miR-22, and miR-214 are also recancer-re-lated to enriched pathways in this module: miR-152 is involved in ECM-receptor-interaction [48,49], and miR-22 and miR-214 regulate the AKT/PTEN pathway and the p53 signaling pathway [50,51], which are highly re-lated to the ECM-receptor, focal adhesion and proteolysis pathways [52–55]. These observa-tions support the idea that genes and miRNAs interact with each other and play critical roles at the pathway level.
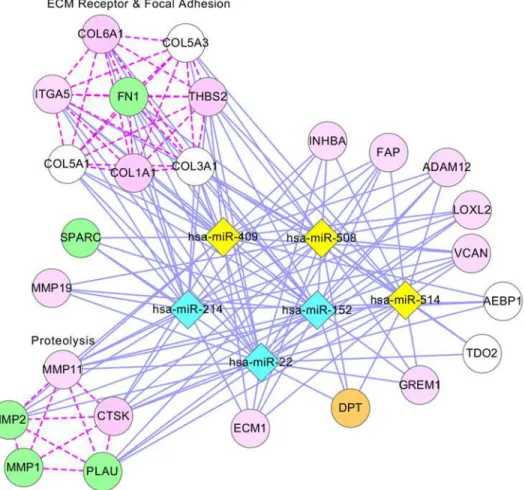
Fig. 6illustrates module 8, which contains 34 genes and 8 miRNAs (5 genes are not shown). Because several genes and miRNAs are duplicated in module 22, the same pathways (ECM re-ceptor and focal adhesion) are enriched. However, other important pathways in ovarian can-cer, such as the TGF-beta signaling pathway and the complement and coagulation cascades pathway, are also enriched [56]. From this module, COL16A1, COL3A1, and COL1A2 are like-ly to be ovarian cancer genes, as they are cancer genes and are enriched with at least one path-way containing ovarian cancer genes. For miRNAs, several articles support that miR-199a, miR-199b, miR-214, and miR-382 are involved in the TGF-beta signaling pathway [57–60], and that miR-22 regulates the AKT/PTEN pathway [50,51], which is closely related to the TGF-beta signaling pathway in several cancers [50,61].
Figure 6. Network presentation of module 8 in ovarian cancer.The description of this network is the same as inFig. 5except that red lines are used to represent two enriched pathways (complement and coagulation cascades pathway, and TGF signaling pathway).
Pathway enrichment tests and network analysis for GBM
We performed pathway enrichment tests for modules identified from the GBM data set. Of 54 modules tested, 40 (74%) were enriched with at least one function. Several modules had many enriched functions or pathways related to GBM, such as the p53 signaling pathway [62], the ERBB signaling pathway [63], and the MAPK signaling pathway [64]. TablesS18,S19, andS20
present lists of enriched pathways. As mentioned above, on average, 23.2% of genes in the modules were cancer genes, and 1.2% were GBM genes. A list of GBM genes was extracted from two articles [34,35]. Similarly to ovarian cancer, the literature results demonstrated that most of the cancer genes in our modules were also GBM-related genes, suggesting that cancer genes in the modules are likely to be related to GBM. We extensively analyzed module 11 be-cause this module contained many GBM-related genes and pathways.
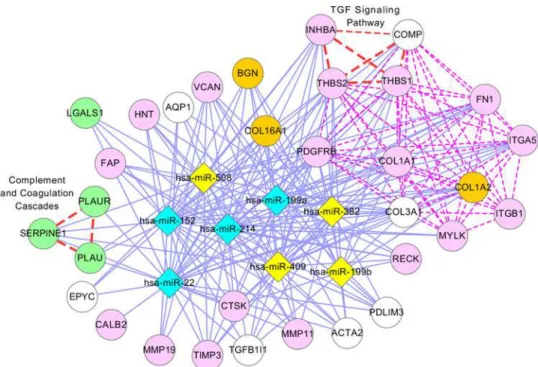
Fig. 7illustrates a network presentation of module 11, where 74 genes (15 genes are not shown) and 7 miRNAs are presented as nodes. In this module, 4 genes (MAPK1, CDKN1A, SHC1, and ERBB2), colored in green, are GBM genes that were validated by the literature. Most of the genes on the left side ofFig. 7are cancer genes and are enriched with at least one pathway, including the p53, ERBB, and GRNH signaling pathways. CBLC might be involved in the development of GBM because it is a cancer gene and is contained in the ERBB signaling pathway, an important GBM-related pathway that includes four GBM genes in this module. Additionally, the literature shows that miRNAs in this module function together in the en-riched pathways: miR-34a, miR-135, miR-21, mi-222, miR-221, miR-27a, and miR-34b are in-volved in the p53 signaling pathway [65–71] and the MAPK signaling pathway [71–75], and miR-34a, miR-135, miR-21, miR-222, and miR-221 are involved in the ERBB signaling path-way [76–79].
Figure 7. Module 11 in GBM.The description of this network is the same as inFig. 5, except that green nodes indicate GBM genes validated by two articles [34,35], and pink nodes indicate GBM genes validated by the literature in PubMed.Table S17presents PubMed identifiers for GBM genes.
Cancer subtypes of modules
In Bellet al.[8], ovarian cancer was classified into four ovarian cancer subtypes depending on the expression levels of marker genes:“immunoreactive,” “proliferative,” “differentiated,”and
“mesenchymal.”The immunoreactive subtype was identified by the chemokine receptor
CXCR3 and its ligands CXCL11 and CXCL10, indicating that considerable expression changes of these genes are important markers for identifying the subtype. The proliferative subtype was identified by the overexpression of transcription factors HMGA2 and SOX11, proliferation marker genes such as MCM2 and PCNA, and underexpression of MUC1 and MUC16, which are known ovarian tumor marker genes. The differentiated subtype was identified by overex-pression of MUC16, MUC1 and SLPI. Finally, the mesenchymal subtype was identified by overexpression of FAP and ANGPTL2.
In this study, we used the marker genes described above to determine which subtype was re-lated to the majority of samples in the modules. First, we calcure-lated the average expression level of the marker gene in the samples belonging to the module.Fig. 8 (A)represents the aver-age expression levels of the 12 subtype marker genes across 33 ovarian cancer modules, show-ing that the expression levels of marker genes vary dependshow-ing on the modules. As explained in the Methods section, we identified the cancer subtypes of samples by performing a hierarchical clustering with a dynamic tree cut (minModuleSize = 30) using gene expression data, and then we calculated thep-values of marker genes for the identified modules. As shown inFig. 8 (B), among marker genes in the immunoreactive subtype, CXCL10 is underexpressed in module 5 (p-value: 0.08), and all of the marker genes (CXCL10, CXCL11 and CXCR3) are overexpressed in module 18 (p-values: 0.04, 0.02 and 0.67). Marker genes of the mesenchymal subtype are overexpressed in module 10 (p-values: 0.0003 and 0.0002), module 23 (p-values: 0.03 and 0.66), and module 32 (p-values: 0.02 and 0.09).
In Verhaaket al.[37], GBM was classified into four subtypes depending on the marker genes:“proneural,” “neural,” “classical,”and“mesenchymal.”It was observed that marker genes DLL3, NKX2–2, SOX2, ERBB3, and OLIG2 were overexpressed in the proneural type; marker genes FBXO3, GABRB2, SNCG and MBP were overexpressed in the neural sub-type; FGFR3, PDGFA, EGFR, AKT2, and NES were overexpressed in the classical subsub-type; and CASP1, CASP4, CASP5, CASP8, ILR4, CHI3L1, TRADD, TLR2, TLR4, and RELB were expressed in the mesenchymal subtype. Note that marker genes of the GBM subtype were over-expressed in samples belonging to that subtype, while marker genes of other GBM subtypes were underexpressed in those samples.
For GBM, we first calculated the average expression levels of marker genes.Fig. 9 (A) pres-ents the average expression levels of the 23 subtype marker genes across 54 GBM modules, and shows the distinct expression levels of marker genes depending on the modules.Fig. 9 (B)
Figure 8. Expression levels of ovarian cancer subtype marker genes.(A) Heat map of the means of marker gene expression levels for 32 ovarian cancer modules. Red indicates overexpression of genes, and green indicates underexpression of genes. (B) Expression levels of marker genes of selected modules. Blue bars represent marker genes that determine the subtype and red bars represent other subtype marker genes.
Figure 9. Expression levels of GBM subtype marker genes.(A) Heat map of the means of marker gene expression levels for 54 GBM modules. Red indicates overexpression of genes, and green indicates underexpression of genes. (B) Expression levels of marker genes of selected modules. Blue bars represent marker genes that determine the subtype, and red bars represent other subtype marker genes.
When we used these subtypes of samples for the enrichment of a particular subtype in our modules through a hypergeometric test, we confirmed that modules 32 and 45 are closely relat-ed to the neural subtype (p-values: 0.053 and 0.018).
Performance comparisons
Zhanget al.[6] previously showed that their NMF approach outperformed the bi-clique algo-rithm proposed by Penget al.[5]. Hence, we assessed the performance of our approach by comparing it with the NMF approach using TCGA ovarian cancer data. By applying our crite-ria to the modules generated from their approach, we selected modules having at least one gene and two human miRNAs. As a result, we removed 7 out of 50 modules.Fig. 10shows that the ratio of modules containing enriched pathways in the NMF approach was slightly higher than the ratios of our modules. However, the average number of enriched pathways in our modules was larger than that in the NMF approach.
When we compared enriched pathways, two approaches had 43 common pathways, includ-ing ovarian cancer-related pathways such as the immune response, ECM-receptor, and TGF-Beta signaling pathways. In addition, 71 pathways were enriched only in our modules and 67 pathways only in the NMF modules, indicating that the two approaches most likely comple-ment each other and capture different pathways related to ovarian cancer.Table S21lists the common pathways and pathways enriched in each approach.
Additionally, modules identified by our approach contain more differentially expressed genes and cancer-related genes, because we primarily used differentially expressed genes, which provide more chances to incorporate cancer type-specific genes. In Zhang et al. [6], the modules contain a small fraction of differentially expressed genes and cancer-related genes, be-cause 12,456 genes were used after filtering out genes with small absolute values and little varia-tion. When we computed the overlap ratios of differentially expressed gene, most genes in our modules (79.4%, 617 out of 777 genes) were differentially expressed. However, modules gener-ated by Zhang et al. [6] contained 28.3% (462 out of 1630 genes) differentially expressed genes on average. When we compared ratios of cancer genes, ovarian cancer genes, and ovarian can-cer miRNAs in modules, our approach outperformed the NMF approach, as shown inFig. 10.
The difference between the NMF approach and ours from a methodological viewpoint is that our approach can be more flexibly generalized to incorporate other regulatory compo-nents. In our approach, gene-sample modules are first constructed, and then miRNAs regulat-ing genes are added to the modules (generatregulat-ing gene-miRNA modules). To demonstrate the range of our approach, we incorporated DNA copy number aberrations (CNAs) as another type of regulators in gene-sample modules. As a result, 23 out of 58 ovarian cancer gene-sample modules were explained by the regulation of CNAs, and 15 ovarian cancer gene-sample mod-ules were explained by both miRNAs and CNAs. A detailed analysis regarding regulations by CNAs is provided in theDiscussionsection. By contrast, the NMF approach simultaneously in-corporates gene-expression, miRNA expression, gene-gene interaction, and gene-miRNA se-quence prediction information. Hence, when other regulators are included, they generate modules, where correlations between genes and regulators are simultaneously high. Indeed, in another paper from the same authors [81], they extended their NMF model to incorporate miRNAs, genes, and methylation of genes. In the generated modules, correlations of the ex-pression levels of these three data sets were coordinately high due to a common basis matrix. Although it is a good approach, it omits modules representing the regulation of genes by a sin-gle type of regulators when incorporating multiple regulators.
target prediction information, mRNA expression, and miRNA expression data. The modules constructed by the COSMIC algorithm consisted of a single miRNA and genes, which indicat-ed that several genes are regulatindicat-ed by the miRNA. When we appliindicat-ed aq-value threshold of<
0.05 to 479 identified modules, 102 modules were obtained. Since COSMIC generates modules consisting of a single miRNA, it is difficult to directly compare COSMIC with our approach. Hence, we applied pathway enrichment tests using GO biological processes and BioCarta and KEGG pathways with aq-value threshold of<0.05 to these 102 modules, and observed that
25.5% (27 out of 102) of the modules were significantly enriched. This enrichment ratio is lower than the value obtained using our approach (48.4%). However, we need to consider that the higher enrichment ratio in our approach is partially because two studies developed algo-rithms using different data sets and different assumptions. We incorporated gene-gene interac-tions and indirect interacinterac-tions among genes and miRNAs based on mRNA expressions and miRNA expressions, while COSMIC incorporated direct interactions using sequence informa-tion of genes and miRNAs, which might reduce false positive interacinforma-tions. In spite of the differ-ences, the two approaches had 26 common pathways, including ovarian cancer-related pathways such as the ECM-receptor, DNA replication, and the G2 pathway. In addition, 88 and 38 pathways were enriched only in our modules and only in the COSMIC algorithm, re-spectively.Table S22lists the common pathways as well as the pathways enriched in each approach.
Discussion
In this study, we developed an approach to constructing gene-miRNA modules by integrating genes and miRNAs. We applied our approach to ovarian cancer and GBM data sets from the TCGA project. Finally, we constructed 33 modules for ovarian cancer and 54 modules for Figure 10. Performance comparisons.Comparison of modules identified using our approach and the NMF approach using ovarian cancer data. (A) The ratio of modules with at least one enriched function or pathway. (B) The average number of enriched functions in the identified modules. (C) The average ratios of cancer genes, ovarian cancer genes, and ovarian cancer miRNAs in the modules.
GBM. We employed gene-gene interactions to include genes with high absolute correlations with genes in the modules, because some important cancer-related genes might not be clus-tered together by the biclustering algorithm or might not be differentially expressed.Fig. 2
shows that incorporating gene-gene interactions increased the performance in terms of the av-erage number of enriched terms, the number of modules with at least one enriched pathway, and the ratios of cancer-related genes and cancer-related miRNAs. Although we used gene-gene interactions to add biologically relevant gene-genes to modules in the proposed approach, gene-gene interactions can be used to filter out biologically irrelevant genes from modules to reduce false positives. However, because the currently available human gene-gene interactions are not complete, closely related but unidentified genes might also be filtered out. It is an im-portant challenge to incorporate gene-gene interactions to reduce false positive genes in mod-ules, while true relevant genes still remain. We will address this issue in our future work.
Because the identified modules might miss relevant interactions, we measured a potential false negative rate using miRTarbase. LetNGbe the number of common genes in the modules and miRTarbase, and letNG_interactionbe the number of common genes that interact with the same miRNAs in the modules and miRTarbase. Then, 1 -NG_interaction/NGmight be a poten-tial false negative rate. As a result, the rates of false negative were 0.789 (1–118/559) for ovarian cancer and 0.775 (1–316/1405) for GBM, respectively. However, the false negative rate should be adjusted when more accurate miRNA-gene interaction data become available, as this ratio is estimated based on all gene-miRNA interactions from miRTarbase and is not based on the spe-cific cancer type and miRTarbase, which itself contains only a fraction of the gene-miRNA interactions.
In theResultssection, we described a functional enrichment test of genes in modules using GO terms, KEGG, and BioCarta pathways. Although we employed a widely used approach in the enrichment test, a hypergeometric test followed by a Benjamini & Hochberg method for multiple comparison correction, several issues that require further improvement still remain. For the first issue, the Benjamini & Hochberg method hypothesizes independence of the terms, while the biological processes in various ontologies represent a hierarchical structure and inter-correlation. Thus, we performed an additional enrichment test for ovarian cancer and GBM modules using TANGO [83], which considers dependencies among biological pathways. It cor-rectsp-values by computing the distribution of enrichmentp-values in a large number of ran-domly generated gene sets of the same size. For ovarian cancer, 16 of 33 modules (48%) were enriched with at least one GO biological process term. For GBM, 28 out of 54 modules (48%) were enriched with at least one term. TablesS23andS24list all pathways enriched in each can-cer. Further,Fig. S7shows a comparison of the two approaches (a Benjamini & Hochberg method and TANGO) in terms of the ratio of enriched modules and the number of enriched terms. Although there are small differences in the two approaches, both approaches confirm that a large fraction of our identified modules were enriched with biologically relevant terms. For the second issue, because annotated pathways in GO terms, KEGG, and BioCarta pathways are still incomplete, validations on these pathways might miss biologically related sets of genes. An approach to reveal the pathways unannotated in GO, KEGG and BioCarta is to search for evidence about gene functions in the literature, and then to analyze them collectively. As part of such efforts, we manually searched scientific articles on ovarian cancer-related genes and GBM-related genes (Table S17), and relationships among genes, microRNAs, and TFs (Tables
no currently available tools or websites are not connected. Hence, we will further analyze mod-ules for functional enrichments in the future.
Certain oncogenes and tumor-suppressor genes such as P53 and PTEN may play important roles in many cancer types rather than only in specific cancer type. Hence, we examined how many genes in the identified modules were specific to ovarian cancer or GBM. We collected 1393 genes from five cancer type specific databases: the DDOC [33], GBM genes from the liter-ature [34,35], the Cervical Cancer gene Database (CCDB) [84], the Dragon Database of Genes associated with Prostate Cancer (DDPC) [85], and Lung Cancer Gene Database (LUGEND). We refer to genes contained only in the DDOC as potentially ovarian cancer specific genes. Al-though these genes are not compared with genes from all types of cancers, it might helpful to remove common cancer genes. Among the 47 DDOC genes included in our ovarian cancer modules, 18 genes were potentially ovarian cancer specific genes. Similarly, among the 32 GBM genes included in our GBM modules, 7 genes were potentially GBM cancer specific genes. Lists of these cancer type specific genes are shown inTable S25.
The accuracy of the identified modules might be largely dependent on the quality of the data sets. In this study, we used TCGA microarray data sets, as in many previous reports they have been used to identify core genes and pathways significantly related to ovarian cancer and GBM. Additionally, when TCGA microarray data sets were compared to RNA-Seq data from the same samples, their expression values were highly correlated in most cases [86] confirming that these data sets are less dependent on a particular platform.
The proposed approach can be generalized to incorporate other regulatory components. To demonstrate the range of applicability of our approach and to provide additional support of bi-ological relevance to the modules, we incorporated somatic DNA copy numbers from the paired patients of gene expression data. For this task, we downloaded TCGA level 3 data sets that provide segmented copy number ratio data compared to normal samples. We first recalcu-lated the copy number aberration ratios for every 1 MB region and filtered out regions whose absolute copy number ratio values are less than 0.2, corresponding to 99.9% among all ratio values. Then, CNA regions were incorporated into gene-sample modules based on correlations between genes in modules and CNA regions. As a result, for the ovarian cancer modules, 23 out of 58 gene-sample modules were explained by the regulation of CNAs, and genes in 15 out of 33 gene-miRNA modules (45%) were also regulated by CNAs, as shown inTable S26. In particular, genes in several modules were located in the regulating CNA regions, indicating that the expression of genes in the modules might be directly affected by CNAs. DNA copy numbers in the chr 1: 32.1 MB - 53.4 MB region were highly correlated with genes in ovarian cancer module 9 with a PCC value of 0.301, and 13 out of 18 genes in the module (CDCA8, C1orf109, AK2, SNIP1, GNL2, RLF, TRIT1, YRDC, RRAGC, PPIE, PSMB2, MED8 and COL9A2) were located in this CNA region. Similarly, the DNA copy numbers in the chr 1: 180.6 MB - 247.9 MB region were highly correlated with genes in ovarian cancer module 23 with a PCC value of 0.319, and most of genes (14 out of 19 genes) in this module were located in this region. Additionally, for ovarian cancer module 29, DNA copy numbers in chr 1: 31.9 MB - 59.1 MB regions have a high correlation value (0.345) with gene in the module, and 78.3% of the genes are located in this region. For GBM, 26 out of 88 gene-sample modules were explained by regulation of the DNA copy numbers shown inTable S27, and 19 out of 54 gene-miRNA modules (35%) were commonly regulated by CNAs and gene-miRNAs.
Supporting Information
is a set of genes andEis a set of edges betweenUandV. Nodes in one side are genes and nodes in the other side are samples. An edge is linked if the expression value of gene for sample is high or low. This means that gene expression level ofvsignificantly changes in sample ofu. In this model, we try to find a subgraphG0= (U0,V0,E0) ofG, where expression values of most genes inV0significantly change in most of samples inU0, representing low values or high val-ues. For example, genesG3,G4, andG5 inV0andS3 andS4 samplesU0are constructed as a module (a circle colored in grey). For gene expression data normalized by a z-score, the SAMBA biclustering algorithm generates highly correlated gene-sample clusters that represent similar tendencies of gene expression changes for a subset of samples.
(TIF)
S2 Fig. Distribution of the number of pathway terms.
(TIF)
S3 Fig. Performance comparison of gene-miRNAs modules for GBM.Performances of gene-miRNA modules generated from four cases (SCC with GGI information, SCC without GGI information, PCC with GGI information, and PCC without GGI information) are com-pared. For all cases,x-axis presents different percentages of candidate miRNAs (T%) among all miRNAs when constructing gene-miRNA modules. For each case, ratios of modules enriched with at least one pathway, the average number of enriched pathways, and ratios of cancer genes, GBM genes, and GBM miRNAs are shown.
(TIF)
S4 Fig. Overlap ratio of genes in ovarian cancer modules.For every pairs of ovarian cancer modules, the overlap ratios of genes are defined asjm1\m2j/jm1[m2j, wherem1andm2are
numbers of genes in module 1 and module 2, respectively. (TIF)
S5 Fig. Overlap ratio of genes in GBM modules.The description of the overlap ratios is the same as inFig. S4.
(TIF)
S6 Fig. Ratios of modules having four types of gene-miRNA relationships in ovarian cancer and GBM modules.y-axis represents the fraction of modules containing at least one corre-sponding relationship in the modules.‘microCosm’represents gene-miRNA interactions based on gene-miRNA sequences from the microCosm database, and‘miRTarbase’represents exper-imentally confirmed gene-miRNA relationships from miRTarbase.‘TF regulates genes and miRNAs’represents that genes and miRNAs are co-regulated by the same TF.‘MiRNA regu-lates genes via TFs’represents that miRNA regulates transcription factors and transcription factors regulates genes.‘Union’represents all four types of relationships.
(TIF)
and GBM, respectively. (TIF)
S1 Table. Genes in ovarian cancer modules.
(PDF)
S2 Table. MiRNAs in ovarian cancer modules.
(PDF)
S3 Table. Genes in GBM modules.
(PDF)
S4 Table. MiRNAs in GBM modules.
(PDF)
S5 Table. Cancer genes, ovarian cancer genes and ovarian cancer miRNAs in modules.
‘Num’represents the number of ovarian cancer genes (or ovarian cancer miRNAs) / the
num-ber of all genes (or all miRNAs) in a module. (PDF)
S6 Table. Cancer genes, GBM genes and GBM miRNAs in modules.‘Num’represents the number of GBM genes (or GBM miRNAs) / the number of all genes (or all miRNAs) in a mod-ule.
(PDF)
S7 Table. Exprementally validated gene-miRNA interactions in ovarian cancers.
(PDF)
S8 Table. Genes and miRNAs are co-regulated by the same TF in ovarian cancer modules.
(PDF)
S9 Table. MiRNA regulates TFs and the TFs regulate genes in the ovarian cancer modules.
(PDF)
S10 Table. MiRNAs regulate genes in GBM modules.The significant numbers of genes in each module are regulated by miRNAs, and the significances are shown in‘p-value’.‘m’,‘k’, and‘x’represent the number of genes regulated by the miRNA collected from microCosm, the number of genes in the module, and the number of genes regulated by the miRNA in the mod-ule, respectively.
(PDF)
S11 Table. Genes and miRNAs are co-regulated by the same TF in GBM modules.
(PDF)
S12 Table. MiRNA regulates TFs and the TFs regulate genes in GBM modules.
(PDF)
S13 Table. Exprementally validated gene-miRNA interactions in GBM.
(PDF)
S14 Table. Ovarian cancer modules with enriched GO terms.The significant numbers of genes in each module are enriched in gene ontology biological process, and the significance is shown in‘p-value’.‘m’,‘k’, and‘x’represent the number of genes in the corresponding GO term, the number of genes in the module, and the number of genes belonging to the GO term in the module, respectively.
S15 Table. Ovarian cancer modules with enriched pathways in KEGG.The significant num-bers of genes in each module are enriched in KEGG pathway, and the significance is shown in
‘p-value’.‘m’,‘k’, and‘x’represent the number of genes in the corresponding KEGG pathway,
the number of genes in the module, and the number of genes belonging to the pathway in the module, respectively.
(PDF)
S16 Table. Ovarian cancer modules with enriched pathways in BioCarta.The significant numbers of genes in each module are enriched in BioCarta pathways, and the significance is shown in‘p-value’.‘m’,‘k’, and‘x’represent the number of genes in the corresponding Bio-Carta pathway, the number of genes in the module, and the number of genes belonging to the BioCarta pathway in the module, respectively.
(PDF)
S17 Table. Literature evidences for ovarian cancer-related genes from ovarian cancer mod-ules 22 and 8, and GBM-related genes from GBM module 22.
(PDF)
S18 Table. GBM modules with enriched GO terms.The significant numbers of genes in each module are enriched in GO biological process, and the significance is shown in‘p-value’.‘m’,
‘k’, and‘x’represent the number of genes in the corresponding GO term, the number of genes
in the module, and the number of genes belonging to the GO term in the module, respectively. (PDF)
S19 Table. GBM modules with enriched pathways in KEGG.The significant numbers of genes in each module are enriched in KEGG pathways, and the significance is shown in ‘p-value’.‘m’,‘k’, and‘x’represent the number of genes in the corresponding pathway, the num-ber of genes in the module, and the numnum-ber of genes belonging to the pathway in the module, respectively.
(PDF)
S20 Table. GBM modules with enriched pathways in BioCarta.The significant numbers of genes in each module are enriched in BioCarta pathways, and the significance is shown in ‘p-value’.‘m’,‘k’, and‘x’represent the number of genes in the corresponding pathway, the num-ber of genes in the module, and the numnum-ber of genes belonging to the pathway in the module, respectively.
(PDF)
S21 Table. Comparisons of enriched pathways from the NMF approach and our approach.
(PDF)
S22 Table. Comparisons of enriched pathways from the COSMIC algorithm and our ap-proach.
(PDF)
S23 Table. Ovarian cancer modules enriched with GO terms using a TANGO tool.
(PDF)
S24 Table. GBM modules enriched with GO terms using a TANGO tool.
(PDF)
S25 Table. Ovarian cancer specific genes and GBM specific genes in identified modules.


![Table 4 presents enriched functions or signaling pathways for selected modules. Several mod- mod-ules have many enriched functions or pathways related to ovarian cancer, such as the p53 sig-naling pathway [43], ECM receptor interactions [44], and cell cyc](https://thumb-eu.123doks.com/thumbv2/123dok_br/18189864.332193/14.918.68.773.119.496/enriched-functions-signaling-pathways-selected-functions-pathways-interactions.webp)