High Intensity Interval Training (HIIT)
Induces Specific Changes in Respiration and
Electron Leakage in the Mitochondria of
Different Rat Skeletal Muscles
Dionizio Ramos-Filho1☯*, Gustavo Chicaybam1☯, Eduardo de-Souza-Ferreira1,
Camila Guerra Martinez3, Eleonora Kurtenbach3, Gustavo Casimiro-Lopes2, Antonio Galina1*
1Laboratory of Bioenergetics and Mitochondrial Physiology-Institute of Medical Biochemistry Leopoldo de Meis-Federal University of Rio de Janeiro, UFRJ, Rio de Janeiro, Rio de Janeiro, Brazil,2Institute of Physical Education and Sports-State University of Rio de Janeiro, UERJ, Rio de Janeiro, Rio de Janeiro, Brazil,3Institute of Biophysics Carlos Chagas Filho, Federal University of Rio de Janeiro UFRJ, Rio de Janeiro, Rio de Janeiro, Brazil
☯These authors contributed equally to this work.
*[email protected](AG);[email protected](DRF)
Abstract
High intensity interval training (HIIT) is characterized by vigorous exercise with short rest intervals. Hydrogen peroxide (H2O2) plays a key role in muscle adaptation. This study
aimed to evaluate whether HIIT promotes similar H2O2formation via O2consumption
(elec-tron leakage) in three skeletal muscles with different twitch characteristics. Rats were assigned to two groups: sedentary (n=10) and HIIT (n=10, swimming training). We collected the tibialis anterior (TA-fast), gastrocnemius (GAST-fast/slow) and soleus (SOL-slow) mus-cles. The fibers were analyzed for mitochondrial respiration, H2O2production and citrate
synthase (CS) activity. A multi-substrate (glycerol phosphate (G3P), pyruvate, malate, glu-tamate and succinate) approach was used to analyze the mitochondria in permeabilized fibers. Compared to the control group, oxygen flow coupled to ATP synthesis, complex I and complex II was higher in the TA of the HIIT group by 1.5-, 3.0- and 2.7-fold, respectively. In contrast, oxygen consumed by mitochondrial glycerol phosphate dehydrogenase (mGPdH) was 30% lower. Surprisingly, the oxygen flow coupled to ATP synthesis was 42% lower after HIIT in the SOL. Moreover, oxygen flow coupled to ATP synthesis and complex II was higher by 1.4- and 2.7-fold in the GAST of the HIIT group. After HIIT, CS activity increased 1.3-fold in the TA, and H2O2production was 1.3-fold higher in the TA at sites
con-taining mGPdH. No significant differences in H2O2production were detected in the SOL.
Surprisingly, HIIT increased H2O2production in the GAST via complex II, phosphorylation,
oligomycin and antimycin by 1.6-, 1.8-, 2.2-, and 2.2-fold, respectively. Electron leakage was 3.3-fold higher in the TA with G3P and 1.8-fold higher in the GAST with multiple sub-strates. Unexpectedly, the HIIT protocol induced different respiration and electron leakage responses in different types of muscle.
OPEN ACCESS
Citation:Ramos-Filho D, Chicaybam G, de-Souza-Ferreira E, Guerra Martinez C, Kurtenbach E, Casimiro-Lopes G, et al. (2015) High Intensity Interval Training (HIIT) Induces Specific Changes in Respiration and Electron Leakage in the Mitochondria of Different Rat Skeletal Muscles. PLoS ONE 10(6): e0131766. doi:10.1371/journal.pone.0131766
Editor:Makoto Kanzaki, Tohoku University, JAPAN
Received:February 27, 2015
Accepted:June 5, 2015
Published:June 29, 2015
Copyright:© 2015 Ramos-Filho et al. This is an open access article distributed under the terms of the Creative Commons Attribution License, which permits unrestricted use, distribution, and reproduction in any medium, provided the original author and source are credited.
Data Availability Statement:All relevant data are within the paper.
Funding:The authors have no support or funding to report.
Introduction
The World Health Organization has stated that physical inactivity is the fourth leading risk fac-tor for global mortality (6% of deaths worldwide), which is equivalent to approximately 3.2
million deaths per year [1]. The American College of Sports Medicine recommends at least 20
minutes a day of vigorous exercise three times per week [2]. High intensity interval training (HIIT) is characterized by periods of high intensity exercise combined with short rest intervals, resulting in aerobic-like effects. In addition, HIIT protocols shorten the total time spent on physical activity while producing the same work load [3,4]. This training strategy is currently applied in humans as an alternative exercise intervention in different disease conditions, such as heart failure, hypertension, type II diabetes, obesity and chronic obstructive pulmonary dis-ease [5–10].
In rat muscle, HIIT protocols favor high citrate synthase (CS) and hydroxyacyl-CoA
dehy-drogenase (HAD) activities, mitochondrial gene expression and mitochondrial biogenesis [3,
11–13]. Rats with a high running capacity have low levels of oxidative stress, suggesting an increase in antioxidant defenses and/or low production of reactive oxygen species (ROS) by the
mitochondrial electron transport system (ETS) [14]. In previous work [15], we demonstrated
that HIIT resulted in high endurance and low mitochondrial glycerol phosphate dehydroge-nase (mGPdH) activity. This enzyme is part of the glycerol phosphate shuttle in the inner mito-chondrial membrane, which is the site of the third highest rate of mitomito-chondrial superoxide
(O2−•) production [16]. Our previous study indicated that HIIT decreases mGPdH activity,
suggesting that HIIT prevents ROS production. In fact, decreased mGPdH activity has been previously demonstrated] 15], but the mitochondrial ROS production rate was not evaluated, and the effects of HIIT protocols on hydrogen peroxide (H2O2) generation are unknown.
During mitochondrial respiration, a small portion of the electrons leak out from the ETS, primarily through complexes I and III, and form O2•−and other ROS [17,18]. These electron leaks may be an indicator of the mitochondrial redox status and could be involved in signaling
for muscle remodeling and atrophy [19]. Aerobic endurance training reduces mitochondrial
electron leakage in the gastrocnemius (GAST) muscle in the presence of malate plus glutamate
or succinate (Succ) [20]. These substrates favor ROS formation at complexes I and III.
How-ever, the effect of HIIT protocols on the mitochondrial generation of ROS, which is sustained by glycerol phosphate (G3P), fatty acids or mixed substrates, is not fully understood. Endur-ance training increases the oxidative capacity of skeletal muscle. Thus, the aim of this study
was to evaluate whether HIIT would alter mitochondrial respiration and H2O2production in
different types of permeabilized skeletal muscle fibers (tibialis anterior (TA), fast (F); GAST, fast/slow (F/S); and soleus (SOL), slow (S) in a similar manner and to determine the fraction of
H2O2formed from O2consumption after HIIT (electron leakage).
Methods
Animals
Twenty 90-day-old male Wistar rats were housed with a 12-h dark/light cycle and ad libitum access to food and water. The rats were matched by weight and randomized into two groups: sedentary (SED; n = 10) and HIIT (n = 10). The experimental protocol was approved by the Animal Ethics Committee, Federal University of Rio de Janeiro (Permission Number: 012000.001568/2013-87). Three types of skeletal muscle from the same hindlimbs were analyzed: TA fast fibers (92% type IIb fast twitch fibers), GAST mixed fibers (approximately 50% type I slow twitch and type II fast twitch fibers) and SOL slow fibers (84% type I slow
adaptations after the HIIT swimming protocol because the TA and GAST are very active dur-ing swimmdur-ing; indeed, glycogen levels decrease by 75% and 50% in the TA and GAST, respec-tively [22,23]. Conversely, glycogen levels do not change in the SOL [22]. The SOL was therefore used as the negative swimming control.
Exercise protocol
Rats were exercised by swimming as described by Terada et al. [3]. The HIIT consisted of
four-teen bouts of 20-sec swimming periods, each followed by a 10-sec rest. This protocol was administered three times a week on alternating days. The initial load was 9% of the body weight, and this was incrementally increased by 1% of the body weight each week. The SED controls were untrained. Training adaptation was evaluated at the end of 6 weeks, when the controls and HIIT rats were assessed in an acute test of swimming endurance in which a load of 14% of the body weight was applied [15].
Skeletal muscle sampling and tissue collection
The rats were decapitated 48 h after the last exercise. The body weight and visceral fat mass were measured, and the body fat percentage was calculated for each animal. Skeletal muscles (TA, GAST and SOL) were excised and placed at 4°C until analysis. Skeletal muscle
prepara-tion. This technique has been described in detail by Anderson and Neufer [24] and Pesta and
Gnaiger [25]. After dissection, the muscle samples were placed in ice-cold (4°C) BIOPS buffer
(~3 mg wet weight per fiber bundle). The fiber bundles were treated with saponin (50μg/ml)
for 30 min as previously described [25]. All the preparations were performed at 4°C, and the
samples were stored at 4°C; 2 h after permeabilization, the fibers were used for respirometry
and H2O2production experiments. At the end of the experiments, skeletal muscle biopsies
were stored at−70°C for further analysis of CS activity and western blots.
Respiratory protocol
Respiration measurements were performed in 2 ml of mitochondrial respiration medium 05
(MiR05) for each fiber bundle. O2consumption was measured using the high-resolution
Oxy-graph-2k system (Oroboros, Innsbruck, Austria) [25,26]. The results were normalized to the
wet weight or CS activity of the permeabilized fiber bundles. All the experiments were per-formed at 37°C in a 2-ml chamber. Oxygen flux induced by the addition of cytochrome c (Cyt-c) increased no more than 10%, confirming the viability of the preparations during the experi-ments [26]. Multi-substrate titrations. This titration protocol was modified from previous pro-tocols that have been described in detail [25]. All the titrations were performed in series as described below. The multi-substrate titration consisted of the sequential addition of G3P (10 mM); pyruvate, malate, and glutamate (PMG; 10, 10, and 20 mM, respectively); Succ (10 mM);
adenosine diphosphate (ADP, 2.5 mM); Cyt-c (10μM); oligomycin (Oligo, 2μg/ml); carbonyl
cyanide p-(trifluoromethoxy) phenylhydrazone (FCCP, 1μM); rotenone (ROT, 0.5μM);
malo-nate (MALO, 10 mM); and cyanide (KCN, 5 mM). Evaluation of fatty acid oxidation: A second titration protocol was performed sequentially with G3P (10 mM; non-p-state) and ADP (2.5
mM; p-state). A third titration protocol involved palmitoyl-carnitine (PALM, 75μM;
non-p-state) and ADP (2.5 mM; p-non-p-state).
Citrate synthase enzyme activity
CS activity was measured in all three muscles as described previously [27] with minor
phosphate, pH 7.4, 10% glycerol, 1% octal phenol ethoxylate, 10 mM sodium orthovanadate, 10 mM NaF, and 10 mM sodium pyrophosphate) supplemented with a protease inhibitor cocktail (P8340, Sigma-Aldrich) using an Ultra Turrax T25 (IKA, Staufen Werke, Germany). After 30 min on ice, the tissue lysates were centrifuged (13,000 x g for 20 min at 4°C), and the resulting supernatants were collected.
The reaction medium contained 20 mM Tris-HCl, pH 8, 0.3 mM 5,5’
-dithio-bis(2-nitroben-zoic acid) (DTNB), 0.48 mM acetyl coenzyme A (AcCoA), and 5μg/ml protein. The medium
was incubated for 5 min with continuous shaking at 37°C, and the reaction was initiated by the addition of 5 mM oxaloacetate. The reactions were performed in a 96-well plate, and the results were read at 420 nm in a Victor-Perkin Elmer plate reader. The specific activity was calculated
based on a curve of CoA in the presence of 0.3 mM DTNB and was expressed asμmol citrate.
min-1.mg-1protein.
H
2O
2production in permeabilized fibers
Mitochondrial H2O2release was determined by measuring the fluorescence of the Amplex Red
probe (Life Technologies SAS, Brazil) using a spectrofluorimeter (Varian Cary Eclipse; Agilent Technologies, Santa Clara, CA) as described previously (24). The reaction was initiated by the addition of a bundle of fibers that were permeabilized with 2 ml of MiR05 solution containing
5μM Amplex Red and 4 U/ml horseradish peroxidase. The following solutions were added
sequentially in the multi-titration experiment: G3P (10 mM), PMG (5:5:10 mM), Succ (10
mM), ADP (2.5 mM), Oligo (2μg/ml), FCCP (0.5μM), and the complex III blocker antimycin
A (Ant A; 2.5μM). The second and third titration protocols described above were performed
sequentially with the same additives as in the first titration. The second titration used only one
substrate, G3P (10 mM), along with ADP (2.5 mM), Oligo (2μg/ml), FCCP (0.5μM), and Ant
A (2.5μM), whereas the third titration used only PALM (75μM), ADP (2.5 mM), Oligo (2μg/
ml), FCCP (0.5μM), and Ant A (2.5μM). The fourth and fifth titrations used the following
sequential titration with a different initial substrate in the TA and GAST skeletal muscles: for
the fourth titration, G3P (10 mM), ROT (0.5μM), MALO (10 mM) and Ant A (2.5μM); for
the fifth titration, PALM (75μM), ROT (0.5μM), MALO (10 mM) and Ant A (2.5μM). H2O2
was measured, and the results were expressed per milligram of wet weight and normalized to
CS activity when necessary. The specific rate of H2O2production was determined using linear
regression curve fitting with Origin 8.0.
Electron leakage determination
We calculated the fraction of electrons that leaked out of the respiratory chain by dividing the rate of H2O2formation by the rate of O2consumption [20,28]. To calculate electron leakage, these 2 measurements were expressed using the same units and normalized to CS activity. The electron leakage related to a specific substrate was calculated as the ratio of H2O2formed by a specific substrate (for example, G3P) or by a multi-substrate regimen (for example, G3P/PMG/ Succ) to oxygen consumption with that substrate or substrate regimen.
Western blot
Samples were taken from each muscle and macerated in HEPES buffer (50 mM HEPES, 10
mM EDTA, 1 mM MgCl2, and 0.1% Triton X-100) using the Ultra-Turrax homogenizer [29].
The samples were weighed and centrifuged to remove debris. The supernatant was collected,
and 20 ug of each protein sample was resolved by 4–20% SDS-PAGE (Mini-Protean TGX
4–20%, BioRad) at 50 V and transferred to a PVDF membrane (Trans-Blot Transfer Turbo
(BioRad). After transfer, the membranes were blocked with 5% BSA in 1X TBS-T (10 mM Tris, pH 8.0, 150 mM NaCl, and 0.5% Tween 20) for 2 h and incubated overnight at 4°C with gentle agitation with the following primary antibodies: Anti-Rt / MS Total OXPHOS (Invitrogen; 1:2500 dilution) and GAPDH (Santa Cruz Biotechnology; 1:20,000 dilution). The specific HRP-conjugated secondary antibody was incubated with the membranes for 2 h at room tem-perature. After this procedure, the membranes were developed using the ECL Plus Chemilumi-nescent Western Blotting Detection System (GE Healthcare Life Sciences).
Statistical analysis
Comparisons were performed using an unpaired t-test. The data are presented as the
mean ± standard error, and p<0.05 was defined as significant. To analyze and quantify the rate
of H2O2production, we analyzed the linear regressions from the stationary flows after the
addi-tion of different substrates or inhibitors using the Origin graphic and statistics analysis
pro-gram to calculate the slope of the curve. Then, the picomolar concentration of H2O2was
calculated using the slope of the curve.
Results
Effects of training on performance, body weight and % visceral fat mass
The efficacy of HIIT was confirmed based on the more than 2.0-fold increase in the swimming duration of the HIIT rats compared to the SED controls at the end of the training period
(p<0.05). In addition, the HIIT rats gained less body weight (7%; p<0.05) than the SED controls,
and the % visceral fat mass of the HIIT rats was proportionally lower (22%; p<0.05). The masses
of the three muscles in the HIIT group were not different than those in the SED group (Table 1).
HIIT Induces differential oxygen consumption flux in distinct skeletal
muscles: Data from multiple substrates (glycerol phosphate; pyruvate,
malate, and glutamate; and succinate) normalized to wet weight (mg)
Previous work [15] has shown that mGPdH activity decreases by more than 80% in the TA
skeletal muscle after HIIT. However, the effect of HIIT on mitochondrial respiration, which is supported by mGPdH activity and multiple substrates, was not measured in different muscles. To clarify this point and confirm the kinetics of mGPdH activity, a high-resolution respirome-try experiment was performed in three types of muscle with different demands during swim-ming work.
Table 1. Maximal Endurance Test (s), body weight, visceral fat, visceral fat percentage, and muscle weight in rats subjected to chronic high-inten-sity training (HIIT) over 6 weeks.
SED HIIT P values
Swimming duration (s) 174±34 (9) 349±26*(10) p<0.01
Body weight (g) 378±9.5 (9) 352±8.0*(10) p<0.05
Visceral fat (g) 6.8±0.60 (9) 5.3±0.63*(10) p<0.05
Visceral fat (%) 1.8±0.1 (9) 1.4±0.2*(10) p<0.05
Tibialis anterior 0.591±0.13 (9) 0.605±0.09 (10) NS
Gastrocnemius 1.79±0.15 (9) 1.78±0.12 (10) NS
Soleus 0.170±0.04 (9) 0.173±0.05 (10) NS
The number of animals is shown in parentheses. The data are expressed as the mean±standard error. NS: not statistically significant.
*p<0.05 vs controls.
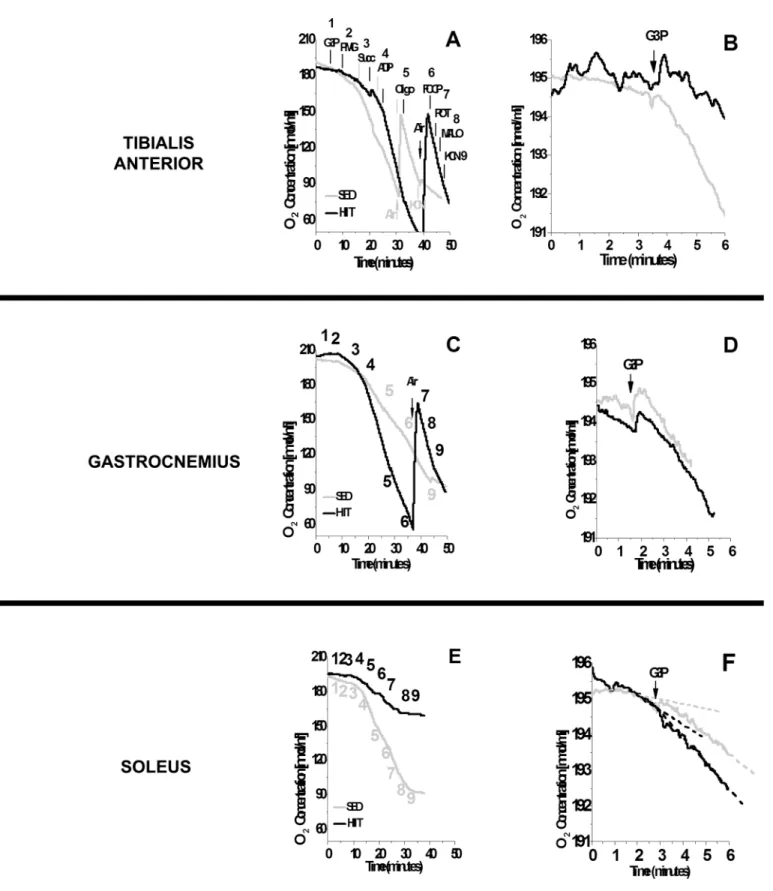
Fig 1illustrates the oxygen depletion rates in the TA (F), GAST (F/S) and SOL (S) after the sequential addition of a multi-substrate regimen (A, C and E), and detailed data are presented specifically for mGPdH activation by G3P (B, D and F). The HIIT protocol promoted a higher rate of oxygen consumption in the presence of G3P/PMG/Succ and ADP in TA (F) and GAST
(F/S) fibers compared to the SED protocol (Fig 1A and 1C). Unexpectedly, there was a reduction
in the rate of oxygen depletion in SOL (S) fibers derived from HIIT-trained rats compared to SED rats (Fig 1E). Interestingly, when G3P was added before the other substrates, there was less
oxygen depletion in TA (F) fibers from HIIT-trained rats (Fig 1B). HIIT did not have an
appar-ent effect in GAST (F/S) and SOL (S) fibers (Fig 1D and 1F). Thus, we analyzed additional fiber
samples from both groups by high-resolution respirometry to confirm these results (Fig 2).
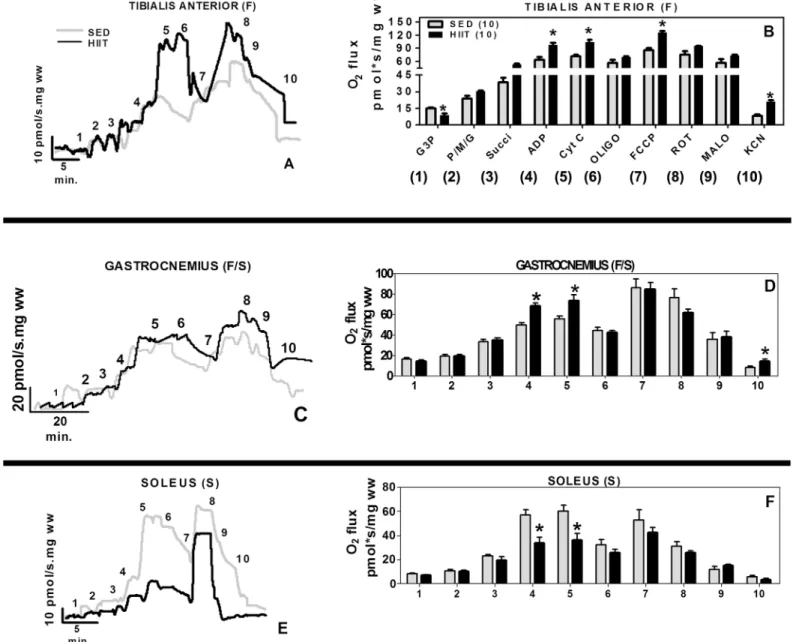
We observed differential effects of training on different muscles, such as the TA (F), GAST
(F/S) and SOL (S) (Fig 2). The multi-substrate respirometry experiments showed that HIIT
increased the respiratory capacity of permeabilized TA muscle fibers but only caused a small
improvement in respiration in the GAST (Fig 2A and 2C, black traces). Unexpectedly, HIIT
reduced the ADP-stimulated respiration in the SOL by more than 40% (Fig 2E, black trace).
The HIIT protocol significantly changed the specific oxygen flux in these muscles (Fig 2B, 2D
and 2F, black bars).
In the TA (F), the G3P-induced oxygen flux was reduced in the HIIT group by approxi-mately 67%, but the ADP/Mg-induced oxygen flux was 1.5-fold higher than the control values
(p<0.05) and was coupled to ATP synthesis (Table 2). The maximal uncoupled flux (ETS flux
capacity) was increased by 1.3-fold relative to the control (p<0.05). In the GAST (F/S), the
ADP/Mg-induced oxygen flux was 1.4-fold higher (p<0.05), and there were no significant
changes in the maximal ETS flux capacity. The residual oxygen consumption (ROX) was 1.5-fold higher compared to that in the controls (p<0.05) (Table 2).
In the SOL (S), the ADP/Mg-induced, respiration-coupled maximal oxygen flux was
decreased by 42% in the HIIT group compared to the SED control group (p<0.05). The
maxi-mal uncoupled respiration was unchanged (Table 2).
Table 2shows the specific changes in oxygen flux induced by substrates of the ETS. These values were derived from the use of ROT (complex I), MALO (complex II) and KCN to esti-mate the fraction of oxygen flux derived solely from mGPdH. This oxygen flux was reduced by
approximately 70% (p<0.05). mGPdH-supported respiration was not affected by the HIIT
protocol in either the GAST or SOL (Table 2).
Relative to the controls, the contribution of complex I to respiration increased (3.0-fold, p<0.05) in the TA muscle fiber preparations, but no differences were observed in the GAST or
SOL fibers (Table 2). Complex II-supported respiration increased in TA fibers (2.7-fold,
p<0.05) and in GAST fibers (1.7-fold, p<0.05), whereas no change was observed in SOL fibers
(Table 2).
Citrate synthase activity
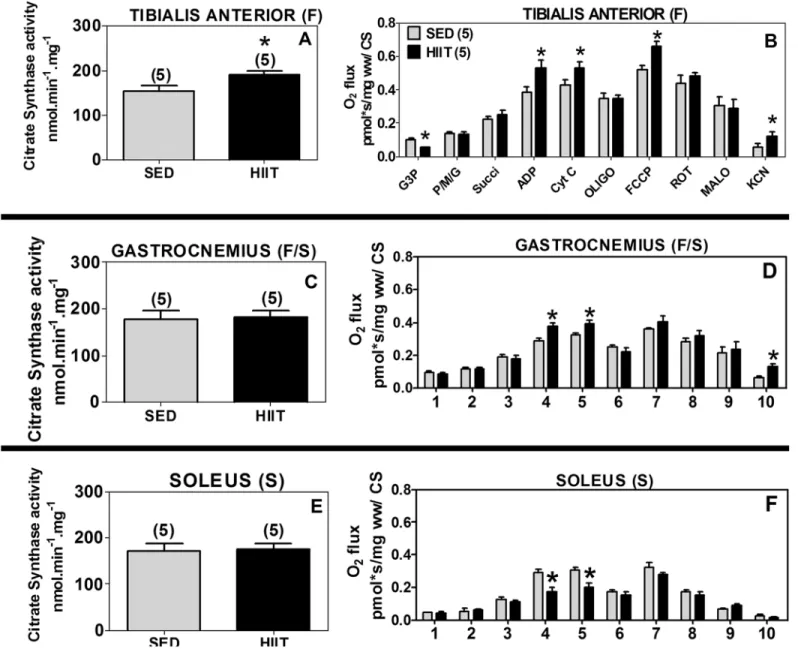
CS activity was measured in the three different muscles as a marker of mitochondrial content.
The specific activity of CS varied among the muscle samples from 150 to 200 nmol.min-1.mg-1
(Fig 3A, 3C and 3E). Despite this variation, the specific activity of CS increased by 1.3-fold in the TA (F) of the HIIT group compared to the SED control group (Fig 3A, p<0.05). The
spe-cific activity of CS did not change in the GAST (F/S) and SOL (S) muscles (Fig 3C and 3E).
Because CS activity represents mitochondrial content and because the activity levels varied by
approximately 30% (Fig 3A, 3C and 3E), all the results were additionally corrected based on CS
Fig 1. Oxygen depletion by different skeletal muscles using multiple substrates (A, C and E) or glycerol phosphate only (B, D and F).(A and B) Tibialis anterior. (C and D) Gastrocnemius. (E and F) Soleus. 1, G3P (10 mM); 2, PMG (5:5:10 mM); 3, Succ (10 mM); 4, ADP (2.5 mM); 5, Oligo (2μg/ml); 6,
FCCP (1μM); 7, ROT (1.0μM); 8, MALO (10 mM); 9, KCN (5 mM). Black (HIIT); gray (SED).
HIIT induces differential oxygen consumption in distinct skeletal
muscles: Data from multiple substrates (glycerol phosphate; pyruvate,
malate, and glutamate; and succinate) normalized to citrate synthase
To confirm the results of mitochondrial respiration normalized per milligram of fresh muscle, which could be affected by mitochondrial content, we normalized the mitochondrial respira-tion results to CS enzyme activity.
In the TA (F), the HIIT protocol was confirmed to decrease the G3P-induced respiration by 43% (p<0.05) and increase the maximum coupled respiration (1.4-fold, p<0.05), maximum Fig 2. Oxygen flux in high-resolution respirometry experiments per fiber mass.(A and B) Tibialis Anterior. (C and D) Gastrocnemius. (E and F) Soleus. 1, G3P (10 mM); 2, PMG (5:5:10 mM); 3, Succ (10 mM); 4, ADP (2.5 mM); 5, CYT C (10μM); 6, Oligo (2μg/ml); 7, FCCP (1μM); 8, ROT (1.0μM); 9, MALO
(10 mM); 10, KCN (5 mM). Black (HIIT); grey (SED). The data are expressed as the mean±standard error.*p<0.05, HIIT vs SED. The number of individual
experiments is in parentheses.
uncoupled respiration (1.3-fold, p<0.05) and non-mitochondrial respiration (2.1-fold,
p<0.05) compared to the SED group (Fig 3B).
In the GAST (F/S), the HIIT protocol also increased the maximum coupled respiration (1.3-fold, p<0.05) and non-mitochondrial respiration (5.0-fold, p<0.05) compared to the SED
group (Fig 3D).
In the SOL (S), the above results validated that the HIIT protocol decreased the maximum
coupled respiration by approximately 39% (p<0.05) compared to the SED group (Fig 3F).
Western blot of OXPHOS content
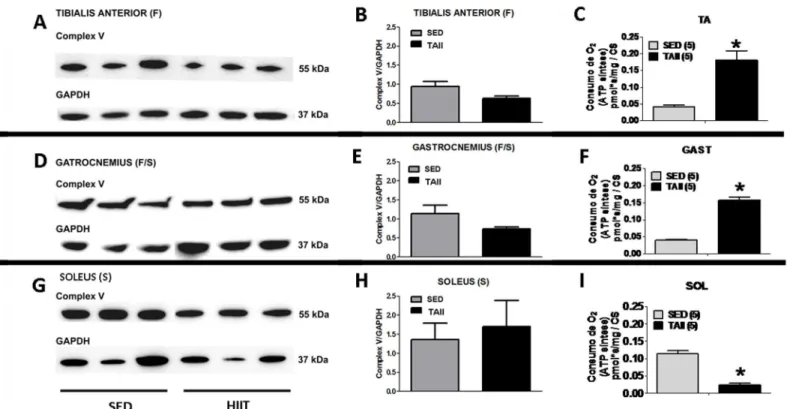
The ATP synthesis capacity, as evaluated by the difference in oxygen flux in the presence of ADP + Pi subtracted to the flux of Oligo (a specific inhibitor of FoF1-ATP synthase), revealed that HIIT improved ATP synthesis in the TA and GAST but decreased ATP synthesis in the SOL (for fibers, seeTable 2; for mitochondrial content, seeFig 3). These results could be ini-tially interpreted as reflecting different complex V content in each mitochondrion. Thus, the
content of theα-subunit of complex V and Oligo-sensitive oxygen flux were compared after
HIIT (Fig 4). No differences were observed in complex V content in the HIIT group compared
to the SED group in the TA (F), GAST (F/S) or SOL (S) (Fig 4B, 4E and 4H, respectively).
Nev-ertheless, the ATP synthesis-related oxygen flux changed in different ways in the various mus-cles. ATP synthesis-related oxygen flux increased 4.5-fold and 4.0-fold in TA and GAST fibers,
respectively, (Fig 4C and 4F) but decreased by almost 80% in SOL fibers in the HIIT group
compared to the SED group (p<0.05) (Fig 4I).
Oxidation of glycerol phosphate
To confirm the G3P oxidation results in the multi-substrate condition, we analyzed each sub-strate separately. When G3P oxidation was normalized to CS activity, we observed a reduction
Table 2. Mitochondrial adaptations evaluated via O2consumption induced by G3P/P/MG/Succ in tibialis anterior (F), gastrocnemius (F/S) and soleus (S) skeletal muscle fibers (pmol O2/s*mg wet weight).
Tibialis anterior (F) Gastro (F/S) Soleus (S)
Group SED (8) HIIT (10) SED (8) HIIT (7) SED (7) HIIT (6)
Glycerol phosphate 13.8±2.4 9.3±2.8* 7.2±1.9 7.8±2.2 8.1±1.1 7.2±1.6
Non-p-state multi 38.5±4.6 47.8±3.1 33.3±2.4 34.9±2.1 23±2.4 20±2.3
Maximal respiration (coupled) 63.6±18.5 98.4±15.2* 49.4±2.6 68.3±3.1* 57.3±8.5 33±11*
Oligo respiration 57.4±16.3 69.8±5.8 44±2.1 42±2.5 32.6±2.3 25.6±6.5
ATP synthesis (O2flow coupled to ATP–O2flow with Oligo) 6.2±2.2 28.5±9.4* 5.2±0.5 26.4±0.5* 24.7±6.2 7.9±4.5* Coupled respiratory control (O2flow ADP/O2flow Oligo) 1.1±0.1 1.4±0.1* 1.3±0.07 1.8±0.1* 1.8±0.5 1.3±0.4*
Proton leak 49.3±7.4 19.5±6.4* 28.1±4.2 19.6±6.4 27.6±2.7 22.3±3.3
Maximal respiration (uncoupled) 85.8±22.3 126.9±10.2* 85.8±9.1 84.3±7.5 53±17 42±10
Uncoupled respiration control 1.0±0.1 2.0±0.2* 1.5±0.1 2.0±0.1* 1.5±0.7 1.5±0.1
Reserve 21.6±7.8 45±10.8 16.9±4.4 19.1±5.2 19.5±4.1 16.5±1.7
Complex I 9.8±3.0 29.8±7.7* 14.4±2.5 18.4±3.4 31±3.4 26±1.7
Complex II 19±2.3 51.9±11.1* 24.1±2.3 41.8±4.9* 12.0±2.2 15.1±1.1
mGPdH 56.7±9.5 18.7±4.2* 11.8±3.8 8.2±1.0 9.1±0.9 11.8±1.7
ROX 8.1±4.7 20.3±2.6* 9.3±2.5 14.1±2.9* 5.7±2.4 4.0±2.5
The number of individual experiments is shown in parentheses. The data are expressed as the mean±standard error.
*p<0.05 vs control.
of approximately 55% (p<0.05) in the non-p-state and approximately 51% (p<0.05) in the
p-state (Fig 5A). These results are in agreement with those obtained in the multi-substrate condi-tion (Fig 3B). Surprisingly, in the GAST (F/S), HIIT did not affect the oxidation of G3P in the
non-p-state, although HIIT stimulated G3P in the p-state by approximately 1.9-fold (p<0.05)
(Fig 5A).
Oxidation of palmitoyl carnitine
Because G3P oxidation decreased after HIIT in the TA but not in the GAST or SOL, we decided to evaluate the effect of HIIT on fatty acidβ-oxidation because this pathway sustains
Fig 3. Citrate synthase (CS) activity and oxygen flux in respirometry experiments normalized to CS activity.(A and B) Tibialis anterior. (C and D) Gastrocnemius. (E and F) Soleus. 1, G3P (10 mM); 2, PMG (5;5;10 mM); 3, Succ (10 mM); 4 ADP (2.5 mM); 5, CYT C (10μM); 6, Oligo (2μg/ml); 7, FCCP
(1μM); 8, ROT (1.0μM); 9, MALO (10 mM); 10, KCN (5 mM). Black (HIIT); gray (SED). The data are expressed as the mean±standard error.*p<0.05, HIIT vs SED. The number of individual experiments is shown in parentheses.
respiration in skeletal muscle mitochondria. Therefore, we measured oxygen consumption in
TA and GAST muscle fibers using only PALM (Fig 5B) after normalization to CS. Surprisingly,
HIIT resulted in a 1.2-fold increase (p<0.05) in the oxygen consumption rate in the p-state of
the TA (F). In GAST muscle fibers, the oxygen consumption rate did not change in either the non-p-state or the p-state (Fig 5B).
Fig 4. Comparison of complex V content (Western blot) and ATP synthesis capacity (oligomycin-sensitive O2consumption) among the three muscles.Western Blots (A, B and C) for the tibialis anterior, (D, E and F) gastrocnemius, and (G, H and I) soleus. GAPDH was used as the loading control. The data are expressed as the mean±standard error.*p<0.05, SED vs HIIT. n = 3 for the blot quantification for both the SED and HIIT groups.
doi:10.1371/journal.pone.0131766.g004
Fig 5. Oxygen flux in mitochondria oxidizing glycerol phosphate (A) in the non-phosphorylated state (non-p-state) and phosphorylated state (p-state) in the tibialis anterior and gastrocnemius, normalized to CS activity. The same experimental protocol was performed using palmitoyl carnitine (B) as a substrate in the tibialis anterior and gastrocnemius with normalization to CS activity. Tibialis Anterior: white (SED) and black (HIIT). Gastrocnemius: light gray (SED) and dark gray (HIIT). The data are expressed as the mean±standard error.*p<0.05, HIIT vs SED. The number of individual experiments (n) is shown based on 5
rats per group.
H
2O
2production in muscle fibers in the presence of glycerol phosphate
and multiple substrates expressed in wet weight (mg) and normalized to
citrate synthase
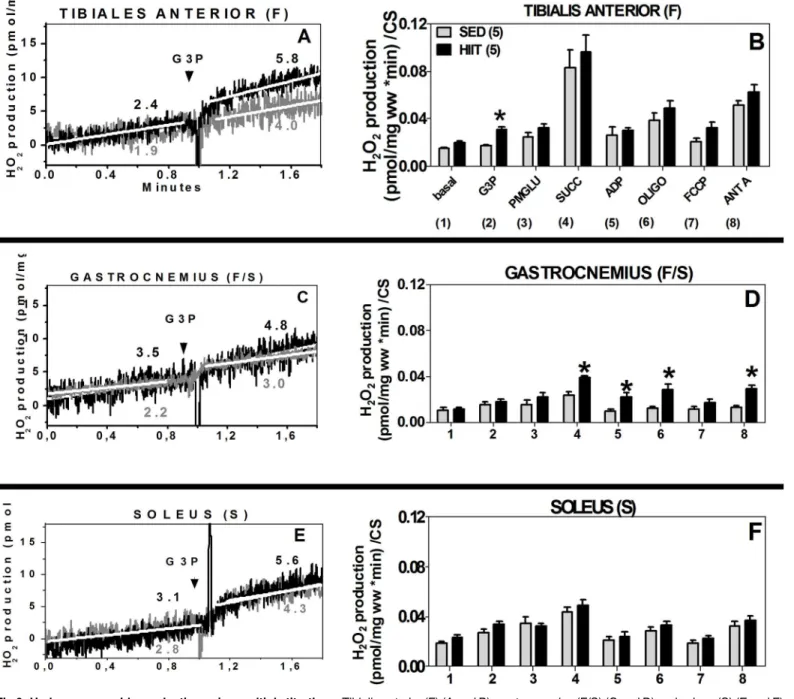
In the SED group, when G3P/PMG/Succ were added together, the rate of H2O2production in
the TA was 3.6-fold higher than that in the GAST and 1.9-fold higher than that in the SOL (Fig
6B, 6D and 6F).
TA (F). The HIIT group showed a 1.3-fold increase in H2O2production at the site of
mGPdH (p<0.05,Fig 6A and 6B). Interestingly, when the data were normalized to CS, H2O2
generation in the presence of G3P only increased 1.8-fold (p<0.05) in the HIIT group
com-pared to the SED group (Fig 6B).
GAST (F/S). The HIIT group exhibited higher H2O2production with the addition of
multi-ple substrates when the data were normalized to CS (Fig 6D). At the site of mGPdH, no
signifi-cant differences were observed (Fig 6C and 6D). H2O2production increased, and there was a
1.6-fold change (p<0.05) in the presence of Succ, which targets complex II. In the presence of
ADP, H2O2production changed by 1.8-fold (p<0.05), and when OXPHOS was inhibited by
Oligo, a 2.2-fold increase was detected (p<0.05). When complex III was inhibited, which
results in conditions that favor semiquinone radical formation, a 2.2-fold change (p<0.05) in
H2O2production was observed (Fig 6D).
SOL (S). When the data were normalized to CS, we did not observe any significant
differences in H2O2production in the presence of G3P (Fig 6E) or of multiple substrates
(Fig 6F).
H
2O
2production in TA and GAST fibers with glycerol phosphate as a
unique substrate
The previous experiments (Fig 6) showed that HIIT enhanced H2O2production in the TA and
GAST; however, increased H2O2generation derived from G3P was observed only in the TA.
Thus, we decided to assess whether the activation, inhibition or uncoupling of OXPHOS could modify the rate of electron leakage in the TA and GAST after HIIT. For this assay, G3P was used as a unique substrate.
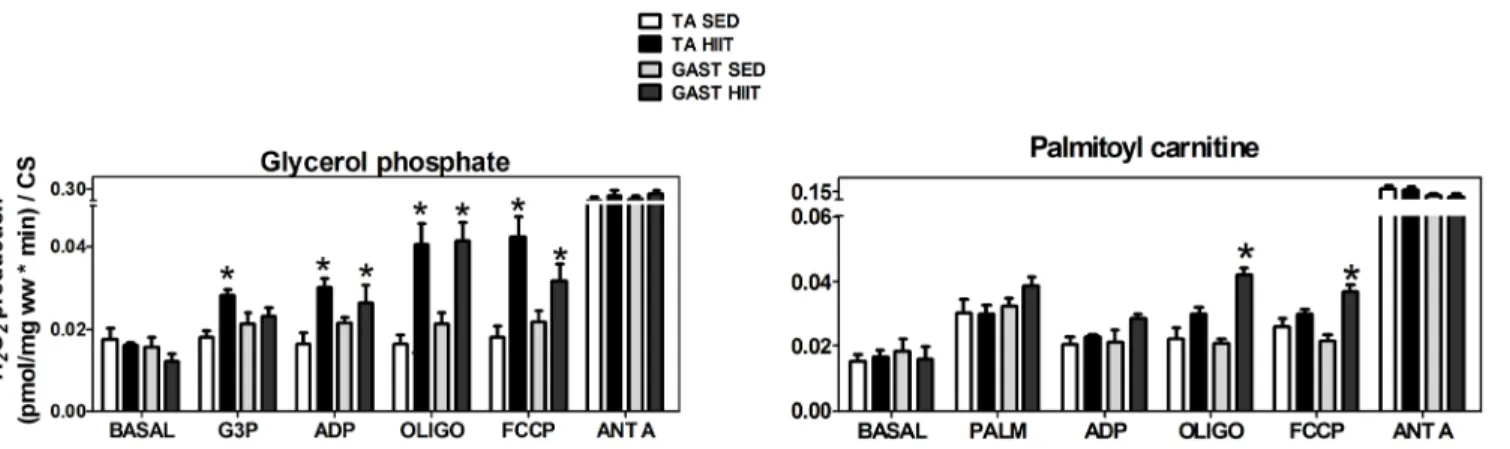
TA (F). The HIIT group exhibited higher H2O2production compared to the SED group
after normalization to CS. H2O2generation increased by 2.5-fold at mGPdH sites (p<0.05), by
1.9-fold (p<0.05) in the presence of ADP, by 2.5-fold (p<0.05) in the presence of Oligo, and
by 2.3-fold (p<0.05) in the uncoupled state. Blocking complex III, which favors semiquinone
radical formation, did not change the maximal H2O2levels (Fig 7A).
In another set of experiments, the effect of HIIT on the G3P-mediated reverse flow of elec-trons to complexes I and II of the ETS in TA muscle fibers was evaluated. We confirmed that
HIIT up-regulated the production of H2O2by mGPdH 1.3-fold (p<0.05) and by ROT 1.4-fold
(p<0.05) compared to the SED group. However, no differences were observed in the reverse
flux of electrons in the ETS from complex I or complex II in response to HIIT (Table 3).
GAST (F/S). H2O2production increased 2.0-fold when OXPHOS was inhibited with Oligo
(p<0.05) and 1.5-fold (p<0.05) in the presence of an uncoupled state in response to FCCP in
the HIIT group. As shown inFig 7A, inhibiting complex III, which favors semiquinone radical
formation, did not change the maximal H2O2generation. In a complementary experiment, we
H
2O
2production by palmitoyl carnitine as a unique substrate in TA and
GAST fibers
Because G3P oxidation was reduced after HIIT in the TA but not the GAST, we evaluated the
effect of HIIT on H2O2production by fatty acidβ-oxidation. Thus, we measured H2O2
produc-tion in TA and GAST muscle fibers using PALM as a unique substrate (Fig 7A).
TA (F). We did not observe any differences using PALM as a substrate after normalization
to CS (Fig 7B, white and black columns). In a complementary experiment, we analyzed the
Fig 6. Hydrogen peroxide production using multiple titrations.Tibialis anterior (F) (A and B), gastrocnemius (F/S) (C and D) and soleus (S) (E and F) normalized to wet weight (mg) or citrate synthase. 1, Basal; 2, G3P (10 mM); 3, PMG (5:5:10 mM); 4, Succ (10 mM); 5, ADP (2.5 mM); 6, Oligo (2μg/ml); 7,
FCCP (1μM); 8, Ant A (5μM). Black (HIIT); grey (SED). The data are presented as the mean±standard error.*p<0.05, HIIT vs SED. The number of individual experiments (n) is shown; 5 rats were included in each group.
reverse flow of electrons from PALM and did not observe any significant differences after HIIT training in any of the H2O2production states (Table 4).
GAST (F/S). In the HIIT group, H2O2production normalized to CS increased when
OXPHOS was inhibited with Oligo (2.1-fold, p<0.05) and in the uncoupled state elicited by
FCCP (1.7-fold, p<0.05). Inhibiting complex III with ANT A did not affect the maximal H2O2
generation (Fig 7B, light gray or dark gray columns). In a complementary experiment, we
ana-lyzed the reverse flow of electrons from PALM and did not observe significant differences after HIIT for any of the H2O2production states (Table 4).
Electron leakage ratio using G3P or multiple substrates (G3P/PMG/
Succ)
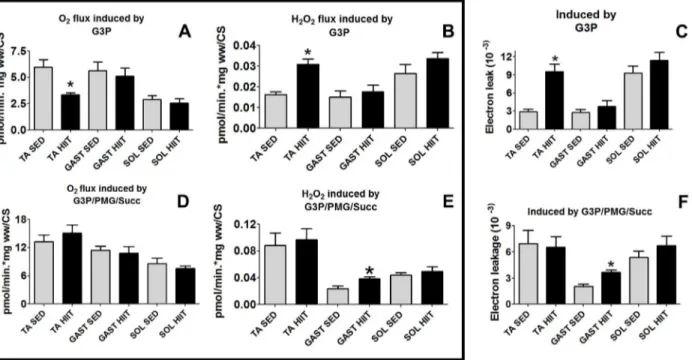
We compared the three skeletal muscle fiber types to evaluate the relative contribution of G3P/ mGPdH and multi-substrate systems to electron leakage in the presence of G3P/PMG/Succ after HIIT (Fig 8). Surprisingly, despite the fact that the fibers showed different rates of H2O2 production and mitochondrial respiration, the highest electron leakage ratio was observed for all the fibers when G3P was used as a unique substrate.
TA fibers in the HIIT group showed the highest difference in the electron leakage ratio with G3P (Fig 8C). The O2flux by G3P was decreased by 44% (Fig 8A); nevertheless, H2O2 produc-tion increased by 1.9-fold (p<0.05) (Fig 8B). Accordingly, after HIIT, H2O2production was
approximately 3.3-fold higher compared to that in the SED group (p<0.05) (Fig 8C).
Fig 7. Hydrogen peroxide production by oxidizing glycerol phosphate (A) or palmitoylcarnitine (B) as unique substrates in the tibialis anterior and gastrocnemius after normalization to CS.Tibialis anterior: white, SED; black, HIIT. Gastrocnemius: light gray, SED; dark gray, HIIT. The data are expressed as the mean±standard error.*p<0.05, HIIT vs SED. The number of individual experiments (n) is shown; 5 rats were included in each group.
doi:10.1371/journal.pone.0131766.g007
Table 3. Production of H2O2induced by glycerol phosphate as a unique substrate and with inhibitors of complexes I and II in the TA and GAST muscles.SED or trained rats (HIIT), normalized to mg ww/CS.
Groups Basal G3P ROT MALO ANT A
TA SED (4) 0.021±0.003 0.024±0.001 0.027±0.003 0.023±0.001 0.146±0.037
HIIT (6) 0.022±0.002 0.029±0.002* 0.036±0.006* 0.026±0.008 0.151±0.050
Gastro SED (4) 0.027±0.002 0.040±0.011 0.045±0.008 0.042±0.009 0.134±0.022
HIIT (6) 0.028±0.008 0.037±0.009 0.042±0.010 0.032±0.008 0.164±0.0050
The number of individual experiments is shown in parentheses. The data are expressed as the mean±standard error.
*p<0.05 vs controls.
In the GAST fibers of the HIIT group, the O2flux by G3P/PMG/Succ did not change (Fig 7D), but H2O2generation increased 1.6-fold (p<0.05) (Fig 8E). Thus, the electron leakage ratio
increased by 1.8-fold (p<0.05) relative to that in the SED group (Fig 8F).
In the SOL fibers, there were no changes in O2flux (Fig 8D) or H2O2production (Fig 8E) by G3P/PMG/Succ; therefore, electron leakage in response to G3P/PMG/Succ did not differ
between the HIIT and SED groups (Fig 8F).
Discussion
HIIT has been widely and increasingly discussed because it is metabolically similar to aerobic training but requires much less time spent on training activities to perform the same work. We confirmed that HIIT results in higher maximum swimming duration, lower body weight and lower indexes of adiposity (measured by visceral fat content and visceral fat percentage) [3,15]. Similar to muscle adaptations after endurance training, some mechanisms have been proposed
Table 4. Production of H2O2induced by PALM as a unique substrate and with inhibitors of complexes I and II in TA and GAST muscles.SED or trained rats (HIIT), normalized to mg ww/CS.
Groups Basal PALM ROT MALO ANT A
TA SED (4) 0.015±0.003 0.028±0.001 0.024±0.001 0.019±0.001 0.043±0.007
HIIT (6) 0.019±0.002 0.026±0.004 0.028±0.004 0.026±0.004 0.045±0.002
Gastro SED (4) 0.013±0.002 0.033±0.005 0.022±0.004 0.023±0.004 0.039±0.007 HIIT (6) 0.018±0.005 0.032±0.007 0.033±0.006 0.029±0.003 0.043±0.013
The number of individual experiments is shown in parentheses. The data are expressed as the mean±standard error.
doi:10.1371/journal.pone.0131766.t004
Fig 8. O2flux normalized to CS, H2O2production normalized to CS, and electron leakage in the presence of G3P or multiple substrates (G3P/PMG/ Succ) for the three muscles.(A) O2flux. (B) H2O2production. (C) Electron leakage from oxidizing G3P. (D) O2flux. (E) H2O2production. (F) Electron
leakage from oxidizing multiple substrates (G3P/PMG/Succ). The data are expressed as the mean±standard error.*p<0.05, HIIT vs controls. The number
of individual experiments (n) is shown based on 5 rats per group. Black (HIIT); white (SED).
by other authors to explain these features of HIIT, such as a higher content of PGC-1α, a higher
amount of GLUT4in the muscle membrane, a higher activity of CS and a higher activity of
AMPK [3,11,30,31] for the epitrochlearis muscle. Because it is expected that endurance train-ing induces adaptations in OXPHOS and antioxidant enzyme capacities, it would be also expected that exercise may affect the total electron leakage of skeletal muscle. However, after
HIIT, mitochondrial oxygen and H2O2flux have not been simultaneously measured in three
muscles used in swimming activities with distinct twitch types.
We show here for the first time that HIIT uses multiple substrate feeders of the ETS to mod-ulate mitochondrial respiratory physiology. HIIT increased OXPHOS respiration in TA (F) and GAST (F/S) skeletal muscle fibers but decreased OXPHOS respiration in SOL (S) fibers. The apparent paradox of decreased OXPHOS respiration in SOL fibers during swimming HIIT could be the result of differences in muscle activation, as has been observed in previous electro-myography studies conducted in rats. The TA (F) is the most recruited muscle in swimming training in rats. The SOL and GAST are used 12% and 23% less, respectively, in swimming
compared to running [32]. Thus, in swimming training, the decreased OXPHOS respiration in
the SOL could represent a transition in muscle adaptation from running to swimming. In addi-tion, the TA and GAST showed decreased glycogen levels of 75% and 50%, respectively, during swimming, demonstrating that these fibers are active [22,23]. In accordance with the
electro-myography data, glycogen levels did not change in the SOL [32]. In addition, blood flow to the
SOL decreases in swimming rats [33]. In other data from hindlimb unweighting experiments,
the SOL lost tetanic contraction in about 60% of cases [34]. It is possible that the decreased oxygen delivery to mitochondria could reduce its capacity to produce ATP, thus decreasing the formation of superoxide anions (O•-) or decreasing the ability of the mitochondria to use sub-strates such as G3P, pyruvate, malate, glutamate and Succ in oxygen flux.
Here, HIIT-trained rats had higher rates of ATP synthesis in the TA (F) and GAST (F/S)
compared to SED controls (Fig 2B and 2D). These results may indicate that the gain in
perfor-mance (endurance time, compared to the SED group) after HIIT correlates with the gain in OXPHOS capacity and ATP turnover. Similar results have been observed in the vastus lateralis (fast/slow twitch) of trained human athletes [35], trained human non-athletes [36] and trained
rats [37]; furthermore, the maximal respiratory capacity has been shown to be higher for
glyco-lytic muscles, a feature that seems to be related to the high expression of PGC-1αprotein and
mRNA. In the present study, a different consequence of training was observed inFig 3. It could
be hypothesized that there would be no difference in respiration normalized to CS after HIIT because TA fibers showed an approximate 30% increase in CS activity. However, the respira-tion rates stimulated by ADP or FCCP were even higher than expected based on mitochondrial biogenesis. Thus, different regulatory mechanisms may be involved in the regulation of OXPHOS after HIIT.
The mGPdH-supported respiration using multi-substrate titrations was lower in the HIIT-trained rats. This result is in agreement with the previously reported low activity levels of this
enzyme [15]. Hoshino et al. [37] demonstrated that HIIT on a treadmill induced higher
amounts of palmitate oxidation in both subsarcolemmal (SS) and intermyofibrillar (IMF) mitochondria isolated from hindlimb muscles. Our results for the TA are in agreement, as the
TA promotes higher mitochondrial respiration of PALM in the phosphorylated state (Fig 5A).
Nevertheless, the respiration changed in the GAST (Fig 5B). This difference might be explained
by the differences in the HIIT protocols (treadmill or swimming), but further studies compar-ing HIIT protocols are needed to clarify this point in detail.
H2O2production using multiple substrates (G3P/PMG/Succ) was higher in fast twitch
I. The use of Succ alone as a substrate (complex II) resulted in detectable differences between the white GAST twitches (WG, primarily type IIB twitches) and the red GAST (RG, type IIA) or SOL (type I) twitches [24].
After HIIT, the TA produced more H2O2than the GAST or SOL muscle twitches (Fig 6B, 6E
and 6H, respectively), despite the fact that the TA has decreased mGPdH activity. These data suggest that HIIT specifically modulates the redox state and/or the complex shuttle and the ETS of skeletal muscle mitochondria. It has been demonstrated that the total antioxidant capacity and lipid peroxidation of the TA is maintained in HIIT-trained rats compared to SED rats [15].
Moreover, a positive correlation between mGPdH activity levels and H2O2production among
different rat tissues has been identified [38]. However, there are currently no studies in which the effects of the HIIT protocol on different muscle fiber preparations accurately mimic the effects of
HIIT in vivo. One possible explanation for the enhanced H2O2production and low activity levels
of mGPdH after HIIT is that the interaction between different complexes of the ETS in TA fibers could alter the reverse electron flux. However, we could not detect any changes in reverse flux (Table 3). Thus, it is possible that the HIIT protocol and low oxygen delivery altered COX and supercomplex assembly factor I (SCAFI) peptide, which are involved in the assembly of super-complexes, including those that contain mGPdH. This would alter the partitioning of electrons
in the mGPdH coenzyme Q-binding pocket in TA skeletal muscle after HIIT [39,40], causing
mGPdH to produce superoxides on either side of the mitochondrial membrane in approximately equal amounts, thereby diverting more superoxides toward the outer side of the inner
mitochon-drial membrane [38]. Further studies to evaluate the interaction of ETS and mGPdH in greater
detail and at higher resolution are necessary to verify these predictions.
There was an increased rate of H2O2production by substrates of complex I (PMG) and II
(Succ) in GAST (F/S) fibers. These results corroborated the increased ROS production in rats after endurance training using the same substrates in vastus lateralis (mixed muscle) [41].
We observed for the first time that HIIT is associated with electron leakage. Impressively,
electron leakage at mGPdH sites was higher only in the TA (Fig 7C). The classical adaptations
to endurance training suggest that the intracellular responses to ROS production are required
for the normal remodeling that occurs in skeletal muscle [42]. Chronic endurance training
reduces oxidative stress and thereby confers protection by increasing antioxidant defenses and
maintaining redox homeostasis in the ETS [42,43]. Curiously, Daussin (20) observed that
endurance training induced activation of mitochondrial respiration, although the total H2O2 generation was unchanged; thus, they concluded that electron leakage decreased and that the
mRNA expression of genes involved in the antioxidant system increased. In contrast, Isner‐
Horobeti et al. [41] demonstrated that electron leakage increased in response to Succ in vastus lateralis (mixed muscle) after endurance training in rats, corroborating our results for the GAST (Fig 8F). However, despite these data, the electron leakage at these sites increased in our
study (Fig 8), and it was expected that these points in the ETS in which H2O2is produced were
important for mediating intracellular ROS production to affect metabolic signaling. In fact, intracellular ROS production is necessary for activating AMPK phosphorylation to control
glu-cose and PGC-1αhomeostasis [44].
Conclusion
HIIT promoted specific alterations in mitochondrial respiration to increase OXPHOS respira-tion in the TA and GAST and decrease this respirarespira-tion in the SOL; furthermore, the producrespira-tion
of H2O2was enhanced in the TA and GAST but was not altered in the SOL. Specifically,
Author Contributions
Conceived and designed the experiments: DR GC AG. Performed the experiments: DR GC ESF CGM AG. Analyzed the data: DR GC ESF CGM EK AG. Contributed reagents/materials/ analysis tools: EK AG. Wrote the paper: DR GC AG. General ideas and conception: GC.
References
1. World Health Organization (WHO) Global Health Risks: Mortality and Burden of Disease Attributable to Selected Major Risks 2009. Geneva, Switzerland: WHO Press.
2. Haskell WL, Lee IM, Pate RR, Powell KE, Blair SN, Physical Activity and Public Health: Updated Rec-ommendation for Adults from the American College of Sports Medicine and the American Heart Associ-ation. Med Sci Sports Exerc 2007. 39: R1423–R1434.
3. Terada S, Yokozeki T, Kawanaka K, Ogawa K, Higuchi M, Ezaki O, et al. Effects of high-intensity swim-ming training on GLUT-4 and glucose transport activity in rat skeletal muscle. J Appl Physiol 2001. 90: R2019–R2024.
4. Medbo JI, Tabata I. Relative importance of aerobic and anaerobic energy release during short-lasting exhausting bicycle exercise. J Appl Physiol 1989. 67: R1881–R1886.
5. Ciolac EC. High-intensity interval training and hypertension: maximizing the benefits of exercise? Am J Cardiovasc Dis. 2012. 2: R102–R100.
6. Currie KD, Rosen LM, Millar PJ, McKelvie RS, MacDonald MJ. Heart rate recovery and heart rate vari-ability are unchanged in patients with coronary artery disease following 12 weeks of high-intensity inter-val and moderate-intensity endurance exercise training. Appl Physiol Nutr Metab. 2013. 38: R644–
R650.
7. Brønstad E, RognmoØ, Tjonna AE, Dedichen HH, Kirkeby-Garstad I, Håberg AK. High-intensity knee extensor training restores skeletal muscle function in COPD patients. Eur Respir J. 2012. 40: R1130–
R1136.
8. Gillen JB, Percival ME, Ludzki A, Tarnopolsky MA, Gibala M. Interval training in the fed or fasted state improves body composition and muscle oxidative capacity in overweight women. Obesity 2013. 21: R2249–R2255.
9. Larsen S, Stride N, Hey-Mogensen M, Hansen CN, Andersen JL, Madsbad S, et al. Increased mito-chondrial substrate sensitivity in skeletal muscle of patients with type 2 diabetes. Diabetologia 2011. 54: R1427–R1436.
10. Picard M, Godin R, Sinnreich M, Baril J, Bourbeau J, Perrault H, et al. The mitochondrial phenotype of peripheral muscle in chronic obstructive pulmonary disease: disuse or dysfunction? Am J Respir Crit Care Med 2008. 178: R1040–R1047.
11. Terada S, Tabata I, Higuchi M, Effects of high-intensity swimming training on fatty acid oxidation enzyme activity in rat skeletal muscle. Jpn J Physiol 2004. 54: R47–R52.
12. Niklas P, Li W, Jens W, Michail T, Kent S. Mitochondrial gene expression in elite cyclists: effects of high-intensity interval exercise. Eur J Appl Physiol 2010. 110: R597–R606.
13. Serpiello FR, McKenna MJ, Bishop DJ, Aughey RJ, Caldow MK, Cameron-Smith D, et al. Repeated sprints alter signaling related to mitochondrial biogenesis in humans. Med Sci Sports Exerc 2012. 44: R827–R834.
14. Tweedie C, Romestaing C, Burelle Y, Safdar A, Tarnopolsky MA, Seadon S, et al. Lower oxidative DNA damage despite greater ROS production in muscles from rats selectively bred for high running capacity. Am J Physiol Regul Integr Comp Physiol 2011. 300: R544–R553. doi:10.1152/ajpregu.
00250.2010PMID:21148474
15. Casimiro-Lopes G, Ramos D, Sorenson MM, Salerno VP. Redox balance and mitochondrial glycerol phosphate dehydrogenase activity in trained rats. Eur. J Appl. Physiol. 2012. 11: R3839–R3846.
16. Brand MD. The sites and topology of mitochondrial superoxide production. Exp Gerontol. 2010. 45: R466–R472.
17. Murphy MP. How mitochondria produce reactive oxygen species. Biochem J. 2009. 1: 417(1):1–13.
doi:10.1042/BJ20081386PMID:19061483
18. Turrens JF. Mitochondrial formation of reactive oxygen species. J Physiol 2003. 552: R335–R344.
19. Powers SK, Wiggs MP, Duarte JA, Zergeroglu AM, Demirel HA. Mitochondrial signaling contributes to disuse muscle atrophy. Am J Physiol Endocrinol Metab 2012. 303: E31–E39. doi:10.1152/ajpendo.
20. Daussin FN, Rasseneur L, Bouitbir J, Charles AL, Dufour SP, Geny B, et al. Different Timing of Changes in Mitochondrial Functions following Endurance Training. Med Sci Sports Exerc 2012. 44: R217–R224.
21. Delp MD, Changping D. Composition and size of type I, IIA, IID/X, and IIB fibers and citrate synthase activity of rat muscle. J Appl Physiol, 1996. 80: R261–R270.
22. Raja G, Bräu L, Palmer TN, Fournier PA. Repeated bouts of high-intensity exercise and muscle glyco-gen sparing in the rat. Exp Biol 2003. 206: R2159–R2166.
23. Nikolovski S, Faulkner DL, Palmer TN, Fournier PA. Muscle glycogen repletion from endogenous car-bon sources during recovery from high intensity exercise in the fasted rat. Acta physiologica scandina-vica 157.4 (1996): 427–434.
24. Anderson EJ, Neufer PD. Type II skeletal myofibers possess unique properties that potentiate mito-chondrial H2O2 generation. Am J Physiol Cell Physiol 2006. 290: R 844–R851.
25. Pesta and Gnaiger High-Resolution Respirometry: OXPHOS Protocols for Human Cells and Permeabi-lized Fibers from Small Biopsies of Human Muscle. Methods Mol Biol. 2012. 810: R25–R58.
26. Kuznetsov AV, Veksler V, Gellerich FN, Saks V, Margreiter R, Kunz WS. Analysis of mitochondrial function in situ in permeabilized muscle fibers, tissues and cells. Nat Protoc 2008. 3: R965–R976.
27. Cavalcanti-de-Albuquerque JPA, Salvador IC, Martins EL, Jardim-Messeder D, Werneck-de-Castro JPS, Galina A, et al. Role of estrogen on skeletal muscle mitochondrial function in ovariectomized rats: a time course study in different fiber types. Journal of Applied Physiology 116.7 (2014): 779–789.
28. Santiago APSA, Chaves EA, Oliveira MF, Galina A. Reactive oxygen species generation is modulated by mitochondrial kinases: correlation with mitochondrial antioxidant peroxidases in rat tissues. Biochi-mie 90.10 (2008): 1566–1577.
29. Bradford Marion M. "A rapid and sensitive method for the quantitation of microgram quantities of protein utilizing the principle of protein-dye binding." Analytical biochemistry 72.1 (1976): 248–254.
30. Kawanaka K, Tabata I, Tanaka A, Higuchi M. Effects of high-intensity intermittent swimming on glucose transport in rat epitrochlearis muscle. J Appl Physiol 1998. 84: R1852–R857.
31. Terada S, Kawanaka K, Goto M, Shimokawa T, Tabata I. Effects of high-intensity intermittent swimming on PGC-1a protein expression in rat skeletal muscle. Acta Physiol Scand 2005. 184: R59–R65.
32. Roy RR, Hirota WK, Kuehl M, Edgerton R. Recruitment patterns in the rat hindlimb muscle during swim-ming. Brain research, 1985. 337(1), 175–178. PMID:4005606
33. Laughlin MH, Mohrman SJ, Armstrong RB. Muscular blood flow distribution patterns in the hindlimb of swimming rats. American journal of physiology. Heart and circulatory physiology 1984. 15.3 H398–
H403.
34. Thomason Donald B, Frank W. Booth. Atrophy of the Soleus muscle by hindlimb unweighting. Journal of Applied Physiology 68.1 (1990): 1–12.
35. Daussin FN, Zoll J, Ponsot E, Dufour SP, Doutreleau S, Lonsdorfer E, et al. Training at high exercise intensity promotes qualitative adaptations of mitochondrial function in human skeletal muscle. J Appl Physiol 2008. 104: R1436–R1441.
36. Little JP, Safdar A, Wilkin GP, Tarnopolsky MA, Gibala MJ. A practical model of low-volume high-inten-sity interval training induces mitochondrial biogenesis in human skeletal muscle: potential mechanisms. J Physiol 2009. 588: R1011–R1102.
37. Hoshino D, Yoshida Y, Kitaoka Y, Hatta H, Bonen A. High-intensity interval training increases intrinsic rates of mitochondrial fatty acid oxidation in rat red and white skeletal muscle. Appl Physiol Nutr Metab 2013. 38: R326–R333.
38. Orr AL, Quinlan CL, Perevoshchikova IV, Brand MD. A refined analysis of superoxide production by mitochondrial sn-glycerol 3-phosphate dehydrogenase. Journal of Biological Chemistry, 2012. 287 (51), 42921–42935. doi:10.1074/jbc.M112.397828PMID:23124204
39. Acin-Perez R, Enriquez JA. The function of the respiratory supercomplexes: The plasticity model. Bio-chimica et Biophysica Acta (BBA)-Bioenergetics, 2014. 1837(4), 444–450.
40. Lapuente-Brun E, Moreno-Loshuertos R, Acín-Pérez R, Latorre-Pellicer A, Colás C, Balsa E, et al. Supercomplex assembly determines electron flux in the mitochondrial electron transport chain. Sci-ence, 2013. 340(6140), 1567–1570. doi:10.1126/science.1230381PMID:23812712
41. Isner‐Horobeti ME, Rasseneur L, Lonsdorfer‐Wolf E, Dufour SP, Doutreleau S, Bouitbir J, et al. Effect
of eccentric versus concentric exercise training on mitochondrial function. Muscle & nerve, 2014. 50 (5), 803–811.
43. Gore M, Fiebig R, Hollander J, Leeuwenburgh C, Ohno H, Ji LL. Endurance training alters antioxidant enzyme gene expression in rat skeletal muscle. Can J Physiol Pharmacol 1998. 76: R1139–R1145.