YÖNETİM VE EKONOMİ Yıl:2013 Cilt:20 Sayı:1 Celal Bayar Üniversitesi İ.İ.B.F. MANİSA
Political Business Cycles in Turkey: A Fiscal Approach
Yrd. Doç. Dr. Mesut KARAKAŞ
Gebze Yüksek Teknoloji Enstitüsü, İşletme Fakültesi, İktisat Bölümü, KOCAELİ
ABSTRACT
Political business cycle studies have arisen as alternatives to pure business cycle studies. The studies in the political business cycle area mainly try to answer the question that whether the voters are manipulated in election periods or not. Also, the methods which the politicians use to be re-elected are uncovered. In this paper, we ask the question whether there are opportunistic political business cycles in Turkey or not. Our study focuses on the fiscal policies to discover the Turkish case. We use simple but powerful time series models in ARMA context to discover the relationships between political business cycles and fiscal variables. Empirical results show that there are quite perfect opportunistic political business cycles in Turkey.
Key Words: Political business cycles; Time series analysis; Turkish political economy
JEL Classification: E5; E6; H2; H3
Türkiye’de Politik İş Çevrimleri: Mali Bir Yaklaşım
ÖZET
Politik iş çevrimi araştırmaları yalın iş çevrimi araştırmalarına alternatif olarak
doğmuştur. Politik iş çevrimleri alanındaki araştırmalar seçmenlerin seçim dönemlerinde manipüle
edilip, edilmediği üzerine yoğunlaşmaktadır. Ayrıca, politikacıların tekrar seçilmek için
kullandıkları metodlar açığa çıkarılmaktadır. Bu makalede, Türkiye’de fırsatçı politik iş
çevrimlerinin olup, olmadığına cevap aranmaya çalışılmıştır. Araştırmamız Türkiye’deki durumu
belirlemek için mali politikalara odaklanmıştır. Politik iş çevrimleri ve mali değişkenler arasındaki
ilişkileri keşfetmek için ARMA bağlamında basit ama güçlü zaman serisi modelleri kullanılmıştır.
Ampirik sonuçlar Türkiye’de mükemmele yakın politik iş çevrimlerinin olduğunu göstermektedir.
Anahtar Kelimeler: Politik iş çevrimleri; Zaman serisi analizi; Türkiye Politik Ekonomisi
JEL Sınıflaması: E5; E6; H2; H3
I. INTRODUCTION AND LITERATURE SURVEY
The history of political business cycle theory contains nearly a 30 years time span. First studies covered mostly United States and, later, these studies extended to OECD countries. Developing countries are mostly investigated via political business cycle concepts to make comparisons among democratic and developed countries.
of all, economy and economic variables have utmost effect on elections. Secondly, being aware of that fact, politicians try to manipulate the economy to be re-elected. As a result, the economy goes throughout a cyclic behavior where, there are booms in the economy some time before the elections and, afterwards, contractions hit the economy. Thus, economic contractions are not let to be created endogenously but manipulated exogenously.
Fair (1978) went deeper into the political manipulation in USA. He derived that election outcomes related to two macro economic variables. One of them is the real per capita GNP, and the other is unemployment. Other macro indicators happen to be unrelated with political business cycles. Moreover, his results support the fact that a 1% increase in the growth rate increases the votes of the current government nearly 1%. Also, Fair concluded that the voters discount past performance of the government with a high rate so they look only one or two years before to evaluate the performance of the government.
Even though, empirical studies were made for the political business cycles, the theoretical framework was developed in Nordhaus1 (1975) and, later, empirical studies began to be made by means of Nordhaus model. Also, our empirical study is based on the basic Nordhaus opportunistic political business cycle theory, but it covers a wide range of macroeconomic variables and macroeconomic policy instruments. Nordhaus’ model takes its framework from the Philips curve. In his set up, where voters are identical and exemplified by a representative voter, they prefer low unemployment accompanied by low inflation. Moreover, the voters have short memories of past i.e. they have high discount rates. They also build their expectations adaptively i.e. they have no foresight. On the other hand, politicians have only the demand for the re-election and do not consider the stability of the economy as their primary goal. Thus, politicians, who have strong desire to stay in the office for one more period, use expansionary monetary policy before the elections so that unemployment falls through money growth. Because of the slow adjustment mechanism related to adaptive expectations, the inflation rate adjusts some time after the elections. As a result, a period of low unemployment accompanied with low inflation rate is created by the politician to increase the probability of the re-election. Afterwards, the inflation adjusts and the politician tries to decrease it by means of contraction in the money supply. The fight with inflation continues till the next election nears. Before the next election, the politician manipulates the economy to increase his chance of re-election as before. As a result, the economy goes throughout contractions and expansions related to political interventions.
Nordhaus model encounters two major criticisms. First of all, even at that time, it overrides the independence of central bank and attaches full power to the politicians on the monetary policy. However, Drazen (2000a) and Drazen (2000b) point out that, central banks accommodate to the political pressure from
1
governments to prevent a sharp rise on the interest rates at the times of election. Thus, this criticism can be relaxed to some extend and does not create too much of a problem. Moreover, the effect of the politicians on the macroeconomic outcomes isn’t the dominant power, but it is the policy instruments that dominate the macroeconomic outcomes2. The second criticism is related to the irrationality assumption on the side of the voters. In Drazen (2000a) and Drazen (2000b), the irrationality of the electors explained with an example of a representative voter. If the voter lives more than one election cycle, she or he will know that a period of low unemployment and inflation before the election will be followed by a period of high inflation and low economic growth. Thus, it is impossible for the politician to fool the voters all of the time, since any voter who lived more than one election period will not reward the politician, on the other hand, he or she will be punishing the politician in the next election. As a result, the politicians will not engage in opportunistic political manipulation and the electoral business cycle disappears. The rationality of the voters is added to political business cycle models by the works Rogoff and Sibert (1988) and Rogoff (1990) in partisan political cycle framework.
Based on Nordhaus model, many empirical tests were made. Allesina et al. (1997) investigated the unemployment, GDP, inflation and political business cycle relation. They found that there is no relation between unemployment and political business cycles in USA. On the other hand, the possibility of relation between GDP and political business cycles are not rejected. In an another work Alessina et al. (1992), 18 OECD countries were researched and found that there is a strong link between inflation and political business cycles in Italy, Germany, France, Denmark, and New Zealand. In a different work, Haynes and Stone (1989), found a four year cycle on GNP and unemployment which coincides with the timing of elections.
Nordhaus model established the framework not only for unemployment, GDP, and inflation but also created the idea to test the macroeconomic policy instruments like money supply and transfer payments. Allesina et al. (1992), Grier (1989), and Williams (1990) found that the timing of an election has significant effect on money growth. Coming to the other aspect of policy instruments, there is somehow clear evidence for the fiscal transfers before the elections. Alessina et al. (1992) and Allesina and Roubini (1992) point out the cyclic behavior in transfers that overlaps with election timing. However, they do not find any other evidence that manipulation of voters is related to any other fiscal instruments. Keech and Pak (1989), also, underlined the cyclic behavior on veterans’ benefits and social security payments in USA, but they concluded that this mechanism to manipulate the voters is not used any more.
The Nordhaus model is developed further in the political business cycle framework. However, these developments erased its opportunistic side and gave
2
rise to partisan models. The first partisan political business cycle was introduced by Hibbs (1977). Afterwards, Allesina (1987) and Allesina (1988) introduced the rational expectations into the partisan models and created rational partisan models.
In Turkey, the existence of opportunistic political business cycles was studied in a small number of works. Even in the case of pure business cycles, there isn’t a huge literature concerning Turkey. Thus, we will briefly touch to the empirical works related to Turkey.
Tutar and Tansel (2000) analyzed the budget deficits and political business cycles in Turkey. Using monthly and quarterly data on budget deficits and fiscal instruments and including the number of fiscal authorities, they concluded that political business cycles exist in Turkey. Moreover, Tutar and Tansel (2000) mention that their study which is based on annual data gave no results since the effect of elections vanished in the annual data. Kuzu (2001) used Arima models with many independent variables to conclude that there are opportunistic political business cycles in Turkey for a wide range of variables like central bank credits, currency issued, and M1 supply etc. Asutay (2004) covers a small range of time interval because of data insufficiency and points out that Turkish governments use both monetary and fiscal policies to buy votes to be re-elected. Sezgin (2007), using yearly data and ordinary least squares, analyzed both political outcomes and political instruments in relation with political business cycles. She found that, between 1950 and 2003, there are political business cycles in Turkey. Moreover, she underlines that the public expenditure and budget deficit increase in election periods and economic growth is hurt by elections.
Before analyzing political business cycles, we should eliminate the possibility where the overall good performance of economy governs the election timing, since we propose, based on Nordhaus model, that macro economy is driven by elections by means of manipulation. On the other hand, good macro conditions can give rise to early elections, so that good economic conditions push politicians to shift the election timing to an earlier date. In such a case, there is no need to manipulate economy through opportunistic political business cycles. Thus, what we should have is that the early elections should stem from the bad economic conditions and some other factors like coalitions. The works mentioned above mostly ignored this aspect. Because of that, in the next section, we will investigate how economic conditions affect the early elections. We will set up the methodology to discuss political business cycles in section 3 and analyze political business cycles on fiscal variables in section 4. At the end, we will conclude whether there are opportunistic political business cycles in Turkey or not.
II. WHAT IS THE PROBABILITY OF AN EARLY ELECTION IN TURKEY: A PROBIT MODEL APPROACH
election when economic conditions are favorable, which is the case of opportunistic election timing. To investigate the political business cycles, the researcher should not have opportunistic election timing. This means when times are good (economic conditions are well), the probability of an early election should diminish.
In the literature, the existence of opportunistic election timing is determined via Hausmann Test. Berument and Heckelman (1998) used this method for UK and Japan. However, for the Turkish case, the model is hard to apply since there is a need to define instrumental variables which contain government approval rate. Because such statistics are not collected in Turkey, it is not possible to test the existence of opportunistic election timing. Moreover, if some other instruments are used in the testing procedure, it will always create the possibility of misspecification in the instrumental variable sets.
In this work, we will pursue a different way to investigate the existence of opportunistic election timing. A probit approach will be utilized to show that when times are good there is no desire to make early elections in Turkey. On the other hand, when times are bad, the possibility of an early election increases.
The probit model is a binary choice model (Johnston and Dinardo, 1997). The dependent variable yi takes the value of either one or zero depending on a
latent variable yi*:
*
i i i
y = X
β ε
+where,
ε
i distributed as (0,Nσ
2) and yi =1 if y*i >0 and yi =0 otherwise. Then,Pr(y xi | , ) 1i
β
= − −φ
( xiβ
)=φ β
(xi ). whereφ
is cumulative standard normal distribution.In our model dependent variable is election (ELEC1) and its probability is determined via quarterly change in real gdp per capita (CRGDPCAP) and coalition formation (COAN). The COAN variable is taken -1, if there is only one ruling party in the government; it is taken 0, if there is two ruling parties in government; and if there are more than two ruling parties in government, it is taken 1. In this model, also, lags of quarterly change in real gdp per capita are used, since both current change in real gdp per capita and past changes in real gdp per capita have effects on early elections.
Table 1: Probit Model Output for the Period 1969Q2-2007Q3
Dependent Variable ELEC1
Variables Coefficient Probability
CRGDPCAP -0.08 0.00
CRGDPCAP(-1) -0.07 0.00
CRGDPCAP(-2) -0.08 0.00
CRGDPCAP(-3) -0.06 0.00
COAN 0.27 0.03
In the output, the coefficients of all variables are significant at 0.05 level. Moreover, change in real gdp per capita for current, one quarter, two and three quarters before the elections have negative signs, so that any decrease in real gdp per capita compared to previous quarter increases the possibility of an early election. On the other hand, increases in real gdp per capita decrease the possibility of an early election.
In addition, the formation of government has a very important impact on early elections. If more and more parties establish the government, the possibility of an early election increases with the number of parties in the coalition.
Because lags of change in real gdp per capita affect the probability of an early election negatively, we conclude that early elections are not made when times are good. On the other hand, when times are bad, the possibility of early election increases. Thus, there is no opportunistic election timing in Turkey. As a result, there is the possibility of political business cycles to manipulate the low performing economy and fool the voters. Now, it is possible for us to search for the signs of political business cycles.
III. A SIMPLE METHODOLOGY TOWARDS COMPLEXITY: AUTO REGRESSION
A. AR(1) Method
In this paper, the series will be de-trended and seasonally adjusted via X12. For the adjustments, additive method is used. After adjusting the data series, the stationarity of the final series is checked utilizing unit root test. Here, the augmented dickey fuller test is applied and all the de-trended and seasonally adjusted series are found to be stationary. This result is actually expected a priori since most economic data follow a simple linear trend with seasonal changes throughout the year.
After the confirmation of the stationarity, we proceed in the way that is given in Drazen (2000a). According to Drazen (2000a) most empirical studies are performed by means of;
0 1
s
t i t i j jt t t
i j
y a y− b b x dPDUM
ε
=
=
∑
+ +∑
+ +where, y is outcome variable such as gdp, xj are other economic variables that
may also affect y and PDUM is a political dummy variable which is meant to represent a political model.
In this study, other economic variables called xj are excluded since the
paper investigates the existence of opportunistic political business cycles. But, the lagged values of dependent variable will be important in the ARMA context, since future dependent variables are considerably governed by the past values.
The next step is to check autocorrelation function and partial autocorrelation function to make a decision on AR and MA terms. As this process is completed for each data series, it is clear from the correlograms that the partial autocorrelation function vanishes after one lag and autocorrelation function diminishes to zero at a considerable pace. Thus, the proper model for this setup becomes auto regression of order one.
A simple AR(1) process is given in Johnston and Dinardo (1997) as:
'
t t t
y = x
β
+u1
t t t
u =
ρ
u− +ε
and after some adjustment it becomes;
' '
1 ( 1)
t t t t t
y =
ρ
y− + X −ρ
X −β ε
+which establishes the basic framework of our study, since (Xt'−
ρ
Xt'−1)=0 in this work. So adding election dummy, the procedure that will be followed becomes;1
t t t t
y =
ρ
y− +α
PDUM +ε
B. Data
pattern of the political manipulation in the economy to create political business cycles.
The earliest beginning date for the data set is 1957. Even though we had the chance to go further in the past, it will be inappropriate since the political system of young Turkish democracy is just trying to stand up after a crawling period. On the other hand, the ending date for the data sets is the first quarter of the year 2008. This fact is caused by the limitation on the probit model and stems from Turkish Statistical Institute’s change on the calculation of the GDP series. Since we cannot test opportunistic election timing further in the time interval 2008-2011, the data sets are truncated to the first quarter of the year 2008.
Our dependent variables are budget deficit, public investment, government expenditure, tax income, transfer payments except interest payments, and central bank credits to the government. Because of the usage of different data resources, we aren’t able to extend all data sets to the earliest point in the time. Thus, we worked on the original data sets without truncating them to a common starting date. Moreover, because we also interested in real variables, the time coverage of real variables is changed with respect to the deflator starting date.
The time coverage of the data sets is summarized below in Table 2:
Table 2: Time Coverage of Data Sets
Variable Nominal Coverage Real Coverage
Budget Deficit 1969Q2-2008Q1 1969Q2-2008Q1
Public Investment 1978Q2-2008Q1 1978Q2-2008Q1
Government Expenditure 1969Q2-2008Q1 1969Q2-2008Q1
Tax Income 1957Q2-2008Q1 1964Q2-2008Q1
Transfer Payments except Interest Payments 1978Q2-2008Q1 1978Q2-2008Q1
Central Bank Credits to the Government 1986Q2-2003Q1 1986Q2-2003Q1 One interesting point in the table is the situation of central bank credits to the government. Because central bank credits are diminished considerably after 2003, the data set is not extended to 2008. This is strongly related to the independence of central bank and its policy change towards inflation targeting.
Fiscal data is mainly collected from Monthly Consolidated Budget Expenditure and Income Realization (1957-1993) (1993) book of Finance Ministry and EVDS system of Central Bank of Turkey. General Election Dates of Turkey is collected via Belge.net and given in Table 3:
Table 3: General Election Dates in Turkey
Election # Date Election # Date
Election #1 02.05.54 Election #8 06.11.83
Election #2 27.10.57 Election #9 29.11.87
Election #3 15.10.61 Election #10 20.10.91
Election #4 10.10.65 Election #11 24.12.95
Election #5 12.10.69 Election #12 18.04.99
Election #6 14.10.73 Election #13 03.11.02
According to the general election dates, we define election dummies that will replace PDUM variable in the equation of;
1
t t t t
y =
ρ
y− +α
PDUM +ε
(1) Then, since we have chosen dummies based on elections, our equation becomes;1 #
t t t t
y =
ρ
y− +α
ELEC +ε
(2) ELEC# have 15 forms related to the election quarters as ELEC1,…, ELEC15. These forms are defined by:ELEC1: It takes the value of 1 in the election quarter and 0 otherwise.
ELEC2: It takes the value of 1 one quarter before the election quarter and 0 otherwise.
ELEC3: It takes the value of 1 two quarter before the election quarter and 0 otherwise.
ELEC4: It takes the value of 1 three quarter before the election quarter and 0 otherwise.
ELEC5: It takes the value of 1 four quarter before the election quarter and 0 otherwise.
ELEC6: It takes the value of 1 one quarter after the election quarter and 0 otherwise.
ELEC7: It takes the value of 1 two quarter after the election quarter and 0 otherwise.
ELEC8: It takes the value of 1 three quarter after the election quarter and 0 otherwise.
ELEC9: It takes the value of 1 throughout the election quarter and one quarter
before election quarter; it takes 0 otherwise.
ELEC10: It takes the value of 1 throughout election quarter, one quarter and
two quartersbefore the election quarter; it takes 0 otherwise.
ELEC11: It takes the value of 1 throughout the election quarter, one quarter,
two quarters and three quartersbefore the election quarters; it takes 0 otherwise.
ELEC12: It takes the value of 1 throughout election quarter, one quarter, two
quarters, three quarters and four quartersbefore the election quarters; it takes 0
otherwise.
ELEC13: It takes the value of 1 throughout one quarter and two quarters after
the election quarters; it takes 0 otherwise.
ELEC14: It takes the value of 1 throughout one quarter, two quarters and three
quartersafter the election quarters; it takes 0 otherwise.
ELEC15: It takes the value of 1 throughout one quarter, two quarters, three
quarters and four quartersafter the election quarters; it takes 0 otherwise.
matrix since each different dummy vectors tend to create dependent vector sets. Because of that, we allowed no more than one dummy in each empirical setup.
IV. EMPIRICAL RESULTS A. Budget Deficit
Taking budget deficit data as the dependent variable and running the regression equation (2) above with election dummies for the period 1969Q2-2008Q1, we derived three important conclusions. First of all, the coefficient of ELEC1 variable is statistically significant and has a negative sign in the equation 1 on the Table 4 below. This shows that the budget gives deficit in the election quarters. Secondly, in the equation 2 in Table 4, the coefficient of ELEC3 is statistically significant and has a positive sign. This points out that the budget gives a surplus two quarter before election quarters. Thirdly, in the equation 3 in Table 4, the coefficient of ELEC9 is statistically significant and has a negative sign which means that budget gives deficit both in the election quarters and one quarter before the elections. Thus, it is proper to conclude that government budget is affected by the elections and it gives deficit between 3 and 6 months before the election date. As a result, it is clear that politicians in Turkey give reaction between 3 and 6 months time prior to an election and manipulate the economy by means of government budget.
Table 43: Empirical Results on Budget Deficit for the Period 1969Q2-2008Q1
Equation 1 Equation 2 Equation 3
Dependent
Variable Budget Deficit
Dependent
Variable Budget Deficit
Dependent
Variable Budget Deficit
Variables Coef. Prob. Variables Coef. Prob. Variables Coef. Prob.
C -1450 0.98 C -85871 0.22 C 3943 0.96
ELEC1 -718537 0.05 ELEC3 598391 0.10 ELEC9 -401360 0.08
AR(1) -0.42 0.00 AR(1) -0.42 0.00 AR(1) -0.42 0.00
Adj. R^2 0.18 Adj. R^2 0.18 Adj. R^2 0.18
As a robustness check, we shortened the time coverage of budget deficits to the period of 1986Q1-2008Q1.The results of prior investigation didn’t change i.e. the coefficients of ELEC1, ELEC3, and ELEC9 variables are statistically significant and have negative, positive, and negative signs respectively. The outputs related to them are given in equations 1, 2, and 3 in Table 5. Thus, the results on the 1986Q1-2008Q1 interval are the same with the results on 1969Q2-2008Q1 interval.
3
Table 5: Empirical Results on Budget Deficit for the Period 1986Q1-2008Q1
Equation 1 Equation 2 Equation 3
Dependent
Variable Budget Deficit
Dependent
Variable Budget Deficit
Dependent
Variable Budget Deficit
Variables Coef. Prob. Variables Coef. Prob. Variables Coef. Prob.
C -2591 0.98 C -151435 0.22 C 6924 0.96
ELEC1 -1196699 0.05 ELEC3 1011091 0.10 ELEC9 -668988 0.09
AR(1) -0.42 0.00 AR(1) -0.42 0.00 AR(1) -0.42 0.00
Adj. R^2 0.19 Adj. R^2 0.20 Adj. R^2 0.18
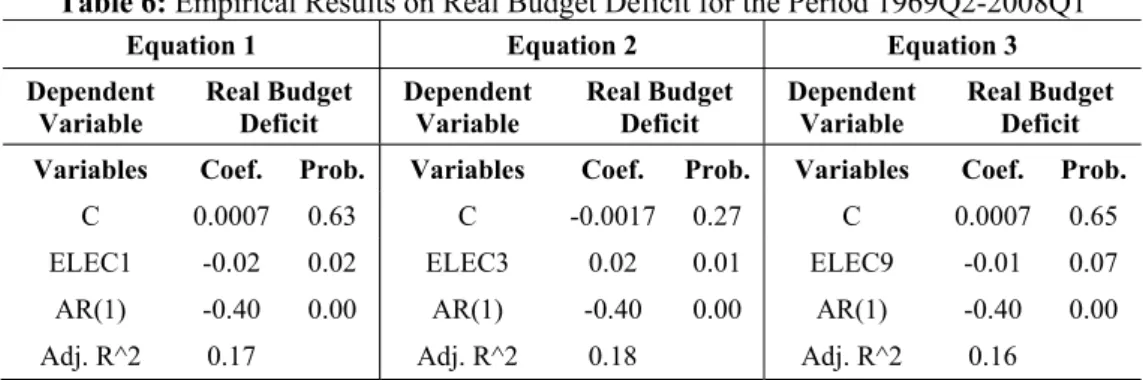
As a different view, the real budget deficits and elections are investigated in time interval 1969Q2-2008Q1 and given in the equations 1, 2, 3 in Table 6. The results of prior works are repeated and found that the coefficients of ELEC1, ELEC3, and ELEC9 variables on real budget deficits are statistically significant and have negative, positive, and negative signs respectively.
Table 6: Empirical Results on Real Budget Deficit for the Period 1969Q2-2008Q1
Equation 1 Equation 2 Equation 3
Dependent Variable
Real Budget Deficit
Dependent Variable
Real Budget Deficit
Dependent Variable
Real Budget Deficit
Variables Coef. Prob. Variables Coef. Prob. Variables Coef. Prob.
C 0.0007 0.63 C -0.0017 0.27 C 0.0007 0.65
ELEC1 -0.02 0.02 ELEC3 0.02 0.01 ELEC9 -0.01 0.07
AR(1) -0.40 0.00 AR(1) -0.40 0.00 AR(1) -0.40 0.00
Adj. R^2 0.17 Adj. R^2 0.18 Adj. R^2 0.16
Moreover, if the time interval is shortened for real budget deficits to 1986Q1-2008Q1, the results do not change too much, except that ELEC9 is now not significant at 10% level. The results can be seen in the equations 1, and 2 in Table 7.
Table 7: Empirical Results on Real Budget Deficit for the Period 1986Q1-2008Q1
Equation 1 Equation 2
Dependent Variable Real Budget Deficit Dependent Variable Real Budget Deficit
Variables Coef. Prob. Variables Coef. Prob.
C 0.0016 0.54 C -0.0023 0.39
ELEC1 -0.03 0.03 ELEC3 0.03 0.03
AR(1) -0.40 0.00 AR(1) -0.39 0.00
To sum up, politicians manipulate the economy via budget deficits between 3 and 6 months prior to elections and these manipulation efforts last at most during two quarters.
B. Government Expenditure
The effects of elections on government expenditure don’t seem to be very clear, when the methodology defined above is applied. If nominal expenditure is taken as the dependent variable for the period of 1969Q2-2008Q1, then the coefficient of ELEC13 variable is found to be statistically significant with negative sign in the equation 1 in Table 8. This explains us that government expenditure decreases during two quarters after the election quarters.
As a robustness check, we shortened the time coverage of government expenditure to the period of 1986Q1-2008Q1. The results of prior investigation didn’t change i.e. the coefficient of ELEC13 variable is found to be statistically significant with negative sign in the equation 1 in Table 9.
Table 8: Empirical Results on Government Expenditure for the Period 1969Q2-2008Q1
Equation 1
Dependent Variable Government Expenditure
Variables Coef. Prob.
C 230615 0.28
ELEC13 -1122986 0.09
AR(1) -0.38 0.00
Adjusted R^2 0.15
Table 9: Empirical Results on Government Expenditure for the Period 1986Q1-2008Q1 Equation 1
Dependent Variable Government Expenditure
Variables Coef. Prob.
C 405197 0.28
ELEC13 -1897412 0.10
AR(1) -0.39 0.00
Adjusted R^2 0.15
of ELEC1 is found to be statistically significant with positive sign, thus nothing changed and our model seems to be robust in the equation 1 in Table 11.
Table 10: Empirical Results on Real Government Expenditure for the Period 1969Q2-2008Q1
Equation 1
Dependent Variable Real Government Expenditure
Variables Coef. Prob.
C 0.0044 0.36
ELEC1 0.04 0.09
AR(1) -0.18 0.03
Adjusted R^2 0.04
Table 11: Empirical Results on Real Government Expenditure for the Period 1986Q1-2008Q1
Equation 1
Dependent Variable Real Government Expenditure
Variables Coef. Prob.
C 0.0075 0.37
ELEC1 0.0619 0.10
AR(1) -0.17 0.10
Adjusted R^2 2.02
To sum up, politicians diminish government expenditure at least for two quarters compared to previous periods after the election quarters. Moreover, real government expenditure is increased by politicians in the election quarters, and that supports the existence of an opportunistic motive in government expenditure.
C. Public Investment
Table 12: Empirical Results on Public Investment for the Period 1978Q2-2008Q1
Equation 1 Equation 2
Dependent Variable Public Investment Dependent Variable Public Investment
Variables Coef. Prob. Variables Coef. Prob.
C 15081 0.18 C 13935 0.20
ELEC6 -113512 0.05 ELEC7 -98322 0.10
AR(1) -0.32 0.00 AR(1) -0.36 0.00
Adjusted R^2 0.12 Adjusted R^2 0.11
Equation 3 Equation 4
Dependent Variable Public Investment Dependent Variable Public Investment
Variables Coef. Prob. Variables Coef. Prob.
C 18118 0.11 C 18896 0.10
ELEC13 -84501 0.02 ELEC14 -62735 0.04
AR(1) -0.34 0.00 AR(1) -0.33 0.00
Adjusted R^2 0.13 Adjusted R^2 0.12
The repetition of the same model for the period of 1986Q1-2008Q1 revealed no different results in the equations 1, 2, and 3 in Table 13 except that the coefficient of ELEC7 is now found to be not statistically significant. Thus, the manipulative behavior motive of politicians is partially determined on the public investment.
Table 13: Empirical Results on Public Investment for the Period 1986Q1-2008Q1
Equation 1 Equation 2 Equation 3
Dependent Variable
Public Investment
Dependent Variable
Public Investment
Dependent Variable
Public Investment
Variables Coef. Prob. Variables Coef. Prob. Variables Coef. Prob.
C 20660 0.17 C 24994 0.10 C 26089 0.10
ELEC6 -137208 0.07 ELEC13 -103231 0.03 ELEC14 -78191 0.05
AR(1) -0.32 0.00 AR(1) -0.34 0.00 AR(1) -0.34 0.00
Adj. R^2 0.12 Adj. R^2 0.13 Adj. R^2 0.12
D. Tax Income
elections, politicians may lack time to play with tax rates or tax structure to manipulate the economy and voters.
E. Transfer Payments
Transfer payments are popular means of economic manipulation. Politicians are willing to use this instrument prior to elections to increase their probability to be re-elected. If transfer payments are taken as the dependent variable in our usual empirical setup, the coefficient of ELEC1 is statistically significant and has positive sign for the period of 1978Q2-2008Q1 in the equation 1 in Table 14. This shows us that the economy is manipulated via transfer payments in the election quarter.
Table 14: Empirical Results on Transfer Payments except Interest Payments for the Period 1978Q2-2008Q1
Equation 1
Dependent Variable Transfer Payments except Interest Payments
Variables Coef. Prob.
C -848 0.99
ELEC1 757151 0.07
AR(1) -0.37 0.00
Adjusted R^2 0.15
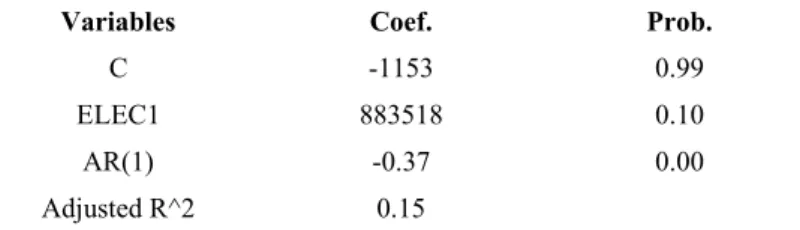
When the AR(1) methodology is applied to the period of 1986Q1-2008Q1 for the transfer payments, the result derived above does not change in the equation 1 in Table 15. Also, the model seems to be robust.
Table 15: Empirical Results on Transfer Payments except Interest Payments for the Period 1986Q1-2008Q1
Equation 1
Dependent Variable Transfer Payments except Interest Payments
Variables Coef. Prob.
C -1153 0.99
ELEC1 883518 0.10
AR(1) -0.37 0.00
Adjusted R^2 0.15
significant in the equation 1 in Table 17. From these findings, it is possible to derive that real transfer payments are increased between 3 and 6 months prior to elections.
Table 16: Empirical Results on Real Transfer Payments except Interest Payments for the Period 1978Q2-2008Q1
Equation 1 Equation 2
Dependent Variable
Real Transfer Payments except Interest Payments
Dependent Variable
Real Transfer Payments except Interest Payments
Variables Coef. Prob. Variables Coef. Prob.
C -0.0001 0.93 C -0.0002 0.88
ELEC1 0.0162 0.06 ELEC9 0.0090 0.09
AR(1) -0.39 0.00 AR(1) -0.39 0.00
Adjusted R^2 0.16 Adjusted R^2 0.15
Table 17: Empirical Results on Real Transfer Payments except Interest Payments for the Period 1986Q1-2008Q1
Equation 1
Dependent Variable Real Transfer Payments except Interest Payments
Variables Coef. Prob.
C 0.0000 0.98
ELEC1 0.0195 0.07
AR(1) -0.38 0.00
Adjusted R^2 0.16
F. Central Bank Credits to the Government
Central bank credits to the government are assessed for the time period of 1986Q2-2003Q1, since these credits become insignificant after the period 2003Q1. This fact can be related to the independence of Central Bank. Central Bank throughout the time was used like a source of government fund by means of seignorage revenues and credits. However, this situation changed after the central bank independence, since political pressure on the central bank diminished considerably.
Central bank credits seem to increase two quarters before the election quarters, because ELEC2’s coefficient is statistically significant and positive in the equation in Table 18. However, no further results are found such as a contraction of central bank credits after the election quarter. Thus, the result, that Central bank credits increase two quarter before the election quarter, is the only derivation that we can make.
Table 18: Empirical Results on Central Bank Credits for the Period 1986Q2-2003Q1
Equation 1
Dependent Variable Central Bank Credits
Variables Coef. Prob.
C -2550 0.41
ELEC2 29822 0.05
AR(1) -0.38 0.00
Adjusted R^2 0.18
V. CONCLUSION: ARE THERE POLITICAL BUSINESS CYCLES IN TURKEY?
The results that we have driven till that point are complicated and blurred. Thus, we will group all empirical results in Table 19 below so that it is easy to understand and make conclusions:
Table 19: Relations of Fiscal Variables with Elections4
Fiscal Variables
Before the Election Quarters
In the Election Quarter
After the Election Quarters
Budget Deficit High Relation High Relation No Relation
Government Expenditure No Relation High Relation High Relation
Public Investment No Relation No Relation High Relation
Tax Income No Relation No Relation No Relation
Transfer Payments except
Interest Payments High Relation High Relation No Relation
Central Bank Credits High Relation No Relation No Relation
From Table 19, it is clear that governments give budget deficits before the elections and decrease government spending considerably after the election period. Moreover, public investments are decreased after the election quarters even though we couldn’t observe the increase before the election period. Also, voters seem to be made happier via transfer payments before the election periods. On the other hand, tax rates or tax structure is not changed to manipulate voters like it is in the case for developed countries. There are traces of manipulation in the economy via central bank credits, but “after election expectations” are not realized i.e. no significant contraction on the central bank credits is found.
Based on the empirical evidence, it is clear that opportunistic political business cycles exist in Turkey. Turkish politicians tend to manipulate the
4
economy via fiscal instruments before the elections and, afterwards, they try to correct the economy applying tight fiscal policies.
REFERENCES
ALESINA, Alberto (1987), “Macroeconomic Policy in a Two-party System as a Repeated Game”,
Quarterly Journal of Economics, 102, 651-678.
ALESINA, Alberto (1988), “Credibility and Policy convergence in a Two-party System with Rational Voters”, American Economic Review, 78, 796-805.
ALESINA, Alberto, ROUBINI, Nouriel and Gerald D. COHEN (1992), Political Cycles and the Macroeconomy, MIT Press, Cambridge.
ALESINA, Alberto and Nouriel ROUBINI (1992), “Political cycles in OECD Economies”, Review of Economic Studies, 59, 663-688.
ASUTAY, Mehmet (2004), “Searching for Opportunistic Political Business Cycles in Turkey”, Paper presented in European Public Choice Society.
AYLAR İTİBARİYLE KONSOLİDE BÜTÇE VE GELİR GERÇEKLEŞMELERİ (1957-1993), Ankara Üniversitesi Basımevi.
BERUMENT, Hakan and Jac C. HECKELMAN (1998), “Political Business Cycles and Endogenous Elections”, Southern Economic Journal, 64(4), 987-1000.
DRAZEN, Allan (2000a), Political Economy in Macroeconomics, Princeton University Press, Nj. DRAZEN, Allan (2000b), “The Political Business Cycle after 25 Years”, NBER Macroeconomics
Annual, 15, 75-117.
EVDS CENTRAL BANK OF TURKEY, http://evds.tcmb.gov.tr/
FAIR, Ray C. (1978), “The Effects of Economic Events on Votes for President”, Review of Economics and Statistics, 60, 159-172.
GRIER, Kevin B. (1989), “On the Existence of a Political Monetary Cycle”, American Journal of Political Science, 33, 376-389.
HAYNES, Stephen E. and Joe A. STONE (1989), “Political Models of the Business Cycle Should be Reviewed”, Economic Inquiry, 28, 442-465.
HIBBS, Douglas A. (1977), “Political Parties and Macroeconomic Policy”, American Political Science Review, 71, 1467-1487.
JOHNSTON, Jack and John DINARDO (1997), Econometric Methods, McGraw-Hill.
KEECH, William R. and Kyoungsan PAK (1989), “Electoral Cycles and Budgetary Growth in Veterans’ Benefit Programs”, American Journal of Political Science, 33, 901-911.
KRAMER, Gerald H. (1971), “Short-term Fluctuations in US Voting Behavior, 1896-1964”,
American Political Science Review, 65, 131-143.
KUZU, Yasemin (2003), “Political Business Cycle in the Turkish Economy:1977-2001”, METU Conference in Economics VII September 6-9, 2003, Ankara, Turkey.
NORDHAUS, William D. (1975), “The Political Business Cycle”, Review of Economic Studies, 42, 169-190.
ROGOFF, Kenneth and Anne SIBERT (1988), “Elections and Macroeconomic Policy Cycles”,
Review of Economic Studies, 55, 1-16.
ROGOFF, Kenneth (1990), “Equilibrium Political Budget Cycles”, American Economic Review, 80, 21-36.
SEZGİN, Şennur (2007), “Türkiye’de Politik Konjonktürel Dalgalanmalar: 1950-2003 Dönemi”,
Ankara Üniversitesi SBF Dergisi, 62(2), 136-154.
TUFTE, Edward R. (1975), “Determinants of the Outcomes of Midterm Congressional Elections”,
American Political Science Review, 69, 812-826.
TUFTE, Edward R. (1978), Political Control of the Economy, Princeton University Press, Princeton, Nj.
TUTAR, İbrahim and Aysit TANSEL (2000), “Political Business Cycles, Institutional Structure and Budget Deficits in Turkey”, Paper presented in Metu Conference in Economics.
TÜRKİYE SEÇİMLERİ, http://www.belgenet.net/