Codon Adaptation of Plastid Genes
Haruo Suzuki1¤, Brian R. Morton2 *
1Graduate School of Science and Engineering, Yamaguchi University, Yamaguchi, Japan,2Department of Biology, Barnard College, Columbia University, New York, New York, United States of America
¤ Current address: Institute for Advanced Biosciences, Keio University, Fujisawa, Japan *[email protected]
Abstract
Codon adaptation is codon usage bias that results from selective pressure to increase the translation efficiency of a gene. Codon adaptation has been studied across a wide range of genomes and some early analyses of plastids have shown evidence for codon adaptation in a limited set of highly expressed plastid genes. Here we study codon usage bias across all fully sequenced plastid genomes which includes representatives of the Rhodophyta, Alveolata, Cryptophyta, Euglenozoa, Glaucocystophyceae, Rhizaria, Stramenopiles and numerous lineages within the Viridiplantae, including Chlorophyta and Embryophyta. We show evidence that codon adaptation occurs in all genomes except for two,Theileria parva
andHeicosporidiumsp., both of which have highly reduced gene contents and no photosyn-thesis genes. We also show evidence that selection for codon adaptation increases the repre-sentation of the same set of codons, which we refer to as the adaptive codons, across this wide range of taxa, which is probably due to common features descended from the initial endosymbiont. We use various measures to estimate the relative strength of selection in the different lineages and show that it appears to be fairly strong in certain Stramenopiles and Chlorophyta lineages but relatively weak in many members of the Rhodophyta, Euglenozoa and Embryophyta. Given these results we propose that codon adaptation in plastids is wide-spread and displays the same general features as adaptation in eubacterial genomes.
Introduction
Codon usage bias, or the non-uniform representation of synonymous codons within a coding sequence, is a universal feature of genomes that arises from a combination of an underlying mutational bias and natural selection [1–3]. When considering codon usage bias a distinction must be made between the pattern, or‘direction’, of codon bias–that is, the specific set of codons that are over-represented–and the degree of codon bias. Two genes can have the same degree of bias, measured as deviation from uniform representation of synonymous codons, but be biased towards a different set of codons and since mutation and selection can vary across a genome, genes within a genome can vary in both the degree and pattern of codon usage bias.
Mutation biases that shape genomic G+C content typically result in different genes within a genome displaying variation only in the degree of codon bias, not in the pattern of codon bias. In general, the underlying mutational process of a genome is biased either towards A+T or towards G+C and these two situations will lead to a pattern of codon usage bias in which the
a11111
OPEN ACCESS
Citation:Suzuki H, Morton BR (2016) Codon Adaptation of Plastid Genes. PLoS ONE 11(5): e0154306. doi:10.1371/journal.pone.0154306
Editor:Xiu-Qing Li, Agriculture and Agri-Food Canada, CANADA
Received:June 10, 2015
Accepted:April 12, 2016
Published:May 19, 2016
Copyright:© 2016 Suzuki, Morton. This is an open access article distributed under the terms of the Creative Commons Attribution License, which permits unrestricted use, distribution, and reproduction in any medium, provided the original author and source are credited.
Data Availability Statement:All relevant data are within the paper and its Supporting Information files and all were generated from files available at NCBI. All accession numbers are given for files utilized.
Funding:The authors have no support or funding to report.
NNA and NNT codons (those with A or T at the third codon position) of all synonymous codon groups are over-represented or under-represented respectively. The degree to which this bias is observed in any individual gene within a genome can vary across the genome depending upon the variation in mutation bias across chromosome loci [4].
The contribution of natural selection to the codon usage of a gene can take two forms [5]. First, there can be selection at individual nucleotide sites that is independent of any protein-coding function of that site. We will consider this to be general background selection that can be folded into the mutational bias such that we can simply refer to the contribution of the sub-stitution bias in a genome to codon usage. The second possible contribution of selection is dependent on the amino acid coding function of codons. In some genomes there is evidence that selection acts to increase the translation efficiency of certain genes by favoring a set of codons that are optimal for this process, with the implication that there are fitness differences between synonymous codons [2,6,7]. This action of selection is commonly thought to increase the representation of codons that yield the best trade-off between more rapid and more accu-rate translation by the available tRNA population in the cell [3,6,8,9], which could involve a co-evolution of codon usage and tRNA levels [10].
This second role for selection results in codon adaptation, which we define as an adaptation of the codon usage of a gene towards an increased representation of the codons that increase translation efficiency. These codons are referred to as adaptive codons. Codon adaptation has been observed in many organisms, particularly unicellular organisms [2,6]. The strength of this sort of selection varies amongst genes within a genome as a function of expression level with selection acting most strongly on highly expressed genes [2]. The result, in genomes where there is codon adaptation, is variation amongst genes in the pattern of codon usage as well as in the degree of bias towards the adaptive codons. In such genomes a large majority of genes show a codon usage pattern that can be largely attributed to the underlying substitution bias while a smaller number of highly expressed genes show a pattern of codon usage with an increased representation of adaptive codons. If codon adaptation and the substitution bias con-verge on the same codon usage pattern then adaptation can be more difficult to detect, but the two codon usage patterns are often distinguishable.
Given the influences of substitution bias and selection, or the general difference between degree and pattern of codon bias, we need to distinguish between codon adaptation and strict codon bias. Codon adaptation in the highly expressed, or highly translated, genes under strong selection will be manifest in a strong bias towards adaptive codons. If we consider a synony-mous group with two codons, Csand Ca, where Cais the adaptive codon, if the substitution
bias is such that it would lead to Cs>>Cathen selection can result in Ca>>Csin highly
translated genes. However, genes under weaker selection can have levels of codon adaptation in which the action of selection somewhat offsets the action of the substitution bias such that CaffiCs. In these cases there is codon adaptation since selection has led to an increased
fre-quency of Cabut there is very little absolute codon bias. To account for the pattern of codon
bias we can employ measures of codon usage, such as the Codon Adaptation Index (CAI, [11]), that measure the degree of bias towards a specified set of adaptive codons (such as Ca, which
must be determined separately, typically from codon usage in highly expressed genes) as opposed to statistics, such as the Effective Number of Codons (ENC, [12]), which measure only the degree of deviation from uniform codon usage regardless of which codons are over-represented. Ca>>Csand Cs>>Caboth have high codon bias (low ENC) but the latter will
have a low CAI. Cs>>Cawill have a higher codon bias (lower ENC) than CaffiCsbut the
lat-ter will have a higher CAI.
fully expressed within the organelle. Evidence indicates that plastids are descended from a sin-gle cyanobacteria-like endosymbiont with the green plants, red algae and Glaucophytes retain-ing the descendant of this primary endosymbiont and at least two subsequent secondary endosymbiotic events giving rise to plastids in other lineages such as the Euglenozoa, Alveolata, Stramenopiles, Cryptophyta and Haptophyceae [13,14]. Among the 601 of the 605 completely sequenced and annotated plastid genomes at National Center for Biotechnology Information (NCBI,http://www.ncbi.nlm.nih.gov) as of September 2014, genome size ranged from 29,623 base pairs (bp) to 521,168 bp, with a median of 152,968 bp, and the protein-coding sequence (CDS) number ranged from 21 to 273 with a median of 84. (The other four of the 605
sequenced plastid genomes had no annotated CDS, which may indicate incomplete annotation and so they are excluded from this analysis.) Across different lineages there is a general substi-tution bias towards A and T with the sequenced genomes showing a %G+C content ranging from 13.7 to 57.7 with a median of 37.2; of the sequenced genomes only 3 have a %G+C greater than 50%. The general pattern of codon usage in plastid genes reflects this substitution bias with a high representation of NNA and NNT codons [15]. However, the substitution process in flowering plant chloroplasts is known to be strongly context-dependent in that the muta-tional dynamics of any given nucleotide are influenced by the composition of nucleotides flanking that site [16–18]. The result of this is that, despite a general bias towards NNA and NNT codons, the exact pattern of codon usage bias across synonymous codon groups is some-what more complex in flowering plant chloroplasts [15,19]. Since it is not known if similar con-text effects exist in other plastids, the general bias towards NNA and NNT codons may mask similar complexity that we cannot consider in this study.
We perform an analysis of plastid gene codon usage in these plastid genomes with a focus on codon adaptation. Given that seed plant chloroplasts make up the vast majority of the sequenced genomes we limited their representation to a single dicot (Nicotiana tabacum), a single monocot (Oryza sativa) and a single gymnosperm (Pinus thunbergii) leaving a total of 103 genomes. We apply a uniform approach to all of the genomes and show evidence that highly translated genes, particularlypsbAandrbcL, display codon adaptation in most plastid genomes and that selection favors the same, or a very similar, adaptive pattern of codon usage across all of the lineages. We also attempt to assess the strength of selection for codon adaptation, either in terms of the degree of bias towards the adaptive pattern or in the number of genes showing evidence for some degree of codon adaptation, across the plastid genomes. In general we find that Rhodophyta, with the exception of the Bangiales, and seed plants (represented in our study byNicotiana tabacum,
Oryza sativa, andPinus thunbergii) have relatively low, but detectable, levels of codon adaptation while Stramenopiles and Chlorophyta in particular have relatively strong codon adaptation.
The results lead us to propose that all plastid codon usage can be largely explained by a sin-gle general model of substitution bias towards A+T and codon adaptation to the same set of codons in all plastids. This adaptation is based on the limited plastid tRNA population. The degree of adaptation towards these favored codons varies across genomes and across genes as a function of some aspect of gene expression, most likely translation efficiency. Although there are likely to be additional factors that make minor contributions to the variation in codon usage amongst genes within any specific genome, our data indicate that codon adaptation is a common feature of plastid genomes.
Materials and Methods
Software and Databases
codon resampling test, which was performed using a Java Package written by BRM. Statistical computing and graph drawing were conducted with R version 3.1.2 [23], available athttp://
www.R-project.org.
A list of the 103 plastid genomes along with taxanomic information is given inS1 Table. All genome sequences were taken from NCBI FTP Site (ftp://ftp.ncbi.nlm.nih.gov/genomes/) in Sep-tember 2014. tRNA genes encoded in the 38 plastid genomes were retrieved from the tRNA Gene DataBase Curated by Experts "tRNADB-CE" [24], available athttp://trna.ie.niigata-u.ac.jp/.
Codon fitness values
Codon fitness values, also called the relative adaptiveness of codons [11], are typically calculated from the codon usage of highly expressed genes. Based on the fact that product of thepsbAgene is the major translation product in chloroplast [25] we used thepsbAgene from a small set of taxa to estimate codon fitness. For each codon, fitness is calculated by dividing the usage of that codon by the maximum usage within the synonymous group. A codon with no representation in the ref-erence group is assigned a fitness value of 0.002 as in [11]. For any gene, or cumulative set of genes, the geometric mean of the codon fitness values of the codon usage table is the Codon Adaptation Index (CAI). The use of high expression genes to define fitness values results in a CAI that is a measure of adaptation for expression, more specifically translation efficiency [11] but more generally, CAI as an information statistic can be used to measure the degree of fit to any defined codon usage pattern. The codon fitness values used in this study are listed inS2 Table. The number of high expression genes used to estimate codon fitness values was limited so that the CAI value of a gene would not generally utilize codon fitness values derived from that same gene or from genes from the same genome. However, altering the set of high expression genes used to infer codon fitness values did not substantively alter any of the results (data not shown).
Codon resampling test
We applied a resampling method to each genome to test for genes with codon adaptation levels significantly above what would be generated by the genome substitution bias. The null hypothesis is that all genes within the genome have the same level of codon adaptation; this would be the level of adaptation arising from the genome substitution bias. Therefore, if variation in substitu-tion bias is minimal across the small genome, then the codon usage in each gene would represent a random sample from the same codon distribution. To test this hypothesis the codons from every protein-coding sequence from a given genome were pooled. For every gene we generated a random codon usage by drawing with replacement from this pool until the sampled codons had the same amino acid usage as the gene and calculated CAI for this random codon usage using the codon fitness values described above. This resampling was repeated 1000 times for each gene to yield an expected distribution of CAI for that gene under the null hypothesis. A gene was rejected if the observed CAI was more than 3 standard deviations greater than expected.
Once we had run the resampling on every gene within a genome we repeated the test leaving out all genes rejected in the previous round. This was repeated until no genes were rejected in a round indicating that the level of codon adaptation in each of the remaining genes could be explained by the same codon usage. All genes rejected in this resampling were considered to have evidence for significant codon adaptation. The protocol was performed using a Java Pack-age written by BRM.
Hierarchical clustering of genes based on codon usage
Dissimilarity between two genes based on 59 variables of codon usage was measured using Pearson correlation distance (one minus Pearson product-moment correlation coefficient). Absolute codon frequencies (codon count data) were used for clustering genes putatively trans-lated at high (psbA,rbcL, andpsbC) and low (rps3,rps4, andrpoB) levels from 43 plastid genomes. To control for amino acid composition, codon usage data were normalized by divid-ing the usage of each codon by the maximum usage in each amino acid. The normalized codon usage data were used in the analysis of allpsbAandpsbNgenes.
The strength of selection for codon adaptation (S)
Following [7] and [26], an S value was calculated for each plastid genome using the codon fre-quencies for four amino acids, Phe (Ca= TTC and Cs= TTT), Tyr (Ca= TAC and Cs= TAT),
Ile (Ca= ATC and Cs= ATT), and Asn (Ca= AAC and Cs= AAT), where the two codons (Cs
and Ca) are recognized by the same tRNA species but Cais recognized more efficiently. The S is
based on a comparison of codon frequencies within these synonymous groups between high expression genes and all other genes ([7] and [26]). Given the small number of genes coded by the plastid genome we used onlypsbAas the reference highly expressed gene to calculate S val-ues for all 103 plastids. A second analysis used three genes,psbA,rbcLandpsbCas the reference highly expressed genes and the value generated in this case referred to as S3.
Within-group correspondence analysis (WCA) of codon usage
WCA combines multivariate data into a small number of variables (axes) that explains most of the variation among the original variables [27,28]. In our study our variables are the 18 codons for 9 two-fold degenerate amino acids (C, D, E, F, H, K, N, Q, and Y by the single letter amino acid code) for each gene in a genome, and WCA yields the coordinates of each gene on each new axis.
Replication strand skew analysis
The degree of replication strand bias was measured by the GC skew index (GCSI) [29,30]. The GCSI was calculated with a window number of 256, considering that each window should con-tain at least 100 bp and that the genome sizes for the plastid genomes ranged from 29,623 to 521,168 bp. The GCSI can take values from 0 (no bias) to approximately 1 (high bias), and empirically a genome with a clear GC skew has a GCSI of>0.1. For the plastid genomes with a
GCSI over 0.1, the origin and terminus of DNA replication were predicted using cumulative GC skew [31] so that genes were located on the leading or lagging strand.
Results
Codon usage patterns in plastid genes
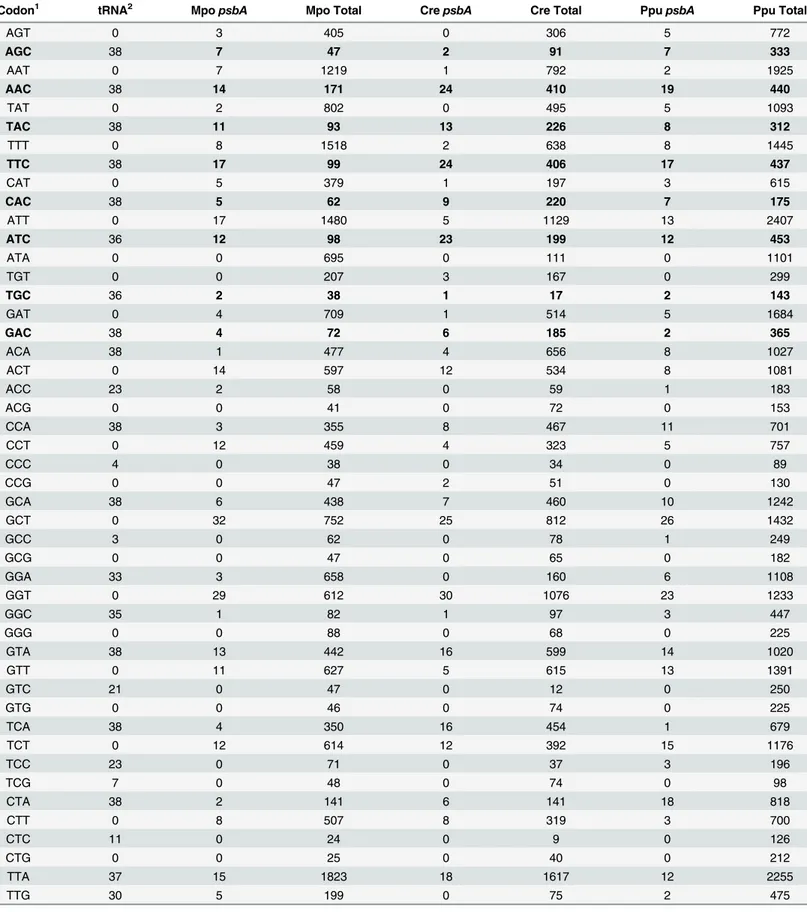
Previous analyses of a limited number of plastid genes showed evidence for two main patterns of codon usage, one of which was proposed to be a result of codon adaptation [15,25]. The two codon usage patterns are illustrated here using the codon usage tables from three widely sepa-rated taxa, the liverwortMarchantia polymorpha, the green algaChlamydomonas reinhardtii
and the red algaPorphyra purpurea(Table 1). One codon usage pattern is observed in the cumulative codon usage of each genome. This pattern is a general bias towards the NNA and/ or NNT codons within each synonymous group and is consistent with the general bias across plastid genomes [15,19], likely due to a general substitution bias.
The highly expressedpsbAgene displays a second general codon usage pattern as observed
Table 1. Codon usage in three plastid genomes.
Codon1 tRNA2 MpopsbA Mpo Total CrepsbA Cre Total PpupsbA Ppu Total
AGT 0 3 405 0 306 5 772
AGC 38 7 47 2 91 7 333
AAT 0 7 1219 1 792 2 1925
AAC 38 14 171 24 410 19 440
TAT 0 2 802 0 495 5 1093
TAC 38 11 93 13 226 8 312
TTT 0 8 1518 2 638 8 1445
TTC 38 17 99 24 406 17 437
CAT 0 5 379 1 197 3 615
CAC 38 5 62 9 220 7 175
ATT 0 17 1480 5 1129 13 2407
ATC 36 12 98 23 199 12 453
ATA 0 0 695 0 111 0 1101
TGT 0 0 207 3 167 0 299
TGC 36 2 38 1 17 2 143
GAT 0 4 709 1 514 5 1684
GAC 38 4 72 6 185 2 365
ACA 38 1 477 4 656 8 1027
ACT 0 14 597 12 534 8 1081
ACC 23 2 58 0 59 1 183
ACG 0 0 41 0 72 0 153
CCA 38 3 355 8 467 11 701
CCT 0 12 459 4 323 5 757
CCC 4 0 38 0 34 0 89
CCG 0 0 47 2 51 0 130
GCA 38 6 438 7 460 10 1242
GCT 0 32 752 25 812 26 1432
GCC 3 0 62 0 78 1 249
GCG 0 0 47 0 65 0 182
GGA 33 3 658 0 160 6 1108
GGT 0 29 612 30 1076 23 1233
GGC 35 1 82 1 97 3 447
GGG 0 0 88 0 68 0 225
GTA 38 13 442 16 599 14 1020
GTT 0 11 627 5 615 13 1391
GTC 21 0 47 0 12 0 250
GTG 0 0 46 0 74 0 225
TCA 38 4 350 16 454 1 679
TCT 0 12 614 12 392 15 1176
TCC 23 0 71 0 37 3 196
TCG 7 0 48 0 74 0 98
CTA 38 2 141 6 141 18 818
CTT 0 8 507 8 319 3 700
CTC 11 0 24 0 9 0 126
CTG 0 0 25 0 40 0 212
TTA 37 15 1823 18 1617 12 2255
TTG 30 5 199 0 75 2 475
protein, differs from the cumulative codon usage pattern of its genome, the codon usage pat-terns of the threepsbAgenes are similar to one another. The most obvious difference between the two codon usage patterns–that is, between the cumulative codon usages and the codon usage of thepsbAgenes—is in the two-fold degenerate NNY codon groups (i.e. two-fold degen-erate codon groups with a third position pyrimidine). In these synonymous groups we see a rel-atively high frequency of the NNC codons inpsbAwhen compared to the cumulative bias towards NNT (Table 1). Although this bias towards NNC is particularly obvious there are other differences between the two codon usage patterns; for example, unlike in the cumulative codon usage pattern thepsbAgenes do not utilize either CGG or CGA for Arginine, nor do they use GGG to code glycine, and there is a strong bias towards coding glycine with GGT instead of GGA.
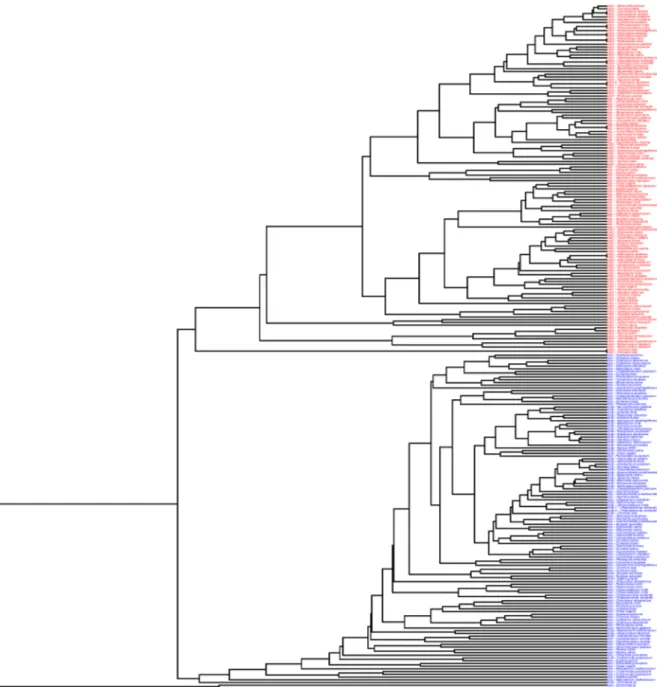
To examine these two codon usage patterns across a broader spectrum of taxa, we con-structed a dendrogram by clustering a set of high and low expression genes based on similarity of codon usage. The former set was composed of two highly translated genes,psbA, andrbcL, which codes the large subunit of RuBisCO [15,19,25], and a third gene,psbC, that codes a core component of photosystem II and so is likely to have a relatively high level of translation. For comparison to these we chose three plastid genes expected to have relatively low translation levels [15]. We clustered these genes from each of 43 genomes (Fig 1) that were randomly selected with the goal of having a representative of each Order while reducing the density of the cluster at the same time.
The codon usages of the genes inFig 1show that the pattern of codon usage in thepsbA
genes inTable 1is observed in high expression genes across a wide taxanomic range. Two major clusters of genes are apparent inFig 1, one composed of the high translation genes and the other composed of the low translation genes. The differences in codon usage pattern between the low and high translation genes are the same as the differences between the codon usage patterns given inTable 1(S3 Table). For simplification these differences are reduced to two general compositional differences, the increased frequency of NNC codons within twofold Table 1. (Continued)
Codon1 tRNA2 MpopsbA Mpo Total CrepsbA Cre Total PpupsbA Ppu Total
CGA 0 0 248 0 67 0 285
CGT 38 10 344 15 734 11 330
CGC 0 2 46 0 57 2 123
CGG 23 0 22 0 4 0 56
AGA 38 2 367 0 99 1 1152
AGG 4 0 24 0 15 0 181
GAA 37 17 1080 15 914 16 2133
GAG 0 2 84 4 76 2 490
AAA 37 0 1724 0 1497 1 2417
AAG 0 1 81 0 86 0 582
CAA 38 6 855 7 782 7 1475
CAG 0 0 51 0 63 2 401
1–Codon usage is given for thepsbAgene and all genes cumulatively (total) forMarchantia polymorpha(Mpo),Chlamydomonas reinhardtii(Cre) and
Porphyra purpurea(Ppu). The NNC codons of the two-fold degenerate groups are in bold: thepsbAgenes have an increased frequency of these codons as discussed in the text. The AGT and AGC codons of Serine are grouped with the NNY two-fold degenerate codon groups separate from the TCN Serine codons.
2–Number of the 38 plastid genomes in the tRNA database athttp://trna.ie.niigata-u.ac.jp/that have a tRNA complementary to the codon.
degenerate groups and the higher frequency of NNT codons in fourfold degenerate codon groups, and presented inFig 2. As with the differences observed inTable 1, thepsbAgenes have a total of 66.4% NNC within the two-fold degenerate NNY groups while the low transla-tion genes have a total of just 16.5% NNC in these groups. This increased frequency of NNC in the NNY codon groups is also apparent to a lesser degree in the high translationrbcL(41.4% NNC) andpsbC(30.1% NNC) genes. In addition, this bias towards NNC in the genes within the high expression genes does not extend to the four-fold degenerate codon groups. Instead there is a lower frequency of NNC in these codon groups relative to the other genes (Fig 2). Consistent with previous proposals [15,25] we interpret this as evidence of codon adaptation in Fig 1. Codon usage patterns in plastid genes.A cluster of three putative high-translation (psbA,rbcL,psbCin red) and three putative low-translation (rps3,rps4,rpoBin blue) genes from 43 plastid genomes selected to represent the major lineages (see text). Genes are clustered by similarity in codon usage as described in the Materials and Methods.
highly expressed genes across a wide range of taxa. This proposal will be discussed in detail below.
Variation in levels of codon adaptation across plastid genomes
If the general codon usage pattern in thepsbAgenes inTable 1andS3 Tableis an adaptive pat-tern and selection favors the same adaptive patpat-tern of codon usage across plastid lineages, then we can try estimate the relative strength of selection acting on different genomes by measuring the degree to which highly expressed genes are biased towards the adaptive pattern. The strength of selection could be manifest in the degree to which selection is increasing the codon adaptation of high expression/translation genes within a genome and/or in the number of genes that are under some level of selective pressure to increase the representation of adaptive codons above the level that would result from the substitution bias alone. We examined this using three different metrics that can measure one or the other, or both, of these two aspects of codon adaptation; a codon resampling test [15], the calculation of a genome selection coeffi-cient, S, following [7] and comparison of CAI values based on the single set of codon fitness values as described in the Materials and Methods. Based on the three metrics we then put for-ward a single statistic, called Spca, to estimate relative selection strength within a genome. The
full results of the analyses are given inS1 Tableand the results of the three approaches are dis-cussed separately below.
Codon resampling test. The resampling test results are summarized in Tables2and3. In this test, resampling with replacement from a combined genome pool of codons from all iden-tified protein-coding sequences was used to estimate an expected level of codon adaptation for individual genes in that genome. As discussed in the Materials and Methods, rejection indicates Fig 2. Third position composition patterns.A plot of %C (C/[C+T]) base composition at two-fold
degenerate and four-fold degenerate sites for the genes shown inFig 1. Values are the cumulative base composition for each gene. For the low translation genes we show the cumulative composition of therps3,
rps4andrpoBgenes.
that the level of adaptation is significantly higher than expected were the gene composed of codons representative of the genome-wide codon pool. The resampling test showed a strong trend towards rejecting highly expressed genes (Table 2) and there is striking similarity across genomes in what genes display a significantly increased CAI values, or codon adaptation. The
psbAgene, the major translation product in plant chloroplasts, was rejected in the resampling test of every genome exceptCyanidium caldarium[32], one of the few genomes in whichrbcL
was also not rejected. Other genes that were rejected in a majority of genomes were the small
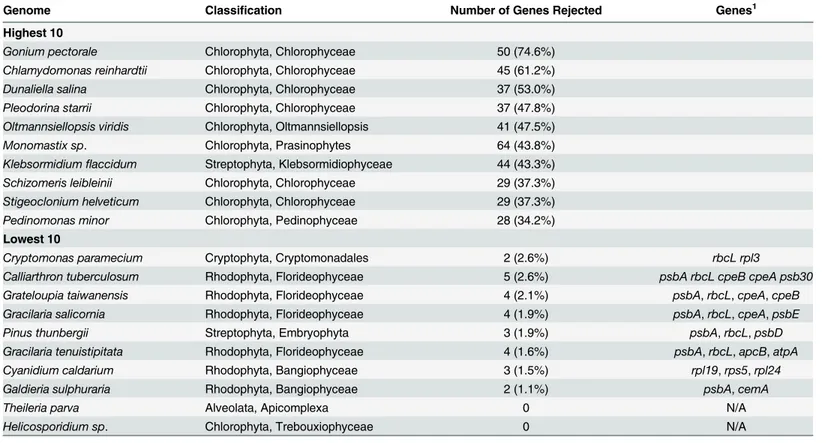
Table 3. Genomes with the highest levels of rejection in the resampling analysis.
Genome Classification Number of Genes Rejected Genes1
Highest 10
Gonium pectorale Chlorophyta, Chlorophyceae 50 (74.6%)
Chlamydomonas reinhardtii Chlorophyta, Chlorophyceae 45 (61.2%)
Dunaliella salina Chlorophyta, Chlorophyceae 37 (53.0%)
Pleodorina starrii Chlorophyta, Chlorophyceae 37 (47.8%)
Oltmannsiellopsis viridis Chlorophyta, Oltmannsiellopsis 41 (47.5%)
Monomastix sp. Chlorophyta, Prasinophytes 64 (43.8%)
Klebsormidiumflaccidum Streptophyta, Klebsormidiophyceae 44 (43.3%)
Schizomeris leibleinii Chlorophyta, Chlorophyceae 29 (37.3%)
Stigeoclonium helveticum Chlorophyta, Chlorophyceae 29 (37.3%)
Pedinomonas minor Chlorophyta, Pedinophyceae 28 (34.2%)
Lowest 10
Cryptomonas paramecium Cryptophyta, Cryptomonadales 2 (2.6%) rbcL rpl3
Calliarthron tuberculosum Rhodophyta, Florideophyceae 5 (2.6%) psbA rbcL cpeB cpeA psb30
Grateloupia taiwanensis Rhodophyta, Florideophyceae 4 (2.1%) psbA,rbcL,cpeA,cpeB
Gracilaria salicornia Rhodophyta, Florideophyceae 4 (1.9%) psbA,rbcL,cpeA,psbE
Pinus thunbergii Streptophyta, Embryophyta 3 (1.9%) psbA,rbcL,psbD
Gracilaria tenuistipitata Rhodophyta, Florideophyceae 4 (1.6%) psbA,rbcL,apcB,atpA
Cyanidium caldarium Rhodophyta, Bangiophyceae 3 (1.5%) rpl19,rps5,rpl24
Galdieria sulphuraria Rhodophyta, Bangiophyceae 2 (1.1%) psbA,cemA
Theileria parva Alveolata, Apicomplexa 0 N/A
Helicosporidium sp. Chlorophyta, Trebouxiophyceae 0 N/A
1–For genomes with the lowest rejection rates those genes rejected are listed
doi:10.1371/journal.pone.0154306.t003
Table 2. Genes with highest rejection rate across genomes in the resampling analysis.
Gene Number of Genomes1 Number of Genomes Rejected2
psbA 98 97 (99.0%)
rbcL 98 86 (87.8%)
cpeB 12 10 (83.3%)
cpeA 10 8 (80.0%)
rbcS 48 34 (70.83%)
tufA 92 62 (67.4%)
psbC 96 61 (63.5%)
psbD 97 58 (59.8%)
1–Number of genomes that code the gene.
2–Number of genomes in which the gene was rejected in the resampling analysis.
subunit of RuBisCo (rbcS),tufA, which codes a translation elongation factor [33], thecpeAand
cpeBgenes coding for the two subunits of the Phycoerythrin protein involved in light harvest-ing (seehttp://www.ncbi.nlm.nih.gov/gene/810008andhttp://www.ncbi.nlm.nih.gov/gene/
856988respectively),psbC(discussed above), and another major gene for photosystem IIpsbD
[34].
Of the genes coded by at least 85 of the genomes we found the lowest rejection rates for
psbN(1 of 97 genomes) a gene of unknown function associated with the biogenesis of both photosystems [35],rpoC2(2 of 97 genomes) a component of the plastid RNA polymerase [36],
ycf4(2 of 93 genomes), which codes a non-essential assembly factor of photosystem I [37],
rpl20andrpl36(3 of 98 each), both encoding ribosomal proteins,rpoA(3 of 95) andrpoC1(3 of 91), both of which encode plastid RNA polymerase components [38],ccsA(3 of 86), which appears to encode a protein involved in heme attachment to chloroplast cytochromes [39],
rpl23(4 of 95), encoding a ribosomal protein andycf3(4 of 87), whose function is unknown but may be related to photosystem biogenesis [37].
Table 3shows the number of genes rejected within each genome. The plastid genomes with
the highest levels of rejection (i.e. fraction of genes rejected) are all from Chlorophytes, and the four plastid genomes with the highest rejection levels,Gonium,Chlamydomonas,Dunaliella
andPleodorina, are all from members of the Chlamydomonadales. These data indicate that within some lineages, particularly some of the green algae, a large number of plastid genes are under selection for codon adaptation. The plastid genomes with the lowest rejection rates are predominantly from Rhodophytes with notable exceptions being pine (Pinus thunbergii) and the non-photosyntheticCryptomonas paramecium, which does not code apsbAgene. For the genomes with the lowest rejection rates the results indicate that essentially all genes are equiva-lent in terms of codon usage and it is most likely that their codon usage is determined almost exclusively by substitution bias. The few genes that are rejected in these genomes are genes such aspsbA,rbcL,cpeAandcpeBthat are widely rejected, and the rejection is indicative that they differ significantly from the cumulative codon pool. Two genomes, one from the bovine pathogenTheileria parva[40] and the other from the ChlorophyteHelicosporidiumsp. [41], showed no evidence for significant codon adaptation in any gene.Theileriahas a highly reduced genome of just 39,579 nucleotides and does not code any photosystem I or photosys-tem II gene, nor does it coderbcL.Helicosporidiumis a parasitic green alga that also has a highly reduced genome of just 37,454 nucleotides. LikeTheileriait does not code any photosys-tem genes orrbcL.
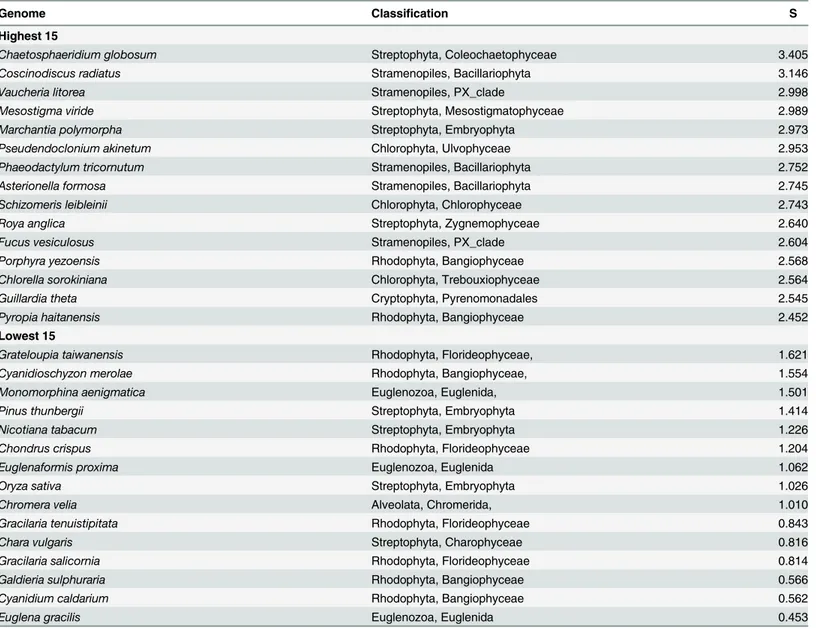
Genome S values. The results of the S calculations are summarized inTable 4. S provides information on the strength of selection on those genes under selection as measured by the degree to which they differ from the overall genome codon usage. This is in contrast to the resampling which is more informative about the breadth, in terms of the number of genes affected, of selection.
Overall, the genomes with low S values are from Rhodophyta, includingCyanidium, which was the only genome that did not reject eitherpsbAorrbcLin the resampling analysis, Eugle-nozoa and Embryophyta. Taxa with high S values are from a number of orders and include rep-resentatives of the Stramenopiles, Chlorophyta and basal lineages within the Streptophyta. Interestingly, the Rhodophyta have representatives with both low and high S values. The mem-bers of the Bangiales, represented here byPorphyraandPyropia, have high S values while the other representatives of the Bangiophyceae—Cyanidioschyzon,CyanidiumandGalderiawhich are Cyanidiales, andPorphyridiumwhich is a member of the Porphyridiales–as well as the members of the Florideophyceae have low S values.
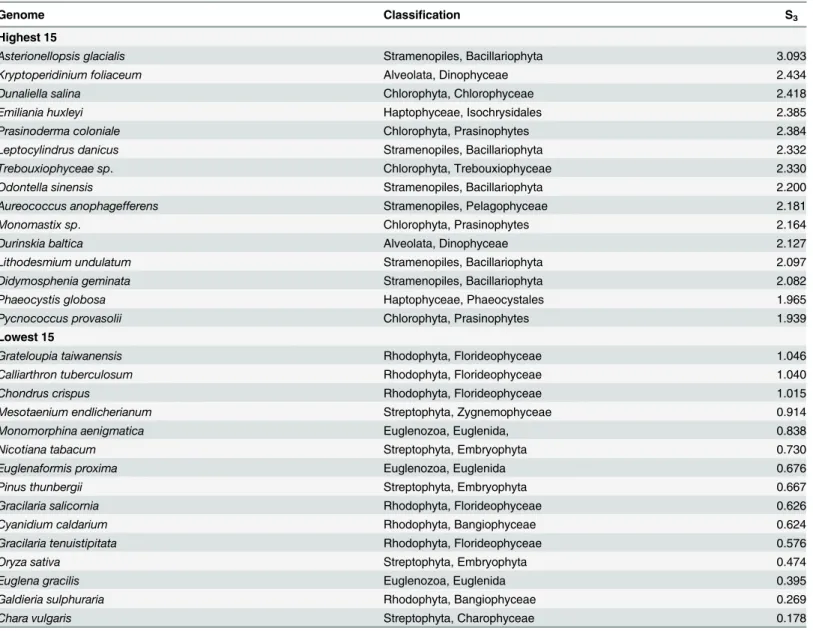
an invalid S in several genomes. Therefore, we repeated the analysis usingpsbA,rbcLandpsbC
as the high translation genes (Table 5) to generate a second S value that we call S3. The genomes
with the lowest S3values are essentially the same as those with the lowest S values but the
genomes with the highest S3values are different. Since none of the 15 genomes with the highest
S3values had a valid S and some of the genomes with the highest S values did not have a valid
S3(S1 Table) the two sets of putative strong selection genomes are not directly comparable but
we interpret either a high S or a high S3as an indication of strong selection.
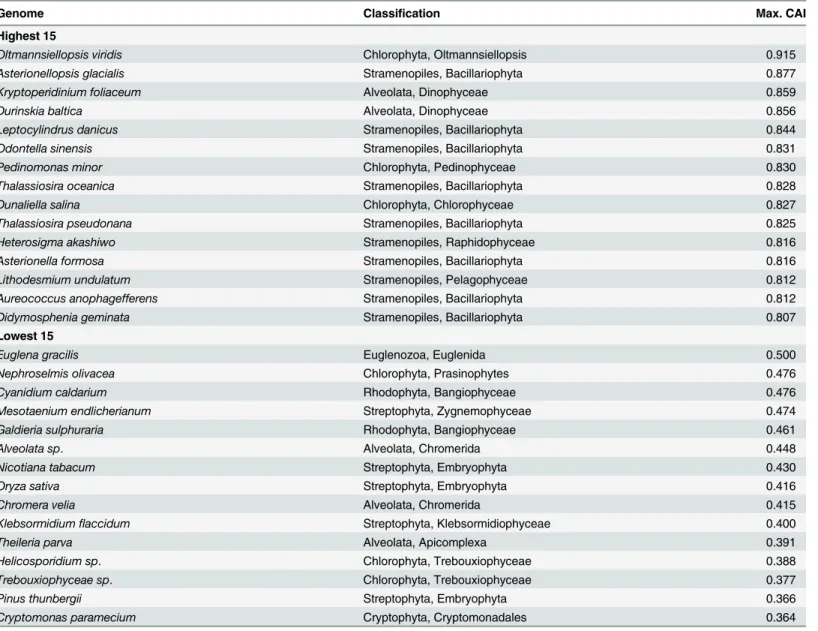
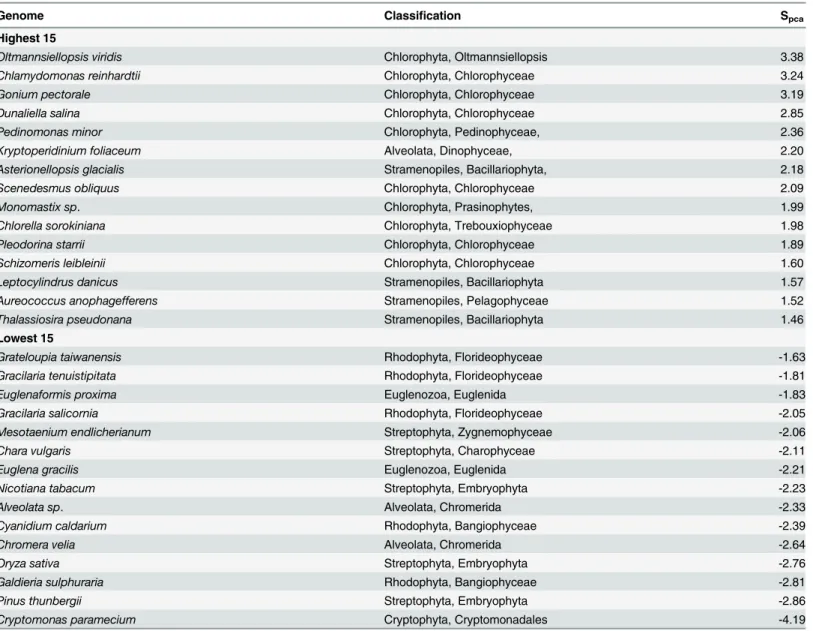
Maximal Codon Adaptation Index (CAI). Selection strength can also be assessed from the maximum CAI value observed for a gene in any given genome (Table 6), which ispsbAin almost every genome (data not shown). As with the S statistic, the maximum CAI value pro-vides information about the strength of selection on highly expressed genes but not about the number of genes that are under selection. Since all CAI values are based on the single set of codon fitness values (seeMaterials and Methods), they are comparable among different genes and genomes. Taxa with the highest maximal CAI values are predominantly members of the Table 4. Genomes with the Lowest and Highest S Coefficients.
Genome Classification S
Highest 15
Chaetosphaeridium globosum Streptophyta, Coleochaetophyceae 3.405
Coscinodiscus radiatus Stramenopiles, Bacillariophyta 3.146
Vaucheria litorea Stramenopiles, PX_clade 2.998
Mesostigma viride Streptophyta, Mesostigmatophyceae 2.989
Marchantia polymorpha Streptophyta, Embryophyta 2.973
Pseudendoclonium akinetum Chlorophyta, Ulvophyceae 2.953
Phaeodactylum tricornutum Stramenopiles, Bacillariophyta 2.752
Asterionella formosa Stramenopiles, Bacillariophyta 2.745
Schizomeris leibleinii Chlorophyta, Chlorophyceae 2.743
Roya anglica Streptophyta, Zygnemophyceae 2.640
Fucus vesiculosus Stramenopiles, PX_clade 2.604
Porphyra yezoensis Rhodophyta, Bangiophyceae 2.568
Chlorella sorokiniana Chlorophyta, Trebouxiophyceae 2.564
Guillardia theta Cryptophyta, Pyrenomonadales 2.545
Pyropia haitanensis Rhodophyta, Bangiophyceae 2.452
Lowest 15
Grateloupia taiwanensis Rhodophyta, Florideophyceae, 1.621
Cyanidioschyzon merolae Rhodophyta, Bangiophyceae, 1.554
Monomorphina aenigmatica Euglenozoa, Euglenida, 1.501
Pinus thunbergii Streptophyta, Embryophyta 1.414
Nicotiana tabacum Streptophyta, Embryophyta 1.226
Chondrus crispus Rhodophyta, Florideophyceae 1.204
Euglenaformis proxima Euglenozoa, Euglenida 1.062
Oryza sativa Streptophyta, Embryophyta 1.026
Chromera velia Alveolata, Chromerida, 1.010
Gracilaria tenuistipitata Rhodophyta, Florideophyceae 0.843
Chara vulgaris Streptophyta, Charophyceae 0.816
Gracilaria salicornia Rhodophyta, Florideophyceae 0.814
Galdieria sulphuraria Rhodophyta, Bangiophyceae 0.566
Cyanidium caldarium Rhodophyta, Bangiophyceae 0.562
Euglena gracilis Euglenozoa, Euglenida 0.453
Chlorophyta, Stramenopiles and Alveolata. Genomes with low maximal CAI values are pre-dominantly vascular plants and members of the Rhodophyta meaning that codon adaptation is relatively weak in these taxa. One interesting case is the ChlorophyteTrebouxiophyceae sp. which has a low maximal CAI. This genome also had a low rejection rate in the resampling analysis but it ranked relatively high in the S3analysis. Of interest is that this is the only plastid
genome in the analysis with a genome GC content over 50% (57.5%) and the only one with a GC3 content over 50% (63.5%). Since the calculation of S is based on the difference between genome composition and the composition of designated genes, the S3result for this species is
probably a result of its unusual genome composition.
A combined measurement of selection. The three analyses presented above, the resam-pling test, the S values and the maximal CAI values, measure different aspects of codon adapta-tion. In an attempt to unify them we followed the example of [26] and generated a single Table 5. Genomes with the Lowest and Highest S3Coefficients1.
Genome Classification S3
Highest 15
Asterionellopsis glacialis Stramenopiles, Bacillariophyta 3.093
Kryptoperidinium foliaceum Alveolata, Dinophyceae 2.434
Dunaliella salina Chlorophyta, Chlorophyceae 2.418
Emiliania huxleyi Haptophyceae, Isochrysidales 2.385
Prasinoderma coloniale Chlorophyta, Prasinophytes 2.384
Leptocylindrus danicus Stramenopiles, Bacillariophyta 2.332
Trebouxiophyceae sp. Chlorophyta, Trebouxiophyceae 2.330
Odontella sinensis Stramenopiles, Bacillariophyta 2.200
Aureococcus anophagefferens Stramenopiles, Pelagophyceae 2.181
Monomastix sp. Chlorophyta, Prasinophytes 2.164
Durinskia baltica Alveolata, Dinophyceae 2.127
Lithodesmium undulatum Stramenopiles, Bacillariophyta 2.097
Didymosphenia geminata Stramenopiles, Bacillariophyta 2.082
Phaeocystis globosa Haptophyceae, Phaeocystales 1.965
Pycnococcus provasolii Chlorophyta, Prasinophytes 1.939
Lowest 15
Grateloupia taiwanensis Rhodophyta, Florideophyceae 1.046
Calliarthron tuberculosum Rhodophyta, Florideophyceae 1.040
Chondrus crispus Rhodophyta, Florideophyceae 1.015
Mesotaenium endlicherianum Streptophyta, Zygnemophyceae 0.914
Monomorphina aenigmatica Euglenozoa, Euglenida, 0.838
Nicotiana tabacum Streptophyta, Embryophyta 0.730
Euglenaformis proxima Euglenozoa, Euglenida 0.676
Pinus thunbergii Streptophyta, Embryophyta 0.667
Gracilaria salicornia Rhodophyta, Florideophyceae 0.626
Cyanidium caldarium Rhodophyta, Bangiophyceae 0.624
Gracilaria tenuistipitata Rhodophyta, Florideophyceae 0.576
Oryza sativa Streptophyta, Embryophyta 0.474
Euglena gracilis Euglenozoa, Euglenida 0.395
Galdieria sulphuraria Rhodophyta, Bangiophyceae 0.269
Chara vulgaris Streptophyta, Charophyceae 0.178
1–The S3coefficient as defined in the text.
summary statistic of codon adaptation by performing a principal component analysis on the percent rejection in the resampling test, S3values and maximal CAI and taking the value along
the first principal component for each genome. This summary statistic, which we call Spca, is
given inS1 Tablefor all genomes with a valid S3. (S3was chosen over S since more genomes
had a valid S3measurement.) The results are summarized inTable 7and presented graphically
inFig 3, which shows the general strength of codon adaptation in the major plastid lineages.
Correspondence analysis
Multivariate ordination analysis methods, e.g. principal components analysis and correspon-dence analysis, have been used to identify orthogonal axes that successively explain the most variation in codon usage among genes. We performed a correspondence analysis to compare to the codon adaptation results. Within-group Correspondence Analysis (WCA) can separate different directions of synonymous codon usage biases (as orthogonal axes) such as those Table 6. Genomes ranked by the maximal CAI value.
Genome Classification Max. CAI
Highest 15
Oltmannsiellopsis viridis Chlorophyta, Oltmannsiellopsis 0.915
Asterionellopsis glacialis Stramenopiles, Bacillariophyta 0.877
Kryptoperidinium foliaceum Alveolata, Dinophyceae 0.859
Durinskia baltica Alveolata, Dinophyceae 0.856
Leptocylindrus danicus Stramenopiles, Bacillariophyta 0.844
Odontella sinensis Stramenopiles, Bacillariophyta 0.831
Pedinomonas minor Chlorophyta, Pedinophyceae 0.830
Thalassiosira oceanica Stramenopiles, Bacillariophyta 0.828
Dunaliella salina Chlorophyta, Chlorophyceae 0.827
Thalassiosira pseudonana Stramenopiles, Bacillariophyta 0.825
Heterosigma akashiwo Stramenopiles, Raphidophyceae 0.816
Asterionella formosa Stramenopiles, Bacillariophyta 0.816
Lithodesmium undulatum Stramenopiles, Pelagophyceae 0.812
Aureococcus anophagefferens Stramenopiles, Bacillariophyta 0.812
Didymosphenia geminata Stramenopiles, Bacillariophyta 0.807
Lowest 15
Euglena gracilis Euglenozoa, Euglenida 0.500
Nephroselmis olivacea Chlorophyta, Prasinophytes 0.476
Cyanidium caldarium Rhodophyta, Bangiophyceae 0.476
Mesotaenium endlicherianum Streptophyta, Zygnemophyceae 0.474
Galdieria sulphuraria Rhodophyta, Bangiophyceae 0.461
Alveolata sp. Alveolata, Chromerida 0.448
Nicotiana tabacum Streptophyta, Embryophyta 0.430
Oryza sativa Streptophyta, Embryophyta 0.416
Chromera velia Alveolata, Chromerida 0.415
Klebsormidiumflaccidum Streptophyta, Klebsormidiophyceae 0.400
Theileria parva Alveolata, Apicomplexa 0.391
Helicosporidium sp. Chlorophyta, Trebouxiophyceae 0.388
Trebouxiophyceae sp. Chlorophyta, Trebouxiophyceae 0.377
Pinus thunbergii Streptophyta, Embryophyta 0.366
Cryptomonas paramecium Cryptophyta, Cryptomonadales 0.364
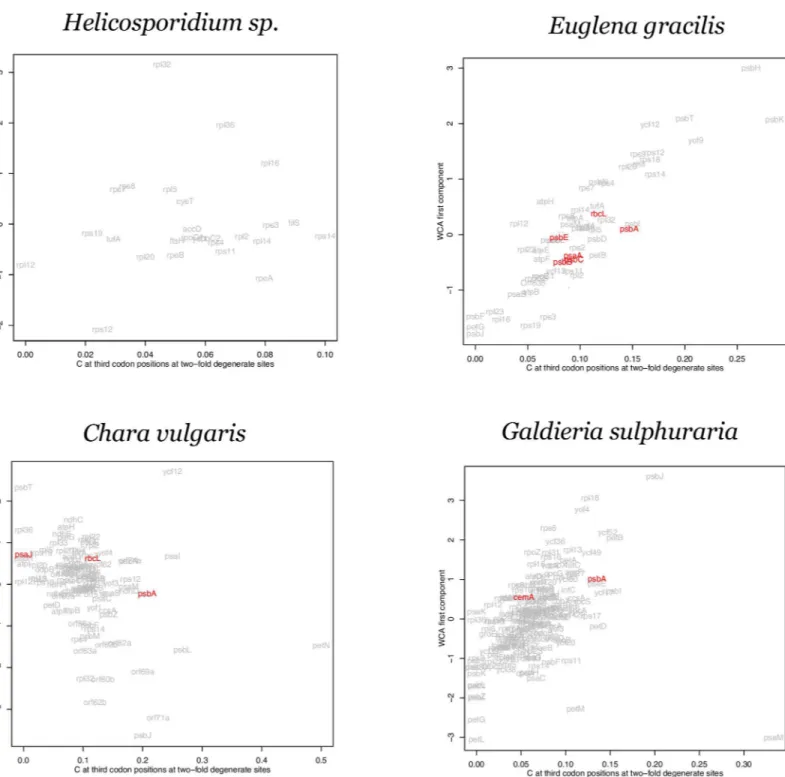
towards NNA and NNT codons, or towards adaptive/favored codons [27,28]. Based on the adaptive pattern observed in thepsbAgenes inTable 1, we compared the first axis of a WCA to the C content at third codon positions over the nine two-fold degenerate amino acids. The results are shown for representative genomes with a low S value or a low rejection rate in the resampling test (Fig 4) and with high S values (Fig 5).
Overall, variation in NNC content is correlated with the primary axis in most genomes (data not shown) with the interesting exceptions beingTheilariaandHelicosporidium, the highly reduced genomes discussed above for which no gene was rejected in our resampling test.
Genome structure
The GC skew index (GCSI) value ranges for different plastid genomes are summarized inFig 6
and all values are presented inS1 Table. Seed plants (represented byPinus thunbergii, Table 7. Genomes with the strongest and weakest overall codon adaptation as measured by Spca.
Genome Classification Spca
Highest 15
Oltmannsiellopsis viridis Chlorophyta, Oltmannsiellopsis 3.38
Chlamydomonas reinhardtii Chlorophyta, Chlorophyceae 3.24
Gonium pectorale Chlorophyta, Chlorophyceae 3.19
Dunaliella salina Chlorophyta, Chlorophyceae 2.85
Pedinomonas minor Chlorophyta, Pedinophyceae, 2.36
Kryptoperidinium foliaceum Alveolata, Dinophyceae, 2.20
Asterionellopsis glacialis Stramenopiles, Bacillariophyta, 2.18
Scenedesmus obliquus Chlorophyta, Chlorophyceae 2.09
Monomastix sp. Chlorophyta, Prasinophytes, 1.99
Chlorella sorokiniana Chlorophyta, Trebouxiophyceae 1.98
Pleodorina starrii Chlorophyta, Chlorophyceae 1.89
Schizomeris leibleinii Chlorophyta, Chlorophyceae 1.60
Leptocylindrus danicus Stramenopiles, Bacillariophyta 1.57
Aureococcus anophagefferens Stramenopiles, Pelagophyceae 1.52
Thalassiosira pseudonana Stramenopiles, Bacillariophyta 1.46
Lowest 15
Grateloupia taiwanensis Rhodophyta, Florideophyceae -1.63
Gracilaria tenuistipitata Rhodophyta, Florideophyceae -1.81
Euglenaformis proxima Euglenozoa, Euglenida -1.83
Gracilaria salicornia Rhodophyta, Florideophyceae -2.05
Mesotaenium endlicherianum Streptophyta, Zygnemophyceae -2.06
Chara vulgaris Streptophyta, Charophyceae -2.11
Euglena gracilis Euglenozoa, Euglenida -2.21
Nicotiana tabacum Streptophyta, Embryophyta -2.23
Alveolata sp. Alveolata, Chromerida -2.33
Cyanidium caldarium Rhodophyta, Bangiophyceae -2.39
Chromera velia Alveolata, Chromerida -2.64
Oryza sativa Streptophyta, Embryophyta -2.76
Galdieria sulphuraria Rhodophyta, Bangiophyceae -2.81
Pinus thunbergii Streptophyta, Embryophyta -2.86
Cryptomonas paramecium Cryptophyta, Cryptomonadales -4.19
Nicotiana tabacumandOryza sativain this study) are not included in the summary since their chloroplast genomes do not replicate from a single origin [42,43].
We also tested whether or not genes tend to be coded on the leading strand. For the 68 plas-tid genomes with a GCSI over 0.1 the ratio of inferred leading strand genes to inferred lagging strand genes ranged from 0.46 to 1.00 with a median value of 0.70 (Fig 7). However, there was no indication that genes with high CAI values were coded on the leading strand (data not shown).
Discussion
Similar to what is observed in bacteria [44] low expression plastid genes display a codon usage with a general bias towards NNA and NNT codons, consistent with the general substitution bias towards A+T that is prevalent across plastid genomes [15,19]. In contrast, highly Fig 3. Strength of codon adaptation across lineages.A phylogeny of plastids with the strength of codon adaptation indicated for different lineages. Strength of selection is based on the Spcameasure described in the text and given inS1 Table. An average value for the plastids within a given lineage
greater than 1 is considered strong adaptation and an average value less than -1 is considered weak adaptation. A dashed line indicates variation within the genomes of that lineage. The primary endosymbiont is indicated as are the two proposed secondary events, one from green plant ancestors to the Euglenoids and another from the red algae ancestors to the lineage leading to extant Cryptophytes, Alveolates, Stramenopiles and Haptophytes (see text). Branches preceding the endosymbiosis are shaded black and indicate a lack of a plastid. The phylogeny overall is based on the general relationships from different sources [13,14].
translated plastid genes, exemplified bypsbA, across a wide range of taxa display a codon usage pattern that is distinct from low expression genes (Table 1, Figs1&2). Since the bias towards C at the third codon position of some codon groups but towards T, away from both C and A, in other codon groups (Table 1), is not consistent with a general mutational model, some form Fig 4. Within-group correspondence analysis (WCA) of codon usage for genomes with low S values.WCA first component plot against %C at two-fold degenerate sites for four plastid genomes inferred to be under weak selection;Helicosporidium sp,Euglena gracilis,Chara vulgarisandGaldieria sulphuraria. Genes rejected in the resampling test are highlighted in red. Gene names are given based on NCBI annotation. Full taxon names from the NCBI annotation are given.
of selection is required to explain the codon usage of these high expression genes such aspsbA. We argue that this selection is for translation efficiency: the protein product ofpsbAundergoes oxidative damage during the light reaction and, as a result, is turned over at an extremely high rate making it the major translation product in chloroplasts [25,45]. This makes it likely that the predominant selective pressure generating this codon usage is to increase translation effi-ciency [15,25] and so we propose that the pattern of codon usage observed in thepsbAgenes in
Table 1and in the other high expression genes reflects codon adaptation in plastids.
Fig 5. Within-group correspondence analysis (WCA) of codon usage for genomes with high S values.WCA first component plot against %C at two-fold degenerate sites for four plastid genomes inferred to be under strong selection;Chaetosphaeridium globosum,Dunaliella salina,Chlamydomonas reinhardtiiandPseudendoclonium akinetum. Genes rejected in the resampling test are highlighted in red. Gene names are given based on NCBI annotation. Full taxon names from the NCBI annotation are given.
This proposal concerning codon adaptation is also consistent with the match between the high frequency of NNC codons and the plastid tRNA population; each of the 38 plastid genomes listed in the tRNA database [24] (http://trna.ie.niigata-u.ac.jp/, seeTable 1) has a sin-gle tRNA to translate the NNY codon group and in each case the anticodon is complementary to the NNC codon. Since there is no evidence for import of tRNAs from the cytoplasm [46] the tRNA population indicated inTable 1represents those available for translation of plastid-encoded genes. This codon bias in highly expressed plastid genes is consistent with the pro-posal that codon selection would be expected to favor C over T in the TTY, TAY, ATY and AAY degenerate groups in all species [7]. The clustering of high translation genes from differ-ent taxa suggests that codon adaptation favors the same, or a very similar, set of adaptive codons across plastid genomes. Differences betweenpsbA,rbcLandpsbCinFig 2would then reflect different levels of codon adaptation based on different levels of translation.
Fig 6. GC Skew in plastid genomes.Box-and-whisker plots summarizing the GC skew index (GCSI) for plastid genomes of different lineages.
Although a recent article [47] has claimed that plastid genes do not display codon adapta-tion, this analysis, and some earlier studies [15,25], have shown compelling evidence for codon adaptation in highly expressed plastid genes. The existence of codon adaptation, along with the context-dependent nature of substitutions in the chloroplast genome [16–18], makes analyses of codon usage in plastid genomes more complex than is frequently considered. For example, a number of recent studies, particularly in flowering plants [48–51], failed to account for codon adaptation and context-dependency with the result that their conclusions concerning selection are likely to be incorrect or only partially correct. The conclusions in these analyses concerning selection based on plots of Effective Number of Codon plotted against %G+C content at third codon positions (ENC-GC3plot) were all based on the assumption that every synonymous site
should display a uniform equilibrium A+T content. However, because of the context-depen-dent nature of substitutions [16–18] the expected equilibrium A+T composition varies signifi-cantly across sites and this draws into question any conclusions in these studies about selection on codon usage. In another example, Guisingeret al. [52] analyzed chloroplast genomes from the family Geraniaceae using an ENC-GC3plot and suggest that relaxed selection and/or
muta-tional biases lead to increased G+C content, which in turn led to a change in codon usage bias. However, since this analysis fails to account for the context-dependency of equilibrium base frequencies the suggestion is unwarranted. Further, given the evidence presented here, analyses Fig 7. Gene distribution by strand in plastid genomes.Box-and-whisker plots summarizing the distributions of the ratio of leading strand genes to the total number of genes for chloroplasts from nine phyla. A deviation from the ratio = 0.5 (red line) indicates that genes tend to be unevenly distributed between the leading and lagging strands of DNA replication.
of plastid codon usage need to be performed within the context of codon adaptation on highly expressed or translated genes.
The evidence that different plastid lineages show the same adaptive codon usage pattern allows us to measure the degree of‘fit’of any gene to this pattern. Although this does not require that the underlying explanation is necessarily codon adaptation, we interpret the degree of fit as a measure of the level of codon adaptation, which would also represent the strength of selection, on a given gene. Therefore, comparisons of genes across genomes will give evidence for different levels of selection in different lineages.
No single measure captures all aspects of codon adaptation so three different metrics of selection strength were presented along with a proposed unifying measurement that we called Spca. The resampling test can measure the“breadth”of selection in terms of how many genes
may be under selective pressure, but S and maximal CAI provide evidence for the strength of selection on the most highly expressed genes. One drawback to our measurement of S is the low number of genes in the plastid genome, which limits the number of reference genes that can be used. This results in many genomes having no valid S value, something that also limits calculations of Spca.
Despite these drawbacks, the data indicate that the Embryophyta and the Rhodophyta other than the Bangiales have relatively weak codon adaptation. In contrast, the evidence suggests that the Chlorophyceae clade of the Chlorophyta,Cyanophora paradox(the lone Glaucocysto-phyceae), the Dinophyceae (Alveolata) and the Bacillariophyta (Stramenopiles) are under rela-tively strong selection for codon adaptation. Noticeably,Helicosporidiumsp.,Theileria parva, which seem to be under very weak codon adaptation as discussed above, did not have valid Spca
measures (and so are not given inTable 7). However, given the results of the individual metrics we would infer that these two genomes have among the weakest codon adaptation levels. In fact, given the data above we infer that there is virtually no codon adaptation in either of these two genomes. The mapping inFig 3indicates that strong codon adaptation is distributed widely making it difficult to infer whether or not it is an ancestral state but given the presence of at least weak codon adaptation in essentially every plastid genome it is likely that the primary endosymbiont had some degree of adaptation.
Variation across taxa in the level of codon adaptation could have a number of causes [3]. Although the plastid genomes share a relatively conserved set of genes it is likely that the trans-lation level of a specific gene varies across genomes. The results strongly suggest that some genes,psbAin particular but alsorbcLand a few others (Table 2), are highly translated across most, or all, taxa but other genes might have stronger variation. A broad analysis of translation rates across different genes and plastid lineages would be required to assess this, and to com-pare codon adaptation to translation level generally. This is not a trivial comparison. We have focused on translation level with respect to codon adaptation since selection on codon usage is most likely to act at the level of protein translation. However, it is not established that this is the only, or even predominant, aspect of gene expression that could influence codon adaptation and even the manner in which translation level might be related to codon usage could be extremely complex [3]. Considering this, and the observation that chloroplast protein levels are not significantly influenced by changes in transcript abundance [53], transcript abundance is probably not well correlated with codon adaptation [3]. Therefore, even though some tran-script data are available for chloroplasts [54] they are not informative for this type of study. Overall, how the levels of codon adaptation we measure are related to gene expression will require a complex analysis of different stages of expression.
Another consideration is variation in effective population size (Ne). Species with lower Ne
drift. Since selection on codon bias involves very small selective differences between synony-mous codons [55] we would only expect to find evidence for codon adaptation in species with fairly large effective population sizes. This would be similar to studies of bacteria showing that relatively recent reductions in effective population size have led to a relaxation of selective pres-sure on codon usage [2,7]. Selective pressures on seed plants may not be different than what exists in the Chlorophyta but a difference in Newould lead to the observed difference in levels
of codon adaptation. Overall, the variation in codon adaptation that we observe is likely to result from a combination of all of these factors.
The evidence from our WCA is consistent with the other analyses of codon adaptation. There is a consistent separation ofpsbAalong the two axes except for certain genomes that show evidence for relatively weak selection such asCyanidium caldarium,Euglena gracilis,
Chara vulgaris,Gracilaria salicornia,Euglenaformis proxima, andGaldieria sulphuraria. Inter-estingly, the genespsbJandpetLstand out along the primary axis in several genomes. Both of these genes are very short (amino acid length ranges from 39 to 50 forpsbJ, and from 27 to 62 forpetL) and so, although it is possible that they are under relatively strong codon adaptation in some genomes, codon sampling error (due to the short gene length) makes it difficult to be conclusive.
In each of the WCA plots (Fig 4andFig 5) the genes rejected by the resample study in each genome are highlighted. These genes do no generally display a complete separation from the other genes along the primary axis. This supports the data fromTable 1andFig 2that indi-cated that codon adaptation must involve more than just the NNC codons of two-fold degener-ate groups. As stdegener-ated above, the NNC codons are useful as an estimdegener-ate of codon adaptation but they are not a complete description. The codon usage of different clusters inFig 1show that the usage of NNT codons in four-fold degenerate groups is correlated with the bias towards NNC codons of two-fold degenerate groups in high expression genes (Fig 2). Therefore, although the NNC codons are not a complete measure of codon adaptation, the WCA results strongly support the general proposal concerning codon adaptation across plastid genes.
We also compared codon adaptation to aspect of genome organization or structure. No rela-tionship is observed between our measures of the strength of selection on codon usage, covered above, and degree of skew: GCSI is not correlated with percentage rejection in the resampling, with S or with maximum CAI (data not shown). The lineages with the strongest skews inFig 6
are the Euglenazoa (such asE.gracilis), which have weak codon adaptation, and the Alveolata. The Chlorophyta, which have very strong adaptation, show very little skew, lower than the Rhodophyta, which are generally under weak adaptation. The one group of Rhodophyta with strong adaptation, the Bangiales, has relatively low skew. Overall there is no discernible rela-tionship between skew and codon adaptation. Many prokaryotic genomes display asymmetric base composition between the leading and lagging strands of replication [56–59] and some have a tendency to code highly expressed genes on the leading strand [59–61]. Strand asymme-try, or skew, in composition and/or gene content is also observed in some plastid genomes [41,62,63] includingE.gracilis[64] although no systematic analysis of genome skew across dif-ferent plastids has been performed. The evidence here that plastid genes with high CAI values are not preferentially coded on the leading strand could be due to the fact that high expression genes are under strong selection for codon usage because of pressures at the translation level, not the transcription level.
Conclusions
bias towards A+T and selection for adaptive codons that are favored by selection for translation efficiency, as with the basic model presented for bacteria [7]. Given the similarity in the codon usage of thepsbAgene from different plastid genomes, the evidence indicates that although there is variation in the strength of selection across genomes and genes, the set of adaptive codons is the same across all plastid genomes, possibly as a result of similar tRNA gene con-tents (seeS4 Table).
Supporting Information
S1 Table. Taxonomic information and summary statistics for the 103 genomes analyzed in this study.
(XLSX)
S2 Table. Codon fitness values, as defined in the Materials and Methods, used to calculate CAI values.
(XLSX)
S3 Table. Cumulative codon usages for the high and low expression genes clustered inFig 1.
(DOCX)
S4 Table. tRNA genes coded in the curated 38 plastid genomes as indicated in the Materials and Methods.Presence (1) or absence (0) of a complementary tRNA is indicated. Some genomes contain multiple tRNA genes with the same anticodon sequence but these are not enumerated.
(XLSX)
Author Contributions
Conceived and designed the experiments: HS BM. Performed the experiments: HS BM. Ana-lyzed the data: HS BM. Contributed reagents/materials/analysis tools: HS BM. Wrote the paper: HS BM. Designed software used in analysis: HS BM.
References
1. Bulmer M (1991) The selection-mutation-drift theory of synonymous codon usage. Genetics 129: 897– 907. PMID:1752426
2. Sharp PM, Emery LR, Zeng K (2010) Forces that influence the evolution of codon bias. Philos Trans R Soc Lond B Biol Sci 365: 1203–1212. doi:10.1098/rstb.2009.0305PMID:20308095
3. Plotkin JB, Kudla G (2011) Synonymous but not the same: the causes and consequences of codon bias. Nat Rev Genet 12: 32–42. doi:10.1038/nrg2899PMID:21102527
4. Ermolaeva MD (2001) Synonymous codon usage in bacteria. Curr Issues Mol Biol 3: 91–97. PMID: 11719972
5. Hershberg R, Petrov DA (2008) Selection on codon bias. Annu Rev Genet 42: 287–299. doi:10.1146/ annurev.genet.42.110807.091442PMID:18983258
6. Ikemura T (1985) Codon usage and tRNA content in unicellular and multicellular organisms. Mol Biol Evol 2: 13–34. PMID:3916708
7. Sharp PM, Bailes E, Grocock RJ, Peden JF, Sockett RE (2005) Variation in the strength of selected codon usage bias among bacteria. Nucleic Acids Res 33: 1141–1153. PMID:15728743
8. Akashi H (1994) Synonymous codon usage inDrosophila melanogaster: natural selection and transla-tional accuracy. Genetics 136: 927–935. PMID:8005445
9. Rocha EP (2004) Codon usage bias from tRNA's point of view: redundancy, specialization, and efficient decoding for translation optimization. Genome Res 14: 2279–2286. PMID:15479947
11. Sharp PM, Li WH (1987) The codon adaptation index—a measure of directional synonymous codon usage bias, and its potential applications. Nucleic Acids Res 15: 1281–1295. PMID:3547335
12. Wright F (1990) The 'effective number of codons' used in a gene. Gene 87: 23–29. PMID:2110097
13. Keeling PJ (2004) Diversity and evolutionary history of plastids and their hosts. Am J Bot 91: 1481– 1493. doi:10.3732/ajb.91.10.1481PMID:21652304
14. Reyes-Prieto A, Weber AP, Bhattacharya D (2007) The origin and establishment of the plastid in algae and plants. Annu Rev Genet 41: 147–168. PMID:17600460
15. Morton BR (1998) Selection on the codon bias of chloroplast and cyanelle genes in different plant and algal lineages. J Mol Evol 46: 449–459. PMID:9541540
16. Morton BR, Clegg MT (1995) Neighboring base composition is strongly correlated with base substitu-tion bias in a region of the chloroplast genome. J Mol Evol 41: 597–603. PMID:7490774
17. Morton BR, Oberholzer VM, Clegg MT (1997) The influence of specific neighboring bases on substitu-tion bias in noncoding regions of the plant chloroplast genome. J Mol Evol 45: 227–231. PMID: 9302315
18. Zheng T, Ichiba T, Morton BR (2007) Assessing substitution variation across sites in grass chloroplast DNA. J Mol Evol 64: 605–613. PMID:17541677
19. Morton BR (2003) The role of context-dependent mutations in generating compositional and codon usage bias in grass chloroplast DNA. J Mol Evol 56: 616–629. PMID:12698298
20. Arakawa K, Mori K, Ikeda K, Matsuzaki T, Kobayashi Y, Tomita M (2003) G-language Genome Analysis Environment: a workbench for nucleotide sequence data mining. Bioinformatics 19: 305–306. PMID: 12538262
21. Arakawa K, Tomita M (2006) G-language System as a platform for large-scale analysis of high-through-put omics data. J Pesticide Sci 31: 282–288.
22. Arakawa K, Suzuki H, Tomita M (2008) Computational Genome Analysis Using The G-language Sys-tem. Genes, Genomes and Genomics 2: 1–13.
23. R_Core_Team (2012) R: A language and environment for statistical computing. R Foundation for Sta-tistical Computing, Vienna, Austria.
24. Abe T, Inokuchi H, Yamada Y, Muto A, Iwasaki Y, Ikemura T (2014) tRNADB-CE: tRNA gene database well-timed in the era of big sequence data. Front Genet 5: 114. doi:10.3389/fgene.2014.00114PMID: 24822057
25. Morton BR (1993) Chloroplast DNA codon use: evidence for selection at the psb A locus based on tRNA availability. J Mol Evol 37: 273–280. PMID:8230251
26. Vieira-Silva S, Rocha EP (2010) The systemic imprint of growth and its uses in ecological (meta)geno-mics. PLoS Genet 6: e1000808. doi:10.1371/journal.pgen.1000808PMID:20090831
27. Charif D, Thioulouse J, Lobry JR, Perriere G (2005) Online synonymous codon usage analyses with the ade4 and seqinR packages. Bioinformatics 21: 545–547. PMID:15374859
28. Suzuki H, Brown CJ, Forney LJ, Top EM (2008) Comparison of correspondence analysis methods for synonymous codon usage in bacteria. DNA Res 15: 357–365. doi:10.1093/dnares/dsn028PMID: 18940873
29. Arakawa K, Tomita M (2007) The GC skew index: a measure of genomic compositional asymmetry and the degree of replicational selection. Evol Bioinform Online 3: 159–168. PMID:19461976
30. Arakawa K, Suzuki H, Tomita M (2009) Quantitative analysis of replication-related mutation and selec-tion pressures in bacterial chromosomes and plasmids using generalised GC skew index. BMC Geno-mics 10: 640. doi:10.1186/1471-2164-10-640PMID:20042086
31. Arakawa K, Tomita M (2012) Measures of compositional strand bias related to replication machinery and its applications. Curr Genomics 13: 4–15. doi:10.2174/138920212799034749PMID:22942671
32. Glockner G, Rosenthal A, Valentin K (2000) The structure and gene repertoire of an ancient red algal plastid genome. J Mol Evol 51: 382–390. PMID:11040290
33. Hwang S, Kawazoe R, Herrin DL (1996) Transcription oftufAand other chloroplast-encoded genes is controlled by a circadian clock inChlamydomonas. Proc Natl Acad Sci U S A 93: 996–1000. PMID: 8577775
34. Tsunoyama Y, Ishizaki Y, Morikawa K, Kobori M, Nakahira Y, Takeba G, et al. (2004) Blue light-induced transcription of plastid-encodedpsbDgene is mediated by a nuclear-encoded transcription initiation factor, AtSig5. Proc Natl Acad Sci U S A 101: 3304–3309. PMID:14976253
36. Chen Z, Schertz KF, Mullet JE, DuBell A, Hart GE (1995) Characterization and expression ofrpoC2in CMS and fertile lines of sorghum. Plant Mol Biol 28: 799–809. PMID:7640353
37. Krech K, Ruf S, Masduki FF, Thiele W, Bednarczyk D, Albus CA, et al. (2012) The plastid genome-encoded Ycf4 protein functions as a nonessential assembly factor for photosystem I in higher plants. Plant Physiol 159: 579–591. doi:10.1104/pp.112.196642PMID:22517411
38. Little MC, Hallick RB (1988) ChloroplastrpoA,rpoB, andrpoCgenes specify at least three components of a chloroplast DNA-dependent RNA polymerase active in tRNA and mRNA transcription. J Biol Chem 263: 14302–14307. PMID:3049574
39. Xie Z, Merchant S (1996) The plastid-encodedccsAgene is required for heme attachment to chloro-plastc-type cytochromes. J Biol Chem 271: 4632–4639. PMID:8617725
40. Gardner MJ, Bishop R, Shah T, de Villiers EP, Carlton JM, Hall N, et al. (2005) Genome sequence of
Theileria parva, a bovine pathogen that transforms lymphocytes. Science 309: 134–137. PMID: 15994558
41. de Koning AP, Keeling PJ (2006) The complete plastid genome sequence of the parasitic green alga
Helicosporidiumsp. is highly reduced and structured. BMC Biol 4: 12. PMID:16630350
42. Kunnimalaiyaan M, Nielsen BL (1997) Fine mapping of replication origins (oriA andoriB) inNicotiana tabacumchloroplast DNA. Nucleic Acids Res 25: 3681–3686. PMID:9278490
43. Nielsen BL, Cupp JD, Brammer J (2010) Mechanisms for maintenance, replication, and repair of the chloroplast genome in plants. J Exp Bot 61: 2535–2537. doi:10.1093/jxb/erq163PMID:20513654
44. Hershberg R, Petrov DA (2010) Evidence that mutation is universally biased towards AT in bacteria. PLoS Genet 6: e1001115. doi:10.1371/journal.pgen.1001115PMID:20838599
45. Mullet JE, Klein RR (1987) Transcription and RNA stability are important determinants of higher plant chloroplast RNA levels. EMBO J 6: 1571–1579. PMID:16453773
46. Pfitzinger H, Weil JH, Pillay DT, Guillemaut P (1990) Codon recognition mechanisms in plant chloro-plasts. Plant Mol Biol 14: 805–814. PMID:2102858
47. Sugiura M (2014) Plastid mRNA translation. Methods Mol Biol 1132: 73–91. doi: 10.1007/978-1-62703-995-6_4PMID:24599847
48. Xing ZB, Cao L, Zhou M, Xiu LS (2013) [Analysis on codon usage of chloroplast genome of Eleuthero-coccus senticosus]. Zhongguo Zhong Yao Za Zhi 38: 661–665. PMID:23724670
49. Nair RR, Nandhini MB, Monalisha E, Murugan K, Sethuraman T, Ganesh D (2012) Synonymous codon usage in chloroplast genome ofCoffea arabica. Bioinformation 8: 1096–1104. doi:10.6026/
97320630081096PMID:23251044
50. Sablok G, Nayak KC, Vazquez F, Tatarinova TV (2011) Synonymous codon usage, GC(3), and evolu-tionary patterns across plastomes of three pooid model species: emerging grass genome models for monocots. Mol Biotechnol 49: 116–128. doi:10.1007/s12033-011-9383-9PMID:21308422
51. Liu Q, Xue Q (2005) Comparative studies on codon usage pattern of chloroplasts and their host nuclear genes in four plant species. J Genet 84: 55–62. PMID:15876584
52. Guisinger MM, Kuehl JV, Boore JL, Jansen RK (2011) Extreme reconfiguration of plastid genomes in the angiosperm family Geraniaceae: rearrangements, repeats, and codon usage. Mol Biol Evol 28: 583–600. doi:10.1093/molbev/msq229PMID:20805190
53. Eberhard S, Drapier D, Wollman FA (2002) Searching limiting steps in the expression of chloroplast-encoded proteins: relations between gene copy number, transcription, transcript abundance and trans-lation rate in the chloroplast ofChlamydomonas reinhardtii. Plant J 31: 149–160. PMID:12121445
54. Lee J, Kang Y, Shin SC, Park H, Lee H (2014) Combined analysis of the chloroplast genome and tran-scriptome of the Antarctic vascular plantDeschampsia antarcticaDesv. PLoS One 9: e92501. doi:10. 1371/journal.pone.0092501PMID:24647560
55. Hartl DL, Moriyama EN, Sawyer SA (1994) Selection intensity for codon bias. Genetics 138: 227–234. PMID:8001789
56. Lobry JR (1996) Asymmetric substitution patterns in the two DNA strands of bacteria. Mol Biol Evol 13: 660–665. PMID:8676740
57. Necsulea A, Lobry JR (2007) A new method for assessing the effect of replication on DNA base compo-sition asymmetry. Mol Biol Evol 24: 2169–2179. PMID:17646257
58. Morton RA, Morton BR (2007) Separating the effects of mutation and selection in producing DNA skew in bacterial chromosomes. BMC Genomics 8: 369. PMID:17935620
59. Rocha EP (2008) The organization of the bacterial genome. Annu Rev Genet 42: 211–233. doi:10. 1146/annurev.genet.42.110807.091653PMID:18605898
61. Wu H, Qu H, Wan N, Zhang Z, Hu S, Yu J (2012) Strand-biased gene distribution in bacteria is related to both horizontal gene transfer and strand-biased nucleotide composition. Genomics Proteomics Bio-informatics 10: 186–196. doi:10.1016/j.gpb.2012.08.001PMID:23084774
62. de Cambiaire JC, Otis C, Lemieux C, Turmel M (2006) The complete chloroplast genome sequence of the chlorophycean green algaScenedesmus obliquusreveals a compact gene organization and a biased distribution of genes on the two DNA strands. BMC Evol Biol 6: 37. PMID:16638149
63. de Cambiaire JC, Otis C, Turmel M, Lemieux C (2007) The chloroplast genome sequence of the green algaLeptosira terrestris: multiple losses of the inverted repeat and extensive genome rearrangements within the Trebouxiophyceae. BMC Genomics 8: 213. PMID:17610731
![Fig 2. Third position composition patterns. A plot of %C (C/[C+T]) base composition at two-fold degenerate and four-fold degenerate sites for the genes shown in Fig 1](https://thumb-eu.123doks.com/thumbv2/123dok_br/18194306.332693/9.918.310.812.111.510/position-composition-patterns-composition-degenerate-degenerate-genes-shown.webp)