Insight into Slow Inactivation Associated Excitability in
Cardiac Cells
Zheng Zhang., Zhiwen Zhao., Yongfeng Liu., Wei Wang, Ying Wu*, Jiuping Ding*
Key Laboratory of Molecular Biophysics of the Ministry of Education, School of Life Science and Technology, Huazhong University of Science and Technology, Wuhan, Hubei, China
Abstract
Voltage-gated sodium channel Nav1.5 has been linked to the cardiac cell excitability and a variety of arrhythmic syndromes including long QT, Brugada, and conduction abnormalities. Nav1.5 exhibits a slow inactivation, corresponding to a duration-dependent bi-exponential recovery, which is often associated with various arrhythmia syndromes. However, the gating mechanism of Nav1.5 and the physiological role of slow inactivation in cardiac cells remain elusive. Here a 12-state two-step inactivation Markov model was successfully developed to depict the gating kinetics of Nav1.5. This model can simulate the Nav1.5 channel in not only steady state processes, but also various transient processes. Compared with the simpler 8-state model, this 12-state model is well-behaved in simulating and explaining the processes of slow inactivation and slow recovery. This model provides a good framework for further studying the gating mechanism and physiological role of sodium channel in excitable cells.
Citation:Zhang Z, Zhao Z, Liu Y, Wang W, Wu Y, et al. (2013) Kinetic Model of Nav1.5 Channel Provides a Subtle Insight into Slow Inactivation Associated Excitability in Cardiac Cells. PLoS ONE 8(5): e64286. doi:10.1371/journal.pone.0064286
Editor:Zhe Zhang, Virginia Commonwealth University, United States of America
ReceivedJanuary 21, 2013;AcceptedApril 10, 2013;PublishedMay 16, 2013
Copyright:ß2013 Zhang, et al. This is an open-access article distributed under the terms of the Creative Commons Attribution License, which permits unrestricted use, distribution, and reproduction in any medium, provided the original author and source are credited.
Funding:This work s supported by
( . The funders had no role in study design, data collection and analysis, decision to publish, or preparation of the manuscript.
Competing Interests:The authors have declared that no competing interests exist.
* E-mail: [email protected] (YW); [email protected] (JD)
.These authors contributed equally to this work.
Introduction
Nav1.5, the cardiac isoform of the voltage-dependent sodium channelasubunit, is encoded by the human SCN5A gene which locates on chromosome 3p21 [1]. In the firing process of cardiac action potentials (APs), Nav1.5 channel carries a rapid inward Na+
current (INa) in response to a depolarization and then goes into ‘‘a fast inactivated state’’ with a small fraction of remnant currents throughout the whole process of depolarization. This persistent current termed as a late INaplays a critical role in the heart [2–4]. After that, inactivated channels recover from the process of repolarization and prepare for the next process of depolarization. The generalized morphology of myocardial APs in humans and other large mammalian species contains a rapid upstroke followed by a depolarized plateau potential lasting for more than 100 ms [5,6], whereas the AP in neurons usually consists of a rapid upstroke and an immediate repolarization [7]. With the prolonged depolarization, Nav1.5 channels progressively enter ‘‘a slow inactivated state’’, corresponding to a slow recovery process with the time constants ranging from hundreds of milliseconds to several seconds [8,9]. Slow inactivation substantially suppresses Na+currents to control the cell excitability. Mutants which cause
enhanced slow inactivation are often associated with several clinical heart diseases [10–13]. However, the gating mechanism of slow inactivation of Nav1.5 remains elusive.
Over the past 15 years, numerous mutations in SCN5A have been reported to be associated with various rare arrhythmia
syndromes, such as congenital Long QT syndrome type 3 (LQTS3), Brugada syndrome (BrS), progressive cardiac conduc-tion defect (PCCD), sick sinus syndrome (SSS) and arterial standstill [10–14]. To better understand the linkage between the gating of the Nav1.5 channels and heart diseases, we think that one feasible way is to use kinetic models. The dominant paradigm for modeling voltage-gated ion channel kinetics over the past 60 years has been dependent on the giant squid axons experiments of Hodgkin and Huxley [15]. Since then, the H-H models have been extensively used in data analysis of cellular electrophysiology. However, with the availability of high resolution data, many ion channels exhibit features beyond the traditional H-H models [16,17]. As a consequence, more complicated Markov models have been proposed for analyzing the ion-channel kinetics [18– 21]. Such models produce more precise description to the ion-channel kinetics, which can be ultimately used to understand the firing properties of APs in excitable cells.
In this study, we proposed a two-step inactivation Markov model for simulating the Nav1.5 currents including the slow inactivation and bi-exponential recovery.
This work provided a solid basis for studying the detailed gating mechanism and the electrophysiological role of sodium channel in excitable cells.
Materials and Methods
Cell culture and transfection
The full-length cDNAs for human Nav1.5 (SCN5A) was subcloned into pcDNA3.1 Zeo(+) (Clontech). The construct was verified by DNA sequencing. HEK293 cells were cultured in Dulbecco’s modified Eagle’s medium (DMEM) supplemented with 10% fetal bovine serum (FBS) and incubated at 37uC in 5% CO2. One day before transfection, cells were transferred to 24-well plates. At 90% confluence, cells were transiently transfected using Lipofectamine2000 (Invitrogen). Electrophysiological experiments were performed at 1–2 days after transfection.
Electrophysiology
The whole-cell mode was only used in all experiments. Patch pipettes were pulled from borosilicate glass capillaries with a resistance of 1.5–2.5 MV, after filled with pipette solution. The series resistances were compensated with 80%–90%. All the experiments were performed with a patch clamp amplifier (Axopatch 200B, Axon Instruments, Union City, Calif., USA) with its software (Clampex) at room temperature (23–25uC). The currents were typically digitized at 10–100 KHz and filtered at 5 kHz (Fig. S1). The pipettes solution contained (in mM): 140 CsCl, 10 NaCl, 10 HEPES, 1 EGTA, pH 7.4, adjusted with CsOH. The bath solution contained (in mM): 140 NaCl, 5 KCl, 2 CaCl2, 1 MgCl2, 10 HEPES, pH 7.4, adjusted with NaOH.
Data Analysis
Patch clamp recording data were analyzed with Clampfit (Axon Instruments, Inc.) and Sigmaplot (SPSS, Inc.) software. Unless otherwise stated, the data are presented as mean6S.D..
The conductance-voltage (G–V) curves for activation were fitted to the a Boltzmann equation as below,
G=Gmax~f1zexp½ðV{V50Þ=kg
{1 ð
1Þ
whereV50is the half maximal voltage,Gthe conductance,Gmax
the maximum conductance andkthe slope factor.
The steady-state inactivation was fitted to a Boltzmann equation as below,
I=Imax~f1zexp½ðV50{VÞ=kg
{1 ð
2Þ
whereV50is a half availability voltage, andkis the slope factor. Development of slow inactivation was fitted to a single exponential function as below,
y~azbexpðt=tÞ{1 ð3Þ
wheretis time constant,aandbare the partition coefficients. Recovery curves were fitted to the mono-exponentail or bi-exponential equations as below,
I=Imax~A1½1{expð{t=t1Þ ð4Þ
I=Imax~A1½1{expð{t=t1ÞzA2½1{expð{t=t2Þ ð5Þ
whereIis the peak current,Imaxthe maximal peak current,A1and
A2the proportional coefficients,tthe time,t1andt2the fast and slow recovery time constants, respectively.
Mathematical modeling and simulation
The differential equations for the kinetic modeling were solved numerically, using a QMatrix or Five-order Runge-Kutta integration method. The fitting procedure is bad on a PSO-GSS algorithm for direct estimation of rate constants from macroscopic currents [22]. The integrating routines were written and executed with software CeL (HUST, Wuhan, Hubei, China), compiled with the C++ compiler to run under Windows XP [23]. Kinetic parameters were optimized with CeL as previously described. [22]
Results
Models for Nav1.5 channels
To understand the gating mechanism of Nav1.5, the currents of activation, steady-state inactivation and deactivation are absolutely necessary to provide us the detailed information of rate constants required for a kinetic model. In this study, we are to provide a detailed description on the behavior of Nav1.5 currents arising from expression ofSCN5Aa-subunits in HEK293 cells, to present a kinetic model that appears to account for the observed currents of Nav1.5, and finally to construct a cardiac model cell with the built-in Nav1.5 channels to evaluate its physiological role in cardiac cells.
In models, the activation current depends on the forward (activation) rates from the closed (C) to the open (O) to the inactivated (I) states; the deactivation current depends on the backward (deactivation) rates from O to C; the steady-state inactivation current depends on the rates from O to I or C to I. Although currents rely on all the rates in model, each pathway is predominantly influenced by a certain combination of rates. Therefore, the model with all the rates can be finally determined from those currents [22].
Kinetic properties of Nav1.5 channels
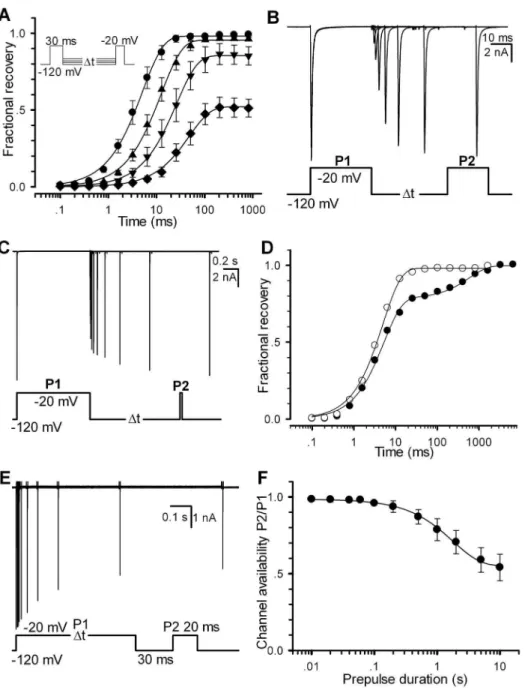
A set of the whole-cell experiments was thus performed on Nav1.5-transfected HEK293 cells for collecting the kinetics of activation (Fig. 1A), steady-state inactivation (Fig. 1B) and deactivation (Fig. 1C). In Fig. 1A, Nav1.5 currents exhibit a rapid activation and then a completed inactivation by a 20 ms depolarizing voltage steps ranging from290 to+60 mV in 5 mV increments after a holding potential of2120 mV to remove the possible inactivation. The activation and inactivation processes of Nav1.5 in Fig. 1A can be described by CRORI. Thus, the forward rates can be determined by fitting it to the activation currents. Deactivation currents were acquired by a 0.25 ms pulse to210 mV following a holding potential to2120 mV and ending with a 20 ms voltage steps from2100 to230 mV in 10 mV increments (Fig. 1C). Similarly, the backward rate of CrO can be determined by fitting it to deactivation currents. The voltage dependence of steady-state inactivation currents, standing for the availability of channels, was obtained by applying a set of conditioning voltages ranging from2120 to 0 mV for 500 ms in 10 mV increments and then measured at210 mV with a 20 ms test pulse as indicated in Fig. 1B. The backward rates of CrOrI can be determined by fitting them to the corresponding currents. The normalized G–V curve of Nav1.5 confers an averaged value of V50=234.561.5 mV (Fig. 1D). The V50for the steady-state inactivation (availability) of 500 ms is289.161.6 mV (Fig. 1E). These gating results are consistant with previous work for Nav1.5 [24]. Fig. 1F shows the time constants of activation (ta), deactivation (td) and inactivation (ti) of Nav1.5 channels.
Alternatively, the channel availability can be obtained by directly measuring the recoveries of Nav1.5. In this study, a two-pulse (pretwo-pulse P1 and test two-pulse P2) protocol was used for all of
recovery experiments. Here we define the fractional currents as a ratio of Ii(P2, V, ti)/I(P1,2120 mV). Here I is the current, P1 the prepulse duration, P2 the test pulse duration, V the recovery voltage and tithe ith time interval between P1 and P2. Fig. 2A displays a set of fractional recovery curves arising from a two-pulse protocol (P1 = 30 ms, P2 = 20 ms, V =2120,2110,2100 and290 mV). The recovery time constants are 5.160.9, 12.562.1, 26.163.8 and 47.963.4 ms for2120,2110,2100 and290 mV, respectively. A typical experiment exhibited a mono-exponential recovery (Fig. 2B). Especially, when ti=‘, a set of the fractional ratio Ii(P2, V, ti)/I(P1,2120 mV) will tend to their steady-state values, which can confer a steady-state inacti-vation curve. When P1 = 1000 ms, however, it shows a bi-exponential recovery (Fig. 2C), suggesting that a secondary (slow) inactivation state exists. Compared with the single-recovery curve (2120 mV), the double-recovery curve (2120 mV) is plotted in Fig. 2D. For P1 = 30 ms (empty circle), the recovery time constant is 5.0 ms; for P1 = 1000 ms (solid circle), the fast recovery time constant (tr-fast) is 5.2 ms (78%) and the slow one (tr-slow) is 596.3 ms (22%). To further explore the effect of P1 duration, a development of slow inactivation was executed. Cells were depolarized by a220 mV prepulse P1 with various durations to elicit inactivation, followed by a2120 mV interpulse with only a 30 ms duration, presumably to remove the recovery from fast inactivation (Fig. 2E). The remaining peak currents of the test pulse P2 measured at220 mV confers a time constant of 1.7960.11 s (Fig. 2F), suggesting that there is a slow inactivation component in Nav1.5 channels.
The kinetic model of Nav1.5 channels
To better understand the gating mechanism of Nav1.5, it is necessary to construct a Markov model for precisely matching all of the Na+ currents shown in this study. After that, we aim to
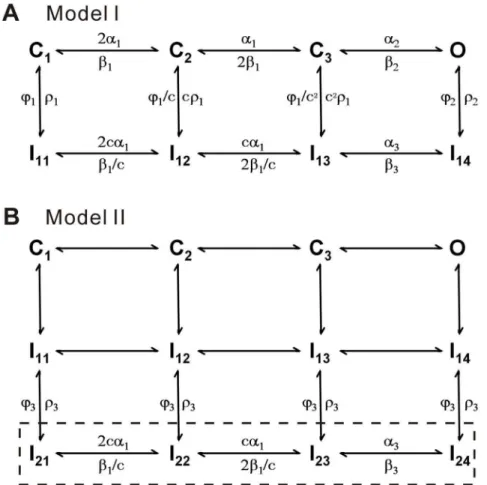
further explore the physiological role of Nav1.5 in cardiac cells. At first, a typical 12-state model, composed of five closed states, six inactivated states and one open state, was used as the Nav1.5 model [25], However we failed to get a good fit to the present data. Alternatively, we considered the formalized Nav model of m3h proposed by Hodgkin and Huxley [15], where m is an activation factor and h an inactivation factor. Actually, m3h has an open probability equal to that of an 8-state Markov kinetic model [21]. Mimicking the Hodgkin-Huxley (H-H) model, an 8-state model, composed of three closed (C1–C3) states, four inactivated (I11–I14) states and one open (O) state, was chosen to simulate the Nav1.5 currents (Fig. 3A, Model I). Differing from the previous models, all rates are voltage-dependent in this model. The reason for this change was to make model more flexible and obtain the highest score evaluated by the software CeL [22]. For slow inactivation, we constructed a new model (Model II) by adding the four slow inactivated states I21–I24to I11–I14in Model I as shown in the boxed region (Fig. 3B). In this model, we assume that the occupancies of I11–I14transits into I21–I24so slowly as to lead a slow inactivation. The parameter values of two models are listed in Table 1.
In Fig. 4A–C, the Model I replicates the activation, deactivation and steady-state inactivation of Nav1.5, indicating that it is capable to be a Nav1.5 model. The time constants of data and
Figure 1. The currents and kinetic characteristics of voltage-gated sodium (Nav1.5) channels expressed in HEK293.(A–C) The representative currents of Nav1.5 channels were produced with the voltage protocols placed at the bottom, respectively. (D and E) The G–V curve (D) and channel availability curve (E) were measured from (A) and (B), respectively. Normalized curves were fitted to the Eq. 1 and Eq. 2. For activation, V50=234.561.5 mV (P,0.001) andk= 7.260.6 (n = 14); for steady-state inactivation (availability), V50=289.161.6 mV andk= 5.560.4 (n = 11). Error bars represent S.D.. (F) Time constants are plotted as a function of membrane potentials. The time constants of activation (circle) and inactivation (triangle down) and deactivation (triangle up) were derived from mono-exponential fits to the data shown in (A and C).
simulation derived from Fig 4A–C are near overlapped (Fig. 4D– F). The V50of activation is234.5 mV for data and234.0 mV for simulation (Fig. 4G); the V50 of steady-state inactivation is289.1 mV and289.2 mV (Fig. 4H). Recovery for the short P1 of 30 ms could also be replicated by Model I (Fig. 4I, J). Time constants from2120 to290 mV are 5.1 and 5.6, 12.5 and 11.9, 26.1 and 26.6, 47.9 and 49.6 ms for data and simulation, respectively.
However, Model I failed to account for the slow recovery process. We realized that this insufficiency was related to the structural constraint of Model I. According to this 8-states model, it can not account for the bi-exponential recovery process, which
has the time constantstr-fast= 5.2 ms andtr-slow= 596.3 ms with a nearly 100 times difference (Fig. 2). Interestingly, the time constant (tr-fast) of fast component remains no change, compared with that of single recovery, suggesting that it is better to insert a secondary (slow) inactivation pathway to model I. The simplest way is obviously to directly add one more inactivated state Is(or Islow) to open state (O) [7,26]. Essentially, this Is is to share a certain amount of probability with the original If(or Ifast) state. It will slowly go and back between Isand O states as a slow component of recovery. Unfortunately, this modified model was incapable to account for the duration-dependent inactivation or bi-exponential recovery in our trials.
Figure 2. Recovery property of Nav1.5. (A) Fractional recovery from inactivation was performed with the voltage protocol in inset. Time constants of recovery are 5.160.9 (n = 9), 12.562.1 (n = 7), 26.163.8 (n = 6) and 47.963.4 (n = 6) ms at2120,2110,2100 and290 mV, respectively. (B– C) Traces were obtained from the same patch at2120 mV with P1 = 30 ms for (B) and P1 = 1000 ms for (C). (D) The fractional recovery curves are plotted for (B) and (C), respectively. The solid lines are fits to the mono-exponential Eq.4 (empty circle) for (B) and the bi-exponential Eq. 5 (solid circle) for (C). (E) The slow inactivation currents were evoked by the voltage protocol with the various P1 durations shown at the bottom. (F) Development of slow inactivation. The solid line is a fit to Eq. 3 with a time constantt= 1.7960.11 s (n = 7). For all of cases, P2 = 20 ms.
doi:10.1371/journal.pone.0064286.g002
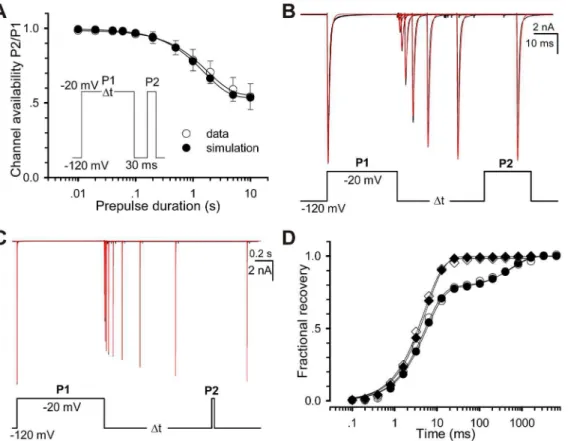
After trying several different models, we finally determined to use the 12-state two-step inactivation model named as Model II (Fig. 3B). Based on the structure of Model II, the slow inactivation of channels should undergo two steps during the depolarization process, for simplicity, first from O to I14 (fast) and then to I24 (slow). Upon repolarization, the fractional occupancy residing in the fast inactivation state I14 transfers quickly from I14 to C1 mainly via I13, I12and I11, while the fraction residing in the slow inactivation state I24transfers slowly from I24to C1mainly via I24, I23, I22, I21 and I11. Prolonging the duration of depolarization, more channels go to I24 from I14 and more channels have to recovery via a slow pathway. The rates between I1xand I2xare so small that Model II fitted nearly the same results to Model I in short-duration processes (Fig 4A, C–G, I–J). There is only a slight difference on fits, comparing the Model II with Model I (Fig 4B and H). However, Model II was also well-behaved in simulating the long P1 duration case. More kinetics of Model II is shown in Fig 5. The development curve of slow inactivation is shown in Fig 5A. Time constants are 1.79 s for data and 1.58 s for simulation. Moreover, all the fits (red) generated by the Model II in Fig. 5B–C are coincident with the recovery traces (black) shown previously in Fig 2B–C, suggesting that the Model II can also well replicate the whole processes including the slow recovery. For the short P1 of 30 ms, recovery time constants are 5.0 ms and 5.6 ms for data and simulation, respectively; for the long P1 of 1000 ms, are 5.2 ms (fast, 78%) and 596.3 ms (slow, 22%) for data, 5.6 ms (fast, 77%) and 557.2 ms (slow, 23%) for simulation (Fig. 5D).
Figure 3. Kinetic models of Nav1.5.(A) The 8-state Model I has three closed states (C1, C2, and C3), four inactivated states (I11–I14) and one open state (O). (B) Model II has four additional slow inactivated states (I21–I24) attached to Model I. The values of parameters in both the models are given in Table 1.
doi:10.1371/journal.pone.0064286.g003
Table 1.Best fit model parameters.
k n
a1 9.435 39.70
a2 441.1 6.593
a3 11.17 11.64
b1 0.000037 27.770
b2 0.2241 221.13
w1 0.000020 213.07
w2 0.000302 247.08
w3 0.000230 257.21
r2 1.823 92.78
r3 0.000315 965.2
g 0.01296
a 85.62
f 15.64
c 2.146
Each of rate constants has the expression x = k * expV/nexcept ther 1= g/ (1+exp(2(v+a)/f)) and the cyclic balancing ratesb3, calculated from microscopic reversibility of cycles. Here the rate x and the pre-exponential factors k and g are in ms21and the exponential factor n, a, f and voltage V (trans-membrane voltage) in mV21. The parameter c is non-dimensional.
Discussion
In this study, a novel 12-state two-step inactivation kinetic model was successfully developed to study the slow inactivation mechanism of Nav1.5 channels, especially to illustrate the mechanism of duration-dependent bi-exponential recovery based on a set of Nav1.5 currents recorded by patch-clamp experiments. The proposed model II (or two-step inactivation model) can be regarded as a hierarchical structure. Firstly, Model I well duplicated the activation, deactivation, steady-state (fast) inactiva-tion and fast recovery (Fig. 4). Three closed states in Model I correspond to the m3 Hodgkin-Huxley formalism, previously suggested by Markov models [18], and FRET experiments [27,28]. Especially, the latter suggested that only three major protein conformations were required for ion permeation to occur. Secondly, Model II well described all the Nav1.5 kinetics including
the slow inactivation and slow recovery, the mission impossible for Model I (Fig. 5).
The slow inactivation process in Model II can be briefly summarized as OrRI1rRI2, named as two-step inactivation model. Here I1 and I2are the fast and slow inactivation states, respectively. In contrast, Jarecki et al. used an alternative two-state inactivation model I2rROrRI1to investigate the resurgent -sodium currents [29]. We tested this model and found that it did not work well in explaining both the inactivation and the slow recovery at variety of voltages. Therefore, the two-step inactivation model should be more appropriate to our work.
HEK293 cell has endogenous voltage-gated Na channels such as Nav1.7 and voltage-gated Ca2+ channels [30]. But the endogenous currents of HKE293 in different labs were variable because of different generation, environment, or other factors. We used cesium instead of potassium in our pipette solution (see in Method) in order to block the endogenous potassium current of
Figure 4. Comparison of kinetic characteristics between data and simulations.Unless otherwise stated, simulation was derived from Model I. (A–C) Fitting the Model I to the data of activation (A), steady-state inactivation (B) and deactivation (C). Black traces represent data and red ones simulations. (D–F) Time constants for activation (D), fast inactivation (E) and deactivation (F) are plotted as a function of voltages. The empty and solid circles represent the data and simulations as indicated. (G) The V509s values of G–V curves of activation are 34.5 mV for data and234.0 mV for simulation. (H) The V509s values of steady-state inactivation are289.1 mV for data,289.2 mV for Model I and289.7 mV for Model II. (I) Fractional recoveries of Nav1.5 were acquired at2120,2110,2100 and290 mV with P1 = 30 ms and P2 = 20 ms. (J) Time constants of recovery of data and simulation are 5.1 and 5.6, 12.5 and 11.9, 26.1 and 26.6 and 47.9 and 49.6 ms at2120,2110,2100 and290 mV, respectively.
doi:10.1371/journal.pone.0064286.g004
HEK293. Secondly, we used 100 nM TTX as blockers (Fig. S2A). The change of Nav1.5 current was very small, which means there was no significant Nav1.7 current (TTX sensitive) in our HEK293 cells. Then we tested the currents of un-transfected cells. A large proportion of results revealed that there was no significant endogenous currents. Other proportion of results showed endog-enous inward current with amplitude of 20 to 40 pA (Fig. S2B), which was less than one percent of transfected Nav1.5 current described in our work.
It is important for this discussion to point out that sodium channel (including a and b subunit) functions are critically dependent on the particular heterologous expression system used [31]. Current data sometimes are conflicting, possibly due to differences in experimental conditions or, more importantly, species studied [32]. In Xenopus oocytes, for instance, injection of theasubunit cRNA shows an abnormally large component of a intermediate inactivation mode [33–35], which is substantially reduced by co-injection of cRNA encoding theb1 subunit [34]. In contrast, the alone expressedasubunit in HEK293 has shown a kinetic behaviour similar to that of the native preparations [36,37]. This is due to an abundant endogenous expression of mRNA encoding theb1A subunit in HEK293 [38]. The endogenousb1A subunit is sufficient for suppressing the intermediate inactivation of sodium currents by co-assembly witha-subunits [38]. Though the kinetics of our Nav1.5 model may have slight difference compared with other results obtained from variant tissues or species,
the mechanism of slow inactivation should be the similar. Our model can be also applicable to the data from other tissues or species with proper adjustment in parameters. As mentioned
previously, some mutations associated with heart diseases, e.g. BrS or PCCD, often occur from the enhanced slow inactivation of Nav1.5 [10,39–42], as it suppresses the Na+ current (loss of
function) to decrease the excitability of cardiac cells. In other words, a loss of Na+current prevents the membrane potential from
reaching the threshold of AP, thereby slowing conduction. Therefore, our work provides a useful tool to investigate the linkage between the slow inactivation of Nav1.5 and clinical heart diseases.
Considering that there is a high similarity in the Nav1.x family, we believe that the two-step inactivation model is applicable to the other sodium channels with their mutations, after making proper changes in parameters. All of quantitative analyses were made possible by recent advances in kinetic modeling algorithms and software (CeL) that allowed us to quickly construct and fit models with large amounts of states from the comprehensive data ranged from 5 ms to more than 10 s [22]. Therefore, this work provides a convenient platform for further investigating the detailed linkage between the sodium channels and diseases in the future.
Supporting Information
Figure S1 The kinetic comparison of Nav1.5 channel with diverse frequency of filtration.(A–C) Time constants for activation (A), fast inactivation (B) and deactivation (C) are plotted as a function of voltages. The diverse colors of circles represent the diverse frequency of filtration, red 2 KHz, green 10 KHz, blue 100 KHz and black 5 KHz, as indicated. Current
Figure 5. Comparison of Slow inactivation and recovery between the data and simulations.The empty and solid circles represent respectively the data and simulations. (A) Development of slow inactivation. The solid lines are fits to Eq. 3 with the time constants of 1.79 s (data) and 1.58 s (simulation). (B–C) Fitting the Model II to the data shown in Fig 2B–C. Black traces are data and red ones fits. (D) The curves of fractional recovery are plotted for data and simulations in (B) and (C). Square and circle are for P1 = 30 ms in (B) and P1 = 1000 ms in (C).
traces are shown in (D). Red traces represent 10 KHz and black ones represent 5 KHz.
(TIF)
Figure S2 The endogenous currents of HEK293 cell.(A) Nav1.5 current before and after addition of 100 nM TTX. (B) Endogenous inward current of un-transfected HEK293 cell. (TIF)
Author Contributions
Conceived and designed the experiments: Z. Zhang JD. Performed the experiments: Z. Zhang Z. Zhao WW. Analyzed the data: Z. Zhang YW JD. Contributed reagents/materials/analysis tools: YL. Wrote the paper: Z. Zhang JD.
References
1. Wang Q, Li Z, Shen J, Keating MT (1996) Genomic organization of the human SCN5A gene encoding the cardiac sodium channel. Genomics 34: 9–16. 2. Liu YM, DeFelice LJ, Mazzanti M (1992) Na channels that remain open
throughout the cardiac action potential plateau. Biophys J 63: 654–662. 3. Kiyosue T, Arita M (1989) Late sodium current and its contribution to action
potential configuration in guinea pig ventricular myocytes. Circ Res 64: 389– 397.
4. Zilberter Yu I, Starmer CF, Starobin J, Grant AO (1994) Late Na channels in cardiac cells: the physiological role of background Na channels. Biophys J 67: 153–160.
5. Doerr T, Denger R, Doerr A, Trautwein W (1990) Ionic currents contributing to the action potential in single ventricular myocytes of the guinea pig studied with action potential clamp. Pflugers Arch 416: 230–237.
6. Magyar J, Kiper CE, Dumaine R, Burgess DE, Banyasz T, et al. (2004) Divergent action potential morphologies reveal nonequilibrium properties of human cardiac Na channels. Cardiovasc Res 64: 477–487.
7. Milescu LS, Yamanishi T, Ptak K, Smith JC (2010) Kinetic properties and functional dynamics of sodium channels during repetitive spiking in a slow pacemaker neuron. J Neurosci 30: 12113–12127.
8. Rudy B (1978) Slow inactivation of the sodium conductance in squid giant axons. Pronase resistance. J Physiol 283: 1–21.
9. Cummins TR, Sigworth FJ (1996) Impaired slow inactivation in mutant sodium channels. Biophys J 71: 227–236.
10. Amin AS, Asghari-Roodsari A, Tan HL (2010) Cardiac sodium channelopa-thies. Pflugers Arch 460: 223–237.
11. Ruan Y, Liu N, Priori SG (2009) Sodium channel mutations and arrhythmias. Nat Rev Cardiol 6: 337–348.
12. Remme CA, Wilde AA, Bezzina CR (2008) Cardiac sodium channel overlap syndromes: different faces of SCN5A mutations. Trends Cardiovasc Med 18: 78–87.
13. Viswanathan PC, Balser JR (2004) Inherited sodium channelopathies: a continuum of channel dysfunction. Trends Cardiovasc Med 14: 28–35. 14. Wang Q, Shen J, Splawski I, Atkinson D, Li Z, et al. (1995) SCN5A mutations
associated with an inherited cardiac arrhythmia, long QT syndrome. Cell 80: 805–811.
15. Hodgkin AL, Huxley AF (1952) A quantitative description of membrane current and its application to conduction and excitation in nerve. J Physiol 117: 500– 544.
16. Armstrong CM, Bezanilla F (1977) Inactivation of the sodium channel. II. Gating current experiments. J Gen Physiol 70: 567–590.
17. Goldman L, Schauf CL (1972) Inactivation of the sodium current in Myxicola giant axons. Evidence for coupling to the activation process. J Gen Physiol 59: 659–675.
18. Patlak J (1991) Molecular kinetics of voltage-dependent Na+channels. Physiol Rev 71: 1047–1080.
19. Clancy CE, Kass RS (2004) Theoretical investigation of the neuronal Na+ channel SCN1A: abnormal gating and epilepsy. Biophys J 86: 2606–2614. 20. Armstrong CM (2006) Na channel inactivation from open and closed states.
Proc Natl Acad Sci USA 103: 17991–17996.
21. Milescu LS, Yamanishi T, Ptak K, Mogri MZ, Smith JC (2008) Real-time kinetic modeling of voltage-gated ion channels using dynamic clamp. Biophys J 95: 66–87.
22. Wang W, Xiao F, Zeng X, Yao J, Yuchi M, et al. (2012) Optimal estimation of ion-channel kinetics from macroscopic currents. PLoS One 7: e35208. 23. Sun L, Xiong Y, Zeng X, Wu Y, Pan N, et al. (2009) Differential regulation of
action potentials by inactivating and noninactivating BK channels in rat adrenal chromaffin cells. Biophys J 97: 1832–1842.
24. Watanabe H, Darbar D, Kaiser DW, Jiramongkolchai K, Chopra S, et al. (2009) Mutations in sodium channel beta1- and beta2-subunits associated with atrial fibrillation. Circ Arrhythm Electrophysiol 2: 268–275.
25. Kuo CC, Bean BP (1994) Na+ channels must deactivate to recover from inactivation. Neuron 12: 819–829.
26. Raman IM, Bean BP (2001) Inactivation and recovery of sodium currents in cerebellar Purkinje neurons: evidence for two mechanisms. Biophys J 80: 729– 737.
27. Chanda B, Asamoah OK, Bezanilla F (2004) Coupling interactions between voltage sensors of the sodium channel as revealed by site-specific measurements. J Gen Physiol 123: 217–230.
28. Chanda B, Bezanilla F (2002) Tracking voltage-dependent conformational changes in skeletal muscle sodium channel during activation. J Gen Physiol 120: 629–645.
29. Jarecki BW, Piekarz AD, Jackson JO, 2nd, Cummins TR, (2010) Human voltage-gated sodium channel mutations that cause inherited neuronal and muscle channelopathies increase resurgent sodium currents. J Clin Invest 120: 369–378.
30. He B, Soderlund DM (2010) Human embryonic kidney (HEK293) cells express endogenous voltage-gated sodium currents and Na v 1.7 sodium channels. Neurosci Lett 469: 268–272.
31. Isom LL (2001) Sodium channel beta subunits: anything but auxiliary. Neuroscientist 7: 42–54.
32. Rook MB, Evers MM, Vos MA, Bierhuizen MF (2012) Biology of cardiac sodium channel Nav1.5 expression. Cardiovasc Res 93: 12–23.
33. Kambouris NG, Hastings LA, Stepanovic S, Marban E, Tomaselli GF, et al. (1998) Mechanistic link between lidocaine block and inactivation probed by outer pore mutations in the ratm1 skeletal muscle sodium channel. J Physiol 512 ( Pt3): 693–705.
34. Zhou JY, Potts JF, Trimmer JS, Agnew WS, Sigworth FJ (1991) Multiple gating modes and the effect of modulating factors on them1 sodium channel. Neuron 7: 775–785.
35. Moorman JR, Kirsch GE, VanDongen AM, Joho RH, Brown AM (1990) Fast and slow gating of sodium channels encoded by a single mRNA. Neuron 4: 243– 252.
36. Ukomadu C, Zhou J, Sigworth FJ, Agnew WS (1992) m1 Na+ channels expressed transiently in human embryonic kidney cells: biochemical and biophysical properties. Neuron 8: 663–676.
37. Sheets MF, Hanck DA (1999) Gating of skeletal and cardiac muscle sodium channels in mammalian cells. J Physiol 514 ( Pt2): 425–436.
38. Moran O, Nizzari M, Conti F (2000) Endogenous expression of the beta1A sodium channel subunit in HEK-293 cells. FEBS Lett 473: 132–134. 39. Wang DW, Viswanathan PC, Balser JR, George AL, Jr, Benson DW (2002)
Clinical, genetic, and biophysical characterization of SCN5A mutations associated with atrioventricular conduction block. Circulation 105: 341–346. 40. Veldkamp MW, Viswanathan PC, Bezzina C, Baartscheer A, Wilde AA, et al.
(2000) Two distinct congenital arrhythmias evoked by a multidysfunctional Na(+) channel. Circ Res 86: E91–97.
41. Wang DW, Makita N, Kitabatake A, Balser JR, George AL, Jr (2000) Enhanced Na(+) channel intermediate inactivation in Brugada syndrome. Circ Res 87: E37–43.
42. Tan HL, Bink-Boelkens MT, Bezzina CR, Viswanathan PC, Beaufort-Krol GC, et al. (2001) A sodium-channel mutation causes isolated cardiac conduction disease. Nature 409: 1043–1047