Microwave-Mediated Green Synthesis of Silver Nanoparticles
Using
Ficus Elastica
Leaf Extract and Application in Air
Pollution Controlling Studies
N. Gandhi, D. Sirisha* and Vikas Chandra Sharma
Center for Environment and Climate Change, Jawaharlal Nehru Institute of Advanced Studies (JNIAS), Hyderabad, A.P
ABSTRACT
Silver Nanoparticles are applied in various fields due to its anti bacterial properties. A conventional method for synthesis of AgNP requires dangerous chemical and large amount of energy is released in the process. Environmental friendly techniques are adopted for the synthesis of nanoparticles of silver. The present research work summarizes the green synthesis of silver nanoparticles by using leaf extract of Ficus Elastica and alternative energy sources micro wave irradiation. The synthesized Nanoparticles are characterized by uv- visible spectroscopy and by SEM. The synthesized nanoparticles are applied for controlling SO2 and NO2 from
aqueous solution of SO2 and NO2. Batch adsorption studies are carried out. The effect of the temperature on
adsorption of aqueous solution is studied at different temperature. A comparison of kinetic models applied to the adsorption of on silver Nanoparticles was evaluated for the pseudo first order, pseudo second order, Elovich and intraparticle diffusion models respectively. Results show that pseudo second order model was found to correlate the experimental data. Data fitted perfectly into and Freundlich adsorption isotherms.
Key words:
Batch adsorption, green synthesis, silver Nanoparticles, adsorption kinetics, adsorption isotherms.I.
Introduction
“Pollution” is the unwanted alteration in
environmental parameters by means of mixing of certain objects, called as pollutants. Among all the kinds of pollution, air pollution is one, and has the deploying impacts over humans and atmosphere. There are several techniques available to control air pollution but application of nanotechnology in environmental pollution control even in initial stage only. Nanotechnology is one of the modern and sophisticated technologies which create waves in the modern times. The opportunities for novel application continuous to grow as more and more knowledge are obtained about the Nanoparticles of Ag. The promise of these developments appears to be able to enhance the quality of life through novel applications of nonmaterials. The ability to produce efficiently and light weight of significant interest of research. Taking that factor into consideration, the present study and application of air pollutant dissolved in aqueous solution.
There are so many ways to synthesize nanoparticles, but greater emphasis is given on
“Biobased microwave synthesis”. In present study, the AgNPs were synthesized by using leaf extract of
Ficus elastica with reference of previously done studies such as by using leaf extract of Acalypha indica [1], Helianthus annus [2], Pine [3], Moringa oleifera [4], Camellia sinensis [5], Trianthema
decandra [6]. The physical characterization of synthesized AgNPs was done by scanning electron microscope (SEM) and UV- Vis, Spectrophotometer.
The present study deals with the removal of NO2 & SO2 from atmosphere. The reason behind
selection of these gases is their carcinogenic trait. These gases are found to cause cancer especially breast cancer [7], lungs cancer & cardiac disorders [8], mainly in the industrial surrounding localities.
II.
Materials and Methods
Preparation of Adsorbent (Ag Nanoparticles) Source of AgNO3
Chemicals used in the present study all are including silver nitrate are analytical grade and used as it is. There is no further purification procedures are followed.
Preparation of Leaf Extract:
The fresh leaves of Ficus elastica were collected from vikarabad forest, located 40 km away from Hyderabad. The leaves were washed with tap water as well as distilled water to remove dust particles which present on the surface of leaves. Then leaves were allowed for dry for 20 minutes then weighed 25 grams of leaves and grinded it by using laboratory mortar and pestle. The leaf extract collected in a 25 ml standard flask and kept in refrigerator for further use.
Preparation of Silver Nanoparticles:
Many techniques, including chemical and physical means, have been to prepare metal nanoparticles, such as chemical reduction using a reducing agent, electrochemical reduction, photo chemical reduction and heat evaporation method. Not only physicists and chemists, but also the biologists are highly interested in synthesizing nanoparticles of different shapes and sized by employing bio-based synthesis of nanometals using plant leaf extracts. In the present study to the 25 ml leaf extract 100 ml of 0.1 M AgNO3 solution was added and kept it in
microwave oven at 180 watts for 30 minutes. Formations of silver nanoparticles were checked by using UV-vis spectrophotometer (Lambda Scientific Spectrophotometer) at regular intervals. This naturally occurring nanoparticles are generated by the erosion and chemical degradation of plants [9].
Characterization of Silver Nanoparticles:
The characterization technique involves UV-vis absorption spectra, Scanning Electron Microscope (SEM), Fourier transform infrared spectroscopy (FT-IR).
Preparation of Standard Samples:
A 100 ppm stock solution of Sulphite prepared by dissolving 0.1575 gm of Analytical grade Sodium sulphite in double distilled water and made up to 1000 ml with double distilled water. A 100 ppm stock solution of nitrite prepared by dissolving 177 mg of Analytical grade sodium nitrite in 1000 ml standard flask and made up to the mark with double distilled water. From the stock solution of Sulphite and Nitrite the working standards are prepared by taking appropriate quantities to get the desire concentration of SO2 and NO2. The working
standards are treated with silver nanoparticles and checked for percentage removal by using Uv-Vis Spectrophotometer. Batch Adsorption Studies are carried out for the removal of SO2 and NO2. The
percentage removal of SO2 and NO2 is calculated by
using the following formula.
% Removal = Initial Concentration – Final Concentration X 100
Initial Concentration
Experimental Procedure:
In the present study an attempt has been made to suggest a new method application on green synthesized silver nanoparticles in air pollution controlling technologies. Batch adsorption experiments were adopted for the removal studies. The estimation of SO2 is done by west geak method
and NO2 estimation by NEDA method. The
experiments are conducted with respect to contact
time, effect of SO2 concentrations, silver
nanoparticles dosage and temperature effect.
Effect of Contact time and Kinetic models: Contact time plays an important role in designing the system [10]. The initial (before batch adsorption) and final (after batch adsorption) concentrations of SO2 and NO2 are determined at
regular time intervals i.e. 5, 10, 15, 20, 30, 40, 45, 50 and 60 minutes. In order to investigate the mechanism of adsorption several kinetic models were tested including pseudo first order kinetic model, the Elovich model and pseudo second order kinetic model for batch adsorption studies [11].
Effect of Initial concentrations of SO2 on Silver
nanoparticles:
Different concentrations of aqueous solutions of SO2 were studied with a constant amount
of adsorbent (silver nanoparticles) and constant contact time. The initial and final concentrations of SO2 were determined by spectrophotometer. The
results are given in figure-12.
Effect of Adsorbent Dosage:
To a series of constant concentrations of SO2 solutions, different amount of adsorbent were
added and allowed it for batch adsorption for 60 minutes to get equilibrium. After batch adsorption samples were tested for percentage removal by using spectrophotometer.
Effect of Temperature
To study the effect of temperature, the experiments are conducted at following temperature 0, 20, 40, 60, 80 and 100 O C.
Initial screenings have been done by taking both SO2
and NO2 separately. Finally it was observed that
decrease in SO2 concentration but there is no change
in NO2 concentration. It means silver nanoparticles
do not have the capacity to remove aqueous NO2
solution. So effects of contact time, concentration and adsorbent dosage have done by taking only with SO2
solution.
III.
Results and Discussion
UV- Visible Analysis of Silver Nanoparticles The distinctive colors of colloidal silver are due to a phenomenon known as Plasmon absorbance. Incident light creates oscillation in conduction electrons on the surface of the nanoparticles and electromagnetic radiation is absorbed. The spectrum of clear brownish green colloidal silver from the synthesis. The Plasmon resonance produces a peak near 400 nm. It is already been reported that the absorption spectrum of aqueous AgNO3 only solution
nanoparticles λ max at about 430 nm [2]. The wavelength of the Plasmon absorption maximum in a given solvent can be used to indicate particle size. If
the λ max in between 395 nm- 405 nm then the size of the particle is in between 10-14 nm, if the λ max 420 nm then the particle size is in between 35-50 nm
and the λ max 438-440 indicates that the formed nanoparticles are around 60-80 nm in size.
Thus, color change of the solution clearly indicated the formation of AgNPs. The color intensity of the cell filtrate with AgNO3 was
sustained even after 24 h incubation, which indicated
that the particles were well dispersed in the solution, and there was no obvious aggregation .All these reactions were monitored by ultraviolet-visible spectroscopy of the colloidal AgNPs solutions. The ultraviolet-visible spectra of the cell filtrate with AgNO3 showed a strong broad peak at 430 nm which
is surface Plasmon resonances (SPR band), which indicated the presence of AgNPs (Figure). These results were consistent with the reports of Verma et al 2010 [12]. The intensity of the SPR band steadily increased from 15 min to 25 min as a function of time of reaction.
Figure-1: Graphical form of absorbances for synthesis of AgNPs by using Ficus elastica leaf extract
Figure-2: Graphical form of Relationship between max and time of introduction 0
50 100 150 200 250 300 350 400 450 500
0 5 10 15 20 25 30
O.D
Figure-3: Change in colour of Ficus elastica leaf extract during nanoparticle synthesis
From the figure-3 and graph it was concluded that the formed particles are silver nanoparticles with the size around 50-60 nm. The application of AgNPs was highly dependent on the chemical composition, shape, size, and monodispersity of particles [13] to broaden the application scope; the AgNPs obtained were systematically characterized using SEM and FT-IR analysis. Through the SEM analysis, the particles were spherical and polydisperse with an average size of 50 nm, and the majority of the particles were less than 50 nm.
Particle Size Measurement using SEM
Silver nanoparticles that produced the spectrum were examined using Scanning Electron Microscopy. A sample of silver nanoparticles from freshly prepared clear brownish green solution was centrifuged at 8000 rpm for 5 minutes and redispersed in distilled water. This procedure was repeated three times and the remnant pellets were dried and powdered for SEM analysis. A thin film of the sample was prepared by dissolving a portion of the powdered particle in sterile distilled water on small glass cover slip and set on a copper stab for electron microscopy. The results are given in figure-4.
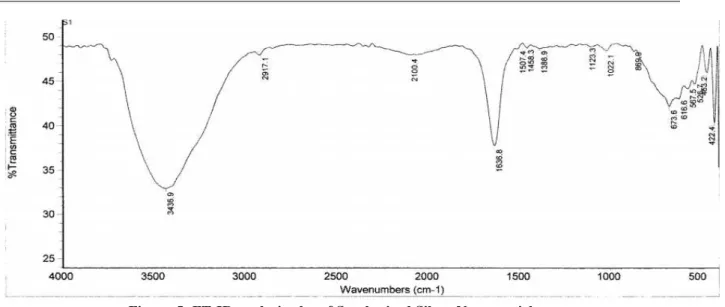
Figure-5: FT-IR analysis plot of Synthesized Silver Nanoparticles:
FTIR studies are carried for identifying the bio molecules responsible for capping and reducing AgNPs from the extract. The peaks at 3436.9 and 2917.1 were due to the stretching of primary and secondary amides respectively [14]. The peaks at these two regions are characteristic of proteins that
are responsible for the reduction of metal ions when using leaf extract. The peaks arise due to carbonyl stretch and N-H stretch in vibrations in the amide linkage of the proteins. The study confirms amino groups and peptide bonds of proteins form a capping agent and maintaining the stability [15-17].
3.1 Effect of Contact time and Kinetic studies
Fig- 6: Variation of contact time on SO2 removal
From the figure-6, it was observed that the percentage removal of aqueous SO2 is increasing
with increase in contact time and it became constant at optimum contact time [18]. The experiment was performed taking three different concentration of SO2
solution and checked for contact time effect and it is showing same results for all three different concentrations. The initial rapid adsorption showed a very slow approach to equilibrium. The nature of adsorbent and its available sorption sites affected the
time needed to reach equilibrium [19], for silver nanoparticles this time was 5 minutes.
Kinetic Studies
In order to check the kinetic parameters of removal of SO2 using silver nanoparticles, the
experimental data were tested with pseudo first order kinetic model, pseudo second order kinetic model and Elovich kinetic model. This adsorption kinetics is used to investigate the mechanism and the rate controlling steps of adsorption. The mechanism of adsorption involves the chemical reaction of functional groups present on the surface of the adsorbent and the adsorbate, temperature [20].
Pseudo first order kinetic model
This model explains that the rate of change of solute uptake with time is directly proportional to C o n t a n c t t i m e ( i n m i n )
%
R
e
m
o
v
a
l
0 5 1 0 1 5 2 0 2 5 3 0 3 5 4 0 4 5 5 0 5 5 6 0 8 5
9 0 9 5 1 0 0 1 0 5
difference in saturation concentration and the amount of solid uptake with time [21]. The plot of log (qe –
qt) versus t should give a straight line with slope of –
k/2.303 and intercept log qe. Where qe and qt are the
amount of SO2 adsorbed at equilibrium and at contact
time t. From the slope and intercept of the plot the
adsorption rate constant and equilibrium adsorption capacity were calculated [20]. From the graph (Figure- 7) and statistical report (Table-1) it was observed the present study removal of SO2 by silver
nanoparticles is following pseudo first order kinetic model.
C o n t a c t t i m e ( i n m i n )
lo
g
(
qe
-q
t
) 5 1 0 1 5 2 0 2 5 3 0 3 5 4 0 4 5 5 0
- 1 . 5 - 1 . 0 - 0 . 5 0 . 0 0 . 5
5 p p m
1 0 p p m
1 5 p p m
Figure- 7: Graphical representation of Pseudo first order kinetic model
Pseudo Second order kinetic model
The pseudo second order kinetic order equation expressed as
t/qt = 1 + t/qe
k2qe2
Where k2 is the rate constant of pseudo second order
adsorption (g/mg min) and qe is the equilibrium
adsorption capacity (mg/gm) [22]. Figure-8 shows the pseudo second order plot for the adsorption of SO2 using silver nanoparticles at different initial
concentration at room temperature.
When the pseudo second order kinetic is applicable, the plot of t/qt against t should give a linear
relationship from which k2 and qe determined
respectively from the intercept and slope of the plot. The figure showing the plot of pseudo second order kinetic model with linear relation. The r2 values are higher than the values of pseudo first order kinetic model. It is observed form the figure that the adsorption of SO2 by silver nanoparticles perfectly
fits to the pseudo second order kinetic model.
C o n t a c t t i m e ( i n m i n )
t/
qt
1 0 2 0 3 0 4 0 5 0 6 0
0 5 1 0 1 5
5 p p m 1 0 p p m 1 5 p p m
Figure- 8: Graphical representation of Pseudo second order kinetic model
Elovich Model
The Elovich model equation is generally expressed as [23-24]
dqt/dt = α exp (-β qt)
Where:
α is the initial adsorption rate (mg·g-1·min-1)
β is the desorption constant (g·mg-1
) during any one experiment.
If the adsorption of aqueous SO2 solution by
silver nanoparticles fits to the Elovich model, a plot of qt versus In(t) should give a linear relationship
with a slope of (1/β) and an intercept of 1/β In (αβ). The results of Elovich plot for the adsorption of SO2
and figure-9 it was observed that the Elovich model does not fit for the adsorption of SO2 by silver
nanoparticles. The Elovich model mainly applicable for chemical adsorption kinetics [25].
l n t
qt
0 1 2 3 4 5
0 5 1 0 1 5 2 0
5 p p m
1 0 p p m 1 5 p p m
Figure- 9: Graphical representation of Elovich kinetic model
Intra particle diffusion model analysis
The adsorption of aqueous SO2 solution by
silver nanoparticles fits into pseudo second order kinetic model. To find out the adsorption mechanism the data is tested with intra particle diffusion model. Adsorption is a multi step process involving transport of the solute molecules from the aqueous phase to the surface of the solid particulates followed by diffusion into the interior of the pores [20]. Assuming that the rate is controlled by pore and intra particle diffusion, the amount adsorbed (qt) is proportional to the t1/2, as
shown below
qt = kidt1/2 + I
where qt is the amount of SO2 adsorbed (mg/g) at
time t (min), and I is the intercept (mg/g). kid and I
values are obtained from the slopes and intercept of the linear plot. Figure-10 represents the plots of qt
versus t1/2 for adsorption of SO2 by silver
nanoparticles at various initial SO2 concentrations.
From the figure and table it was observed that the adsorption mechanism is not fits to intra particle diffusion model.
0 2 4 6 8 1 0
0 5 1 0 1 5 2 0
( t )1 / 2 qt
5 p p m 1 0 p p m 1 5 p p m
Figure-10: Intraparticle diffusion plots for the removal SO2 by silver nanoparticles.
3.2 Effect of Initial Concentration of SO2 on
AgNps
The Adsorptive removal of SO2 from
aqueous solution is purely depends on the concentration SO2 and available binding sites of
adsorbent and its nature. If the concentration of SO2
is increased the percentage of removal might be
increase or decrease. In present study (Figure-11) the percentage removal of aqueous SO2 solution is
decreases with increase in initial concentration of SO2 solution [26]. However at higher concentration
C o n c e n t r a t i o n i n p p m
%
r
e
m
o
v
a
l
0 2 0 4 0 6 0
4 0 6 0 8 0 1 0 0 1 2 0
% r e m o v a l w ith 0 .1 g m A g N P s % r e m o v a l w ith 0 .2 g m A g N P s
Figure-11: Effect of initial SO2 concentration on adsorption process
3.3 Effect of Adsorbent Dosage
Figure- shows the effect of adsorbent dosage on the percentage adsorption. From the figure it was observed that the percentage removal of aqueous SO2
is increasing with increase adsorbent dosage and it became constant at optimum adsorbent dosage of 0.3
gm/ 100 ml of 10 ppm concentrated solution. The reason behind this study the initial concentration of SO2 is constant and the amount of silver
nanoparticles are varies so the availability of binding sites are more.
C o n c e n t r a t i o n i n p p m
%
R
em
o
va
l
0 . 0 0 . 2 0 . 4 0 . 6
7 0 8 0 9 0 1 0 0
Figure-12: Effect of adsorbent dosage on SO2 removal
3.4 Effect of Temperature
Temperature has an important effect on the process of adsorption. The percentage of SO2
adsorption is studied as a function of temperature. The results obtained are presented in figure-13 at temperatures of 0oC, 40oC, 60oC, 80oC and 100oC.
0 2 0 4 0 6 0 8 0 1 0 0 9 0
9 5 1 0 0 1 0 5
T e m p e r a t u r e (C )
%
R
e
m
o
v
a
l
1 p p m
2 p p m
3 p p m
4 p p m
5 p p m
Figure- 13: Effect of Temperature on Adsorption of SO2
3.5 Adsorption isotherms
3.5.1 Langmuir adsorption isotherm The Langmuir adsorption isotherm is the best known linear model to determine the adsorption parameters. Langmuir model represented by following equation
qe = KL Ce = Q0bCe
1+ bLCe 1+ bLCe
The linearized form of Langmuir adsorption isotherm is as follows
Ce = 1 + (1/Q0) Ce
Q0bL
Where qe is the amount adsorbed at equilibrium
(mg/g), Q0 is the monolayer adsorption capacity
(9mg/g), Ce the equilibrium concentration of
adsorbate (mg/L) and bL is the Langmuir constant
related to energy adsorption. The figure-14 shows the plot of Ce/qe against Ce. Values of Q0 and bL are in
table-2. From the figure-14 and table-2 it was observed that the adsorption isotherm studies of removal of SO2 by silver nanoparticles does not fit
for the Langmuir isotherm.
0 2 4 6
0 . 9 0 0 . 9 5 1 . 0 0 1 . 0 5 1 . 1 0
C e
C
e
/q
e
0C
4 0C
6 0C
8 0C
Figure-14: Langmuir adsorption plot for SO2 removal at different temperature
3.5.2 Freundlich adsorption isotherm The Freundlich equation is an empirical relationship describing the adsorption of solute from liquid to a solid surface. The Freundlich equation is expressed as
qe = kf Ce1/n
The linear form of Freundlich equation is as follows Log qe = log kf + 1/n (log Ce)
Where kf is the Freundlich adsorption capacity and n
is the adsorption intensity. A plot of log qe versus log
Ce gives a linear line with slope of 1/n and intercept
of log kf given in table-2. From the figure-15 and
table-2 it was observed that the adsorption of aqueous SO2 at different temperature perfectly fits in to
0 . 0 0 . 2 0 . 4 0 . 6 0 . 8 0 . 0
0 . 2 0 . 4 0 . 6 0 . 8
l o g C e
lo
g
qe
0C
4 0C
6 0C
8 0C
Figure-15: Freundlich adsorption isotherm plots of SO2 removal at different temperature
3.5.3 Temkin adsorption isotherm
0 2 4 6
0 2 4 6
x / m
C
e
0C
4 0C
6 0C
8 0C
Figure-16: Temkin adsorption isotherm plots of SO2 removal at different temperature.
Temkin adsorption isotherm is studied by takes into account he interactions between adsorbents and metal ions to be adsorbed and is based on the assumption that the free energy of sorption is a function of the surface coverage [28]. The linear form of the Temkin isotherm is represented as:
qe = B ln A + B ln Ce
Where Ce is the equilibrium concentration of the
adsorbate in mg/L, qe is the amount of adsorbate
adsorbed at equilibrium (mg/g), RT/bT= B where T is
the temperature (K) and R is the ideal gas constant (8.314 J mol-1K-1) and A and bT are constants.
Figure-16 showing relation between Ce and qe, from the
figure-16 and table-2 it was observed that the adsorption of SO2 by silver nanoparticles is following
Temkin adsorption isotherms.
Table-1: Kinetic parameters for adsorption of Aqueous SO2 by Silver Nanoparticles
S.No Parameters SO2concentration
(5 ppm/L)
SO2 concentration
(10 ppm/L)
SO2 concentration
(15 ppm/L)
Pseudo first order kinetic model
01 R2 0.999 0.999 0.8751
ASS 0.0 0.0 0.1062
K1 0.0625 0.0835 0.1054
Pseudo Second order kinetic model
02 R2 0.999 0.999 0.999
ASS 0.0505 0.0389 0.0167
K2 3.8196 X 10⁻³ 10.2208 X 10⁻³ 5.4111 X 10⁻³
Elovich model
03 R2 0.6788 0.6921 0.7867
ASS 0.01285 0.1484 0.3015
α 3.067 X 10⁻⁶ 4.2026 X 10⁻⁶ 2.3743 X 10⁻⁶
Intraparticle diffusion model
04 R2 0.4286 0.4409 0.5370
ASS 0.02285 0.2695 0.6546
kid 0.03969 0.1363 0.2124
I 0.008685 0.02982 0.04648
Table-2: Isotherm kinetics for adsorption of Aqueous SO2 by Silver Nanoparticles
S.No Parameters Temperature oC
0 40 60 80 100
Temkin Adsorption Isotherm
01 R2 0.999 0.999 0.999 0.999 0.999
ASS 0.0240 0.0240 0.0240 0.0240 0.0240
aT 0.003618 0.003618 0.003618 0.003618 0.003618
bT 0.001093 0.001093 0.001093 0.001093 0.001093
Langmuir Adsorption Isotherm
02 R2 0.05357 0.05357 0.05357 0.05357 0.05357
ASS 0.01071 0.01071 0.01071 0.01071 0.01071
Q0 0.002415 0.002415 0.002415 0.002415 0.002415
bL 0.0007280 0.0007280 0.0007280 0.0007280 0.0007280
Freundlich Adsorption Isotherm
03 R2 0.999 0.999 0.999 0.999 0.999
ASS 0.0147 0.0147 0.0147 0.0147 0.0147
kf 0.001236 0.001236 0.001236 0.001236 0.001236
n 0.002558 0.002558 0.002558 0.002558 0.002558
IV.
Conclusion
In this study, silver nanoparticles are synthesized by Ficus Elastica using the alternative energy source of microwave irradiation. The AgNPs are highly stable AgNPs synthesized in the present study are capable of adsorbing SO2 molecules from
aqueous solution and these AgNPs are inefficient in adsorbing NO2. The formation of silver nanoparticles
is confirmed by SEM and spectrophotometrically. Investigation carried out on adsorption studies revealed that it is following Pseudo second order kinetics. Optimum dosage for 98% removal of SO2 is
equal to ecofriendly nontoxic energy saving method is employed in the synthesis of nanoparticles. The present study gives a new direction for developing a catalytic tube for controlling air pollutant SO2 caused
by petrol-drove vehicles.
V.
Acknowledgement
The authors are sincerely thankful to Mrs. Sujatha Gangadhar, registrar JNIAS for her constant encouragement and for financial support for completing this project.
REFERENCES
[1] C. Krishnaraj, E. G. Jagan, S. Rajasekar, P. Selvakumar P. T. Kalaichelvan, and N. Mohan, “Synthesis of silver nanoparticles using Acalypha indica leaf extracts and its antibacterial activity against water borne pathogens”. ELSEVIER International
journal Colloids and Surfaces B:
Biointerfaces. Vol.76, pp. 50–56, 2010. [2] A. Leela, and V. Munusamy, “Tapping the
unexploited plant resources for the synthesis of silver nanoparticles”. African Journal of Biotechnology Vol. 7, no. 17, pp.3162-3165, 2008.
[3] J. Y. Song, and S. K. Beom, “Rapid biological synthesis of silver nanoparticles using plant leaf extracts”. Bioprocess and Biosystems Engineering, Vol.32, no.1, pp.79-84, 2009.
[4] M. Shivashankar, and G. Sisodia,
“Biosynthesis of silver nanoparticles obtained from plant extracts of Moringa oleifera”. International journal of Life sciences Biotechnology and Pharma research Vol. 1, no. 3, pp.65-70, 2012. [5] Y. Y. Loo, B. W. Chieng, M. Nishibuchi,
and S. Radu, “Synthesis of silver nanoparticles by using tea leaf extract from
Camellia sinensis”. Dovepress International Journal of Nanomedicine, Vol. 6, no. 2, pp. 2-17, 2012.
[6] R. Geethalakshmi, and D.V.L. Sarada, Synthesis of plant-mediated silver nanoparticles using Trianthema decandra
extract and evaluation of their anti microbial activities”. International Journal of Engineering Science and Technology. Vol. 2, no. 5, pp.970-975, 2010.
Perspective,
http://www.sciencedaily.com/releases/2010/ 10/101006104003.htm).
[8] B.P. Nelson, Heart Disease and Lung
Cancer from Air. Suite 101 Magazine, 2009. ( http://www.prlog.org/10281223-the-heart- disease-lung-cancer-risks-from-nitrogen-dioxide-no2-air-pollution.html).
[9] M. Amal Kumar, M. Sanjukta, S. Samanta, and S. Mallick, “Synthesis of Ecofriendly Silver Nanoparticles from plant latex used as an important taxonomic tool for Phylogenetic interrelationship”. Advances in Bioresearch Vol. 2, no.1, pp.122-133, 2011. [10] S. R. Arthisree, D. Sirisha, and N. Gandhi,
“Adsorption of aqueous solution of NO2 by
neem bark dust”. International Journal of Chem Tech Research, Vol. 5, no.1, pp. 450-455, 2013.
[11] N. Gandhi, D. Sirisha, K. B. Chandra Shekar, and Smita Asthana, “Removal of Fluoride from water and waste water by using low cost adsorbents”. International Journal of Chem Tech Research. Vol. 4, no. 4, pp.1646-1653, 2012.
[12] V. C. Verma, R. N. Kharwar, and A. C. Gange, “Biosynthesis of antimicrobial silver nanoparticles by the endophytic fungus Aspergillus clavatus”. Nanomedicine Vol. 5, pp.33–40, 2010.
[13] H. Lin, “Nicotinamide adenine dinucleotide: Beyond a redox coenzyme. Organic and Bimolecular Chemistry. Vol.5, pp.2541– 2554, 2007.
[14] R. A. Meyers, Interpretation of Infrared Spectra, A Practical Approach, pp.10815– 10837. 2000.
[15] Mujeeb Khan., Merajuddin Khan., Syed Farooq Adil., Muhammad Nawaz Tahir., Wolfgang Tremel., Hamad Z Alkhathlan., Abdulrahman Al-Warthan., and Mohammed Rafiq H Siddiqui, “Green synthesis of silver nanoparticles mediated by Pulicaria glutinosa extract”. International Journal of Nanomedicine. Vol. 8, pp.1507–1516, 2013. [16] M. H. Mostafa, Khalil, H. Eman Ismail, Z.
Khaled El-Baghdady, and Doaa Mohamed.,
“Green synthesis of silver nanoparticles using olive leaf extract and its antibacterial activity”. Arabian Journal of Chemistry,
2013. DOI: 10.1016/j.arabjc.2013.04.007 [17] M. Ibrahim, El-Sherbiny, Ehab Salih, Fikry
M. Reicha, “Green synthesis of densely dispersed and stable silver nanoparticles using myrrh extract and evaluation of their antibacterial activity”. Journal of
Nanostructure in Chemistry, Vol. 3, no. 8, 2013.
[18] D. Sirisha, K. Mukkanti, and N. Gandhi,
“Adsorption of SO2 by Marble Chips.
International Journal of Chemical Sciences
Vol. 10, no.2, pp. 847-854, 2012.
[19] V. M. Priyanka, D. Sirisha and N. Gandhi,
“Sulphur dioxide adsorption Macrotyloma uniflorum (L) seed powder”. Proceedings of the international Academy of Ecology and Environmental Sciences, Vol.2, no. 4, pp.251-254, 2012.
[20] J. Raffiea Baseri, P. N. Palanisamy, and P. Siva kumar, “Adsorption of basic dyes from synthetic textile effluent by activated carbon prepared from Thevetia peruviana”. Indian Journal of Chemical Technology, Vol.19, pp.311-321, 2012.
[21] S. Lagergren, Kung Sven Veten Hand, 24, 1. 1898.
[22] A. Nevine Kamal, “Removal of reactive dye from aqueous solutions by adsorption onto activated carbons prepared from sugarcane bagasse pith”. Water treatment solutions desalination Vol. 223, pp. 152-161, 2008. [23] S. H. Chien, and W. R. Clayton,
“Application of Elovich equation to the kinetics of phosphate release and sorption on soils”. Soil ScienceSociety of America Journal, Vol. 44, pp, 265-268, 1980.
[24] D. L. Sparks, “Kinetics of Reaction in Pure and Mixed Systems, in Soil Physical Chemistry”. CRC Press, Boca Raton. 1986. [25] P. N. Palanisamy, and P. Sivakumar,
“Adsorption Studies of Basic red 29 by A Nonconventional Activated Carbon Prepared from Euphorbia Antiquorum L”,
International journal of Chem Tech research, Vol. 1, no. 3, pp. 502-509, 2009. [26] D. Sirisha, K. Mukkanti and N. Gandhi,
“Adsorption Studies on Alum Sludge”,
Advances in Applied Sciences Research,
Vol.3, no. 5, pp.3362-3366, 2012.
[27] P. K. Pandey, S. K. Sharma, and S. S. Sambi, “Kinetics and equilibrium study of chromium adsorption on zeolite NaX”,
International Journal of Environmental Science and Technology. Vol.7, no.2, pp. 395-404, 2010.