AR
TICLE
1 Departamento de Medicina, Faculdades Integradas Pitágoras de Montes Claros. Av. Profa. Aida Mainartina Paraíso 80, Ibituruna. 39408-007 Montes Claros MG Brasil. [email protected] 2 Departamento de Ciências Exatas, Universidade Estadual de Montes Claros. Montes Claros MG Brasil. 3 Departamento de Medicina, Faculdades Integradas Pitágoras de Montes Claros. Montes Claros MG Brasil. 4 Departamento de Enfermagem, Unimontes. Montes Claros MG Brasil.
Overweight and obesity and factors associated with menopause
Abstract This study aims to check the association between overweight and obesity and sociodemo-graphic, behavioral and clinical factors in meno-pausal women. A cross-sectional study of a sample of 253 menopausal women who answered ques-tions about socioeconomic and demographic fac-tors, health in general, eating habits and behav-iors. Body-mass index (BMI) was used to assess participant nutritional status. The Menopause Rating Scale (MRS) was used to assess quality of life. To assess sexual performance we used SQ-F (Sexual Quotient, Female Version). We used bi-variate analysis and hierarchical multiple regres-sion to identify the factors associated with being overweight during menopause. Using BMI we found that 30.8% of the sample was overweight and 35.2% obese, totaling 66% overweight wom-en in the sample. In the multiple analysis, not owning a home, the severity of symptoms using MRS, use of continuous use medication and hav-ing been on any type of diet were associated with being overweight or obese. Nutritional interven-tion for weight control and changing behaviors could produce considerable benefits in terms of the
health and quality of life of menopausal women.
Key words Obesity, Menopause, Women’s health
Jaqueline Teixeira Teles Gonçalves 1
Marise Fagundes Silveira 2
Maria Cecília Costa Campos 3
Go
nçal
ves JT
Introduction
Obesity is recognized as a multi-factor metabolic change of epidemic proportions. Its prevalence has been increasing at alarming rates in almost all countries, becoming a serious public health problem. 64.9% of the women in Brazil are over-weight or obese. The problem is even greater in women between the ages of 55 and 641, and in
women with fewer years of schooling2.
Multiple factors are mentioned as the main causes of obesity in women, including chang-es inherent to the aging procchang-ess itself, as well as changes in lifestyle such as a less active lifestyle and increased consumption of energy dense food3. Researchers have found that the obesity
epidemic is caused by changes in the economic, social and physical environments4.
Brazil is seeing a rapid ageing of its popula-tion, and life expectancy among women is longer than it is for men. Because of this, more wom-en will experiwom-ence the changes associated with menopause5, which is why this period deserves
greater attention from the public health system. The World Health Organization defines menopause as a natural phase in a woman’s life that corresponds to the transition between the reproductive and non-reproductive periods, to a decrease in the production of steroid hormones6.
This period starts at around age 40 and lasts un-til age 60-65. Menopause is a milestone in this phase, normally happening at around 49 years of age, diagnosed once a woman has not experi-enced a menstrual period for twelve consecutive months6.
Hypoestrogenism resulting from menopause is mentioned as the main cause of obesity, vaso-motor, urogenital and psychological symptoms, as well as for poorer sexual performance and the high profile or morbimortality in women after the age of 50, when associated with environmen-tal, psychosocial and cultural factors7. Recent
information has associated mortality risks to the age at onset of menopause. Women who enter menopause earlier have a higher mortality rate, especially from cardiovascular causes8,9.
This being the case, although data on morbid-ity is scarce, data on mortalmorbid-ity of women during menopause justifies research to provide subsidies to promote health and disease prevention10.
Giv-en the importance of this theme and its impact on women’s health, the goal of this study was to look for an association between overweight and obesity and sociodemographic, behavioral and clinical factors in menopausal women.
Methods
This is a descriptive, cross-sectional study of menopausal women aged 40 to 60, all of them participants in an annual health education event about breast cancer held between August and October 2013 at a Family Health Strategy Unit (ESF) in Montes Claros, Minas Gerais, Brazil.
This choice is the result of access, as the city lacks a specific location to provide services to menopausal women. Women aged 40 to 60 for whom anthropometric measurements could be made were considered eligible. Pregnant women, those with psychiatric diseases, or who were un-able to answer the questionnaire or unavailun-able for the interview for any reason (e.g. no time, disease, illiteracy, explicit refusal) were excluded. The authors trained all of the interviewers ahead of time and oversaw data collection. Nutritional status, assessed via BMI, was considered the out-come variable of the study. Nutritional status was classified as underweight (BMI < 18.5); eutro-phic (BMI = 18.5 - 24.9), overweight (BMI = 25 - 29.9) and obese (BMI ≥ 30) kg/m²11. BMI was
calculated based on measured height and weight. To assess body weight, women were weighed in light garments without their shoes, standing erect with both feet together and their arms re-laxed alongside their bodies. A portable Gerath-erm® Body Fat Scale was used, with capacity for up to 150 kg, minimum and accurate to 50 g.
Height was measured using a Carci® inelastic 0 to 150 cm tape measure set against a flat wall with no baseboard. Women were told to stand up straight with their feet together and looking straight ahead, without stretching or bending their neck. Weight and height were measured in duplicate and averaged to calculate BMI.
Women were interviewed and answered questions regarding six groups of independent variables: (1) socioeconomic and demograph-ic, (2) reproductive and quality of life-MRS, (3) sexual performance, (4) overall health, (5) eating habits, and (6) health-related behavior.
Socioeconomic and demographic data in-cluded age ((40-45, 46-50, 51-55, 56-60), stated color of skin (white or non-white), marital sta-tus (stable partner, no stable partner), years of schooling (none/incomplete primary, primary, high-school, university), monthly household income (R$ 340,00 or less, R$ 341 to R$ 678,00, over R$ 678,00), occupation (paid/not paid), and home-owner (yes or no).
e C
ole
tiv
a,
21(4):1145-1155,
2016
menopause (50 or under, over 50, not yet meno-pausal), and the climacteric profile (pre or post menopause). Pre-menopause if regular menstrual cycles were present, and post-menopausal if the woman’s menstrual periods had been absent for a period equal to or longer than 12 consecutive months. Menopausal status was defined based on the woman’s menstrual history in the past year. Quality of life was analyzed using the Menopause Rating Scale (MRS) validated in Portuguese. This is an 11-question questionnaire dealing with symp-toms, split into somato-vegetative, psychological and urogenital. This tool allowed each woman to state her opinion regarding each symptom - ab-sent, mild, moderate, severe and very severe12.
Sexual performance was assessed using the Sexual Quotient questionnaire (SQ-F) - Female Version, made up of 10 questions to be answered using a scale of 0 to 5. This tool enables analyzing the various domains of female sexual activity - desire, excitation, orgasm and their related psy-chophysical factors. A higher the score on SQ-F questions (except for the question regarding pain) indicates better or more satisfying sexual performance13.
The general health group of questions was made up of the following variables: present or past use of dichotomized hormone replacement therapy, and the use of other medicines split into continued use nor not. To analyze eating habits, we used as variables the use of soy supplements, eating fruits, vegetables and legumes and dieting.
Use of soy supplements was dichotomized into yes and no. In order to learn about wheth-er the women ate fruits, vegetables and legumes, we asked two questions: how many times a day and how many times a week. The variables were dichotomized into eats fruits 3 to 5 times a week, eats fruits and legumes 3 to 5 times a week due to the small number of women who reported eating the recommended amounts in the Nutritional Guidebook for the Brazilian Population14.
Wom-en were asked if they were on a weight-loss diet at the time, or had been in the past, or if they had never been on a diet.
The health-related behavior group of ques-tions was comprised of the variable exercise (physical activity), assessed using the criteria es-tablished by the Brazilian Cardiology Society15.
Women with no regular physical activity – de-fined as at least 30 minutes 3 times a week, re-gardless of the type of exercise – were considered sedentary15.
Initially we performed descriptive analyses of all of the survey variables using frequency distri-butions. We then ran bivariate analyses between the outcome variable and each independent variable, using a Poisson regression model with robust variance. We estimated gross Prevalence Ratios (PR) and their respective 95% confidence intervals. The variables with a descriptive level (p-value) of less than 0.25 were selected for mul-tiple analysis using a hierarchical Poisson regres-sion model. Here we used the model in Figure 1, with blocks of distal (socioeconomic and demo-graphic), intermediate (reproductive and MRS quality of life and sexual performance) and prox-imal (overall health, eating habits and health-re-lated behavior) variables16.
The stepwise forward procedure was used for each hierarchical level, starting with the variable with the largest statistical significance selected from the bivariate analysis, and then adding the other variables one by one by decreasing order of descriptive level.
Demographic and socioeconomic character-istics was the first block to be added to the mod-el, remaining as an adjustment factor for inter-mediate and proximal determinants only when those variables had a descriptive level of p<0.05. We then added intermediate variables (repro-ductive, quality of life-MRS and sexual perfor-mance). Only variables with p<0.05 were kept in the model after adjusting for the distal level variables. We included the proximal variables (overall health, eating habits and health-related behavior) last. Again, only variables with p<0.05 were kept in the model after adjusting for the dis-tal level variables.
We estimated gross Prevalence Ratios (PR) and their respective 95% confidence intervals. The Deviance test was used to assess the quality of the adjustment of the multiple model. Analy-ses were performed using PASW® 17.0.
This study complies with Resolution 466/2012. This study was approved by the Re-search Ethics Committee (REC) of Universidade Estadual de Montes Claros.
Go
nçal
ves JT
Results
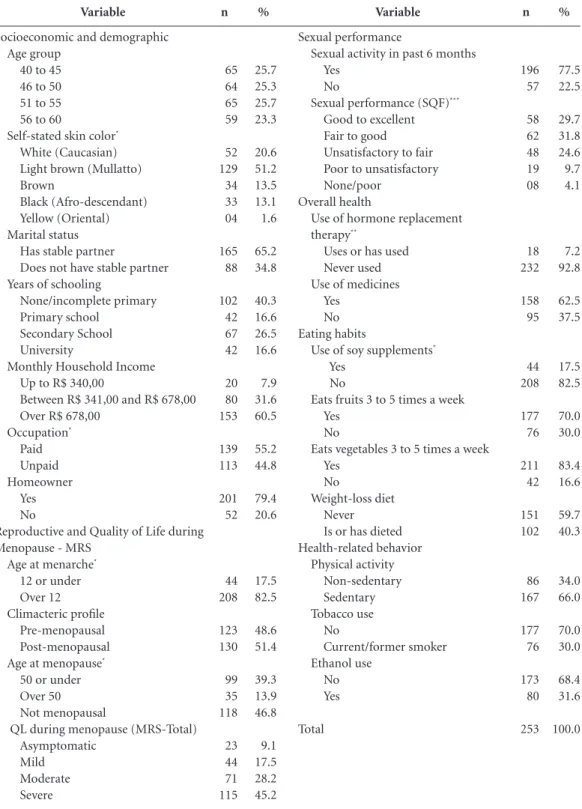
The sample was made up of women with an av-erage age of 50.2 (SD ± 5.8 years), 86 of them (34%) classified as eutrophic, 78 (30.8%) as over-weight and 89 (35.2%) as obese. A total of 167 women (66% of the sample) were overweight or obese. The average BMI was 28.1 kg⁄m² (SD ± 5.6). Other characteristics of the study group are listed in Table 1.
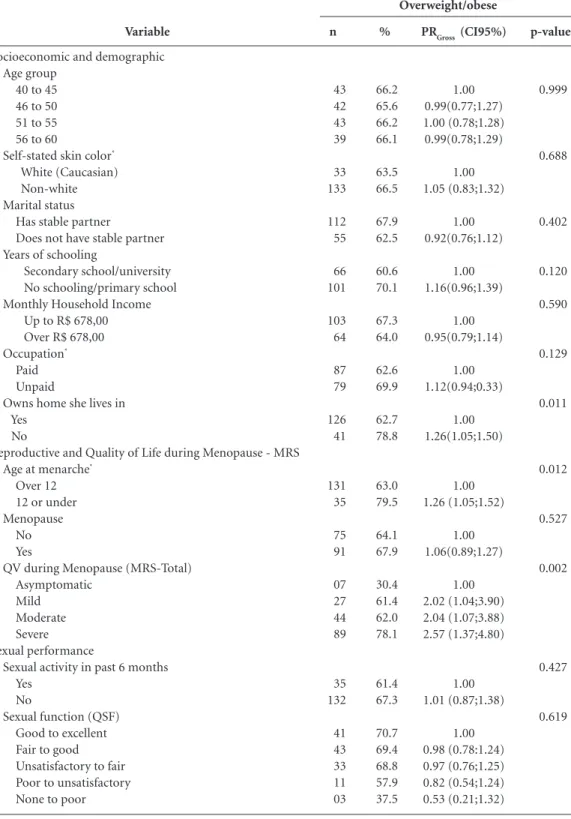
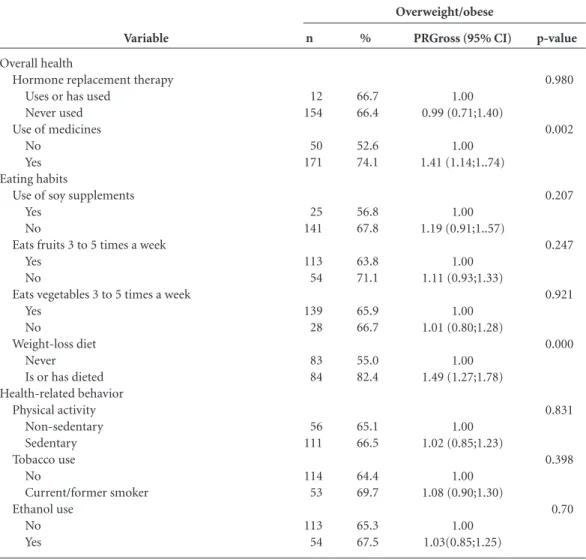
Tables 2 and 3 show the results of the bivariate analyses. This study found a 0.25% association between the following variables and the outcome of overweight or obese: years of schooling (p = 0.120), occupation (p = 0.129), home-owner (p = 0.011), age at menarche (p = 0.012), QoL during menopause (p = 0.002), use of medicines (p = 0.002), use of soy supplements (p = 0.207), eating fruits (0.247) and dieting (0.000). These variables were selected for the final multiple analysis.
The results of factors associated with being overweight or obese from the hierarchical mul-tiple regression analysis are shown in Table 4. In the more distal determination block, the variable “owns home” was associated with being over-weight. The prevalence of overweight/obesity was higher among women claiming not own the home they live in (PR = 1.26)
In the intermediate block, Quality of Life during Menopause (MRS) was associated with being overweight or obese, regardless of demo-graphic and socioeconomic characteristics. The prevalence of overweight and obesity was higher among women with mild (PR = 2.02), moderate (PR = 2.03) and severe (PR = 2.53) symptoms compared to women with no symptoms. Among the proximal variables, we found that women us-ing medicines (PR = 1.26) and those who are
di-eting or have dieted (PR = 1.49) showed a higher incidence of overweight/obesity after adjusting for the variables in the hierarchically superior blocks.
Discussion
The frequency of overweight and obesity among the study population was 66%, with an average BMI of 28.1 kg/m² (SD = 5.6), which is close to the number reported by other authors10,17,18. In the
city of Passo Fundo, RS a study of 298 menopaus-al women showed that 68.4% of them were over-weight, with an average BMI of 28.3 kg/m² (SD = 7.0)19. This is close to the 64% prevalence found in
a group of 611 women in Caxias do Sul, with an average BMI of 27.4 kg/m220. A survey of Brazilian
women showed that 64.9% had some degree of excess weight, confirming the magnitude of this problem among the female population1.
Data from Brazil (2011) shows a growing prev-alence of excess weight among women, with the highest prevalence in women 45 to 54 and 55 to 64 years of age, or 55.9% and 60.9% respectively21.
Similar results show that obesity among women has also increased1,20,22. According to the literature,
in middle-aged women, overweight and obesity are relevant risk factors for the development of chronic diseases such as metabolic syndrome23.
Given this scenario, we find that aging may have be a strong influencer for developing obe-sity due to the decrease in hormone levels that brings with it a decrease in the amount of energy spent. By associating this change with external factors such as inappropriate eating habits and a sedentary lifestyle, middle-age women may experience an average 2 kg/year weight increase during the course of three years24.
Figure 1. Conceptual hierarchical model.
Source: Lins et al.13. Socioeconomic and demographic characteristics
Distal level
Reproductive and quality of life - MRS
Sexual performance Intermediate level
Overall health
Eating habits
Health-related behavior Proximal level
e C ole tiv a, 21(4):1145-1155, 2016
Table 1. Distribution of women 40 to 60 according to their socioeconomic and demographic, reproductive, quality of life-MRS, sexual performance, overall health, eating habits and health-related behavior characteristics. Montes Claros, 2013.
Variable
Socioeconomic and demographic Age group
40 to 45 46 to 50
51 to 55 56 to 60
Self-stated skin color*
White (Caucasian) Light brown (Mullatto) Brown
Black (Afro-descendant) Yellow (Oriental) Marital status
Has stable partner
Does not have stable partner Years of schooling
None/incomplete primary Primary school
Secondary School University
Monthly Household Income Up to R$ 340,00
Between R$ 341,00 and R$ 678,00 Over R$ 678,00
Occupation* Paid Unpaid Homeowner Yes No
Reproductive and Quality of Life during Menopause - MRS
Age at menarche*
12 or under Over 12 Climacteric profile
Pre-menopausal Post-menopausal Age at menopause*
50 or under Over 50 Not menopausal
QL during menopause (MRS-Total) Asymptomatic Mild Moderate Severe n 65 64 65 59 52 129 34 33 04 165 88 102 42 67 42 20 80 153 139 113 201 52 44 208 123 130 99 35 118 23 44 71 115 % 25.7 25.3 25.7 23.3 20.6 51.2 13.5 13.1 1.6 65.2 34.8 40.3 16.6 26.5 16.6 7.9 31.6 60.5 55.2 44.8 79.4 20.6 17.5 82.5 48.6 51.4 39.3 13.9 46.8 9.1 17.5 28.2 45.2
* 1 person did not answer; ** 3 people did not answer; *** 58 women did not answer the SQF.
Variable
Sexual performance
Sexual activity in past 6 months Yes
No
Sexual performance (SQF)***
Good to excellent Fair to good Unsatisfactory to fair Poor to unsatisfactory None/poor
Overall health
Use of hormone replacement therapy**
Uses or has used Never used Use of medicines
Yes No Eating habits
Use of soy supplements*
Yes No
Eats fruits 3 to 5 times a week Yes
No
Eats vegetables 3 to 5 times a week Yes
No
Weight-loss diet Never
Go
nçal
ves JT
Table 2. Percent distribution of overweight/obesity, gross prevalence ratio (PR) and 95% confidence interval according to socioeconomic, demographic and reproductive characteristics, menopause symptoms and sexual function. Montes Claros-MG, 2013.
Variable
Socioeconomic and demographic Age group
40 to 45 46 to 50
51 to 55 56 to 60
Self-stated skin color*
White (Caucasian) Non-white Marital status
Has stable partner
Does not have stable partner Years of schooling
Secondary school/university No schooling/primary school Monthly Household Income Up to R$ 678,00 Over R$ 678,00 Occupation*
Paid Unpaid
Owns home she lives in Yes
No
Reproductive and Quality of Life during Menopause - MRS Age at menarche*
Over 12 12 or under Menopause
No Yes
QV during Menopause (MRS-Total) Asymptomatic
Mild Moderate Severe Sexual performance
Sexual activity in past 6 months Yes
No
Sexual function (QSF) Good to excellent Fair to good Unsatisfactory to fair Poor to unsatisfactory None to poor
n 43 42 43 39 33 133 112 55 66 101 103 64 87 79 126 41 131 35 75 91 07 27 44 89 35 132 41 43 33 11 03 % 66.2 65.6 66.2 66.1 63.5 66.5 67.9 62.5 60.6 70.1 67.3 64.0 62.6 69.9 62.7 78.8 63.0 79.5 64.1 67.9 30.4 61.4 62.0 78.1 61.4 67.3 70.7 69.4 68.8 57.9 37.5
PRb: prevalence ratio; 95% CI: 95% confidence interval.
PRGross (CI95%)
e C
ole
tiv
a,
21(4):1145-1155,
2016
Table 3. Percent prevalence of overweight/obesity, gross prevalence ratio and 95% confidence interval according to overall health variables, eating habits and health-related behavior. Montes Claros-MG, 2013.
Variable
Overall health
Hormone replacement therapy Uses or has used
Never used Use of medicines
No Yes Eating habits
Use of soy supplements Yes
No
Eats fruits 3 to 5 times a week Yes
No
Eats vegetables 3 to 5 times a week Yes
No
Weight-loss diet Never Is or has dieted Health-related behavior
Physical activity Non-sedentary Sedentary Tobacco use
No
Current/former smoker Ethanol use
No Yes
n
12 154
50 171
25 141
113 54
139 28
83 84
56 111
114 53
113 54
%
66.7 66.4
52.6 74.1
56.8 67.8
63.8 71.1
65.9 66.7
55.0 82.4
65.1 66.5
64.4 69.7
65.3 67.5
PRb: prevalence ratio; 95% CI: 95% confidence interval.
PRGross (95% CI)
1.00 0.99 (0.71;1.40)
1.00 1.41 (1.14;1..74)
1.00 1.19 (0.91;1..57)
1.00 1.11 (0.93;1.33)
1.00 1.01 (0.80;1.28)
1.00 1.49 (1.27;1.78)
1.00 1.02 (0.85;1.23)
1.00 1.08 (0.90;1.30)
1.00 1.03(0.85;1.25)
p-value
0.980
0.002
0.207
0.247
0.921
0.000
0.831
0.398
0.70
Overweight/obese
We reiterate the importance of these findings, as they make this population a target for public health programs seeking to prevent obesity and its associated comorbidities. The city of Mon-tes Claros is located on the border between the Southeast and Northeast regions of Brazil. From an economic and social point of view, it is closer to the Northeast than the Southeast, being locat-ed in the semi-arid region of the state of Minas Gerais, a poor region with low rainfall and con-sequently limited water resources. The recent in-crease in the purchasing power of lower income households has influenced an imbalance between calories ingested and calories burned, resulting in excess weight. An explanation for this may be re-lated to the recent trend to replacing traditional
foods in the Brazilian diet (such as rice, beans and vegetables) with processed foods and beverages, with a higher energy density and eating patterns that can compromise the energy balance and in-crease the risk of obesity in this population.
According to the results of the multiple anal-ysis, not owning a home, severe symptoms ac-cording to the MRS, continued use medicines and past dieting are associated with being over-weight or obese. On the other hand, a study of 456 menopausal women in Paraná found differ-ent results, showing that the main factors related to obesity are having three or more children and not using hormone replacement therapy25.
Go
nçal
ves JT
overweight or obese than those who do. This variable may be understood as an economic indi-cator, and refers to a higher prevalence of excess weight and obesity, as does a study of 440 women that found that lower income was associated with excess weight26. One may infer that lower
house-hold income makes it harder to purchase a home, and may be associated with decrease knowledge of which foods are healthier and associated with balanced body weight. A survey of 758 women showed that 73.6% ate a healthy diet, a habit that increases with income16.However, this matter
must be further explored in new studies, as other authors did not make this same observation17.
Another economic indicator the authors found to be associated with excess weight are few years of schooling10,26. Although referred to in the
literature, this study did not find such association. The chance of being overweight was found to be eight times higher among women with severe menopausal symptoms according to the MRS, than among those with no symptoms. A survey of menopausal women found that higher BMIs were associated with poorer scores on the MRS quality of life scale17. A study of 490 women in
Saudi Arabia found a strong correlation between
obesity and severe menopausal symptoms27. A
study in Scotland found a relationship between vasomotor symptoms such as heat waves and obesity28. On the other hand, a study of 305
women showed no correlation between BMI and the symptoms assessed by the MRS29.
Regarding overall health, another factor relat-ed to excess weight was the use of mrelat-edicine. Wom-en making continuous use of medicines were two and a half as likely to be obese than those who did not. A study conducted by the Ribeirão Preto menopause outpatient clinic showed high BMIs, with 62% of the women taking three or more medicines per day30. The average BMI found in a
study of 200 menopausal women revealed obesity, with almost half (48.5%) claiming they use med-icine for cardiovascular diseases and 23% use an-di-depressants17. One explanation for this positive
association is a higher prevalence of morbidities in women of a more advanced age, among them those associated with obesity such as high blood pressure, metabolic syndrome, bone and muscle diseases and depression. Furthermore, medicines symbolize a desire to change the “natural course” of most diseases, and go beyond a specific therapy, becoming a cultural characteristic.
Table 4. Results of the hierarchical Poisson multiple regression analysis Montes Claros – MG, 2013.
Variable
Socioeconomic and demographic Home-owner
Yes No
Menopause symptoms*
Menopause symptoms (MRS- Total) Asymptomatic
Mild Moderate Severe Overall health**
Use of medicines No
Yes Eating habits***
Weight-loss diet Never Is or has dieted
Gross PR
1.00 1.26
1.00 2.02 2.04 2.57
1.00 1.41
1.00 1.49
PR: Prevalence ratio; 95% IC: 95% confidence interval. * Adjusted by the variable “owns home she lives in”. ** Adjusting by the variables “owns home she lives in” and “menopause symptoms”. *** Adjusted by the variables “owns home she lives in”, “menopause symptoms” and “use of medicines”.
Adjusted PR (05% IC)
1.00 1.26 (1.06;1.50)
1.00 2.02 (1.05;3.89) 2.03 (1.07;3.85) 2.53 (1.36;4.70)
1.00 1.26 (1.01;1.26)
1.00 1.49 (1.26;1.79)
p-value
0.011
0.035 0.030 0.003
0.041
0.000
e C
ole
tiv
a,
21(4):1145-1155,
2016
Regarding eating habits, women who had al-ready dieted to lose weight, or who were dieting while the study was underway, had a higher prev-alence of excess weight and obesity than women who had never dieted. In this study, 40.3% of the women reported that they were or had dieted to lose weight. An analysis of the medical records of menopausal women showed that 66.7% of the participants had gone on some sort of diet and that the average MI of these women was 30.7% kg/m², indicating they were obese18.
Correlating the presence of overweight or obesity and sexual performance, we found no statistical significance, as did another study31. On
the other hand, other surveys show an association between these factors, relating this association primarily to self-perceived physical attraction32,33.
The arrival of menopause comes with ageing, and oftentimes weight-gain. Surveys show that obesity changes women’s self-esteem, creating a negative body image and compromising their sex-ual satisfaction33,34. Furthermore, this vision may
lead women to believe that they have lost their powers of seduction. Thus menopausal and espe-cially post-menopausal women may feel incom-petent and unable of good sexual performance.
Conclusion
Although this study was developed with a non-probabilistic sample, which limits the ex-ternal validity of the results, some variables have been found to be associated with excess weight, such as not owning a home, which is a reflection of an unfavorable economic situation, meno-pausal symptoms, continuous use of medicines and past dieting.
The frequency of excess weight found in our study is in line with the results of other studies in this country, showing that measures must be taken as this morbid condition in menopausal women is not only influenced by biological fac-tors such as hypoestrogenism, but also by psy-chosocial and life-style factors.
Thus, overweight and obesity associated with menopause require increased attention and a multidisciplinary approach to women’s health to prevent morbi-mortality in this population group. The results also indicate a number of im-portant behavioral, sociodemographic and clini-cal factors that should be further investigated in new studies.
Colaborations
Go
nçal
ves JT
References
Instituto Brasileiro de Geografia e Estatística (IBGE). Pesquisa de orçamentos familiares 2008-2009. Antro-pometria e estado nutricional de crianças, adolescentes e adultos no Brasil. Rio de Janeiro; 2010. [citado 2011 jun 4]. Disponível em: http://www.ibge.gov.br/home/esta- tistica/populacao/condicaodevida/pof/2008_2009_en-caa/pof_20082009_encaa.pdf
Linhares RS, Horta BL, Gigante DP, Dias-da-Costa JS, Olinto MTA. Distribuição de obesidade geral e abdo-minal em adultos de uma cidade no Sul do Brasil. Cad Saude Publica 2012; 28(3):438-447.
Almeida JPM, Carnide C, Branquinho M, Geraldes F, Águas F. Impacto da terapia hormonal sobre o peso corpóreo. Rev Bras Ginecol Obstet 2011; 33(10):310-314.
Sturm R, An R. Obesity and economic environments. CA Cancer J C 2014; 64(5):337-350.
Tannure MC, Alves M, Sena RR, Chianca TCM. Perfil epidemiológico da população idosa de Belo Horizonte, MG, Brasil. Rev. bras. enferm. 2010; 63(5):817-822. Mundial de la Salud (OMS). Investigaciones sobre la menopausa en los anos noventa: informe de un grupo cientifico de la OMS. Ginebra: OMS; 1996. (OMS, Serie de informes técnicos, nº 866).
Sutton-Tyrrell K, Zhao X, Santoro N, Lasley B, Sowers M, Johnston J, Mackey R, Matthews K: Reproductive hormones and obesity: 9 years of observation from the study of women’s health across the nation. Am J Epide-miol 2010; 171(11):1203-1213.
Wu X, Cai H, Kallianpur A, Gao YT, Yang G, Chow WH, Li HL, Zheng W, Shu XO. Age at menarche and natural menopause and number of reproductive years in asso-ciation with mortality: results from a median followup of 11.2 years among 31,955 naturally menopausal Chi-nese women. PLoS One 2014; 9(8):e103673.
Mondul AM, Rodriguez C, Jacobs EJ, Calle EE. Age at natural menopause and cause-specific mortality. Am J Epidemiol 2005; 162(11):1089-1097.
Theodoro H, Rodrigues AD, Mendes KG, Liane RH, Paniz VM, Olinto MT. Reproductive characteristics and obesity in middle-aged women seen at an out-patient clinic in southern Brazil. Menopause 2012; 19(9):1022-1028.
Associação Brasileira para o Estudo da Obesidade e da Síndrome Metabólica (ABESO). Diretrizes Brasileiras de Obesidade (2009/2010). Itapevi; 2009. [citado 2013 jul 25]. Disponível em: http://www.abeso.org.br/pdf/ diretrizes_brasileiras_obesidade_2009_2010_1.pdf . Heinemann K, Ruebig A, Potthoff P, Schneider HP, Strelow F, Heinemann LA, Thai DM. The Menopause Rating Scale (MRS) scale: a methodological review. Health Qual Life Outcomes 2004; 2:45.
1.
2.
3.
4. 5.
6.
7.
8.
9.
10.
11.
12. Acknowledgements
e C
ole
tiv
a,
21(4):1145-1155,
2016
Abdo CHN. Quociente sexual feminino: um questio-nário brasileiro para avaliar a atividade sexual da mu-lher. Diagn Tratamento 2009; 14(2):89-91.
Brasil. Ministério da Saúde (MS). Secretaria de Aten-ção à Saúde. Guia alimentar para a população brasileira: promovendo a alimentação saudável. Brasília: MS; 2008. (Série A. Normas e Manuais Técnicos).
Sociedade Brasileira de Cardiologia. Departamento de Aterosclerose da Sociedade Brasileira de Cardiologia. IV Diretriz Brasileira Sobre Dislipidemias e Prevenção da Aterosclerose. Arq Bras Cardiol 2007; 88(Supl. 1):2-19.
Lins APM, Sichieri R, Coutinho WF, Ramos EG, Peixo-to MVM, Fonseca VM. Alimentação saudável, escolari-dade e excesso de peso entre mulheres de baixa renda. Cien Saude Colet 2013; 18(2):357-366.
Gallon CW, Wender MCO. Estado nutricional e qua-lidade de vida da mulher climatérica. Rev Bras Ginecol Obstet 2012; 34(4):175-183.
Martinazzo J, Zemolin GP, Spinelli RB, Zanardo VPS, Ceni GC. Avaliação nutricional de mulheres no clima-tério atendidas em ambulatório de nutrição no norte do Rio Grande do Sul, Brasil. Cien Saude Colet 2013; 18(11):3349-3356.
Colpani V, Spritzer PM, Lodi AP, Dorigo GG, Miranda IAS, Hahn LB, Palludo LP, Pietroski RL, Oppermann K. Atividade física de mulheres no climatério: compara-ção entre auto-relato e pedômetro. Rev Saude Publica 2014; 48(2):258-265.
De Lorenzi DRS, Basso E, Fagundes PO, Saciloto B. Prevalência de sobrepeso e obesidade no climatério. Rev Bras Ginecol Obstet 2005; 27(8):479-484.
Brasil. Ministério da Saúde (MS). Secretaria de Vigilân-cia em Saúde. Vigitel Brasil 2011: vigilância de fatores de risco e proteção para doenças crônicas por inquérito telefônico. Brasília: MS; 2012.
Giolo De Carvalho F, de Souza Santos R, Iannetta R, Marques Miguel Suen V, Marliere Navarro A, No-nino Borges CB, Marchini JS, Iannetta O. Analysis of bone microarchitecture related to anthropometry in climateric women. Nutr Hosp 2012; 27(2):612-616. Maharlouei N, Bellissimo N, Ahmadi SM, Lanka-rani KB. Prevalence of metabolic syndrome in pre-and postmenopausal iranian women. Diabetes 2013; 16(5):561-567.
Polotsky HN, Polotsky AJ. Metabolic implications of menopause. Sem rep med 2010; 28(5):426-434. Gravena AAF, Brischiliari SCR, Lopes TCR, Agnolo CMD, Carvalho MDB, Pelloso SM. Excess weight and abdominal obesity in postmenopausal Brazilian wom-en: a population based study. BMC womens health 2013; 13(46):3-7.
13.
14.
15.
16.
17.
18.
19.
20.
21.
22.
23.
24. 25.
Rosa MI, Silva FML, Giroldi SB, Antunes GN, Wend-land EM. Prevalência e fatores associados à obesidade em mulheres usuárias de serviços de pronto-aten-dimento do Sistema Único de Saúde no sul do Bra-sil. Cien Saude Colet 2011; 16(5):2559-2566.
AlQuaiz AM, Tayel SA, Habiba FA. Assessment of symptoms of menopause and their severity among Sau-di women in Riyadh. Ann Saudi Med 2013; 33(1):63-67. Duffy OK, Iversen L, Hannaford PC. Factors associat-ed with reporting classic menopausal symptoms differ. Climacteric 2013; 16(2):240-251.
Tan MN, Kartal M, Guldal D. The effect of physical ac-tivity and body mass index on menopausal symptoms in Turkish women: a cross-sectional study in primary care. BMC Womens Health 2014; 14(38):1-9.
Santos RDS, Furtado EC, Carvalho FGD, Iannetta R, Nonino CB, Marchini JS, Ribas Filho OID, Suen VMM. Climaterium, food intake and medicines. International Journal of Nutrology 2012; 5(3):134-138.
Kadioglu P, Yetkin DO, Sanli O, Yalin AS, Onem K, Ka-dioglu A. Obesity might not be a risk factor for female sexual dysfunction. BJUI 2010; 106(9):1357-1361. Castro MJA, Márquez-Veja J, Arteta-Acosta C. Disfun-ción sexual en mujeres climatéricas afrodescendientes del Caribe Colombiano. Iatreia 2014; 27(1):31-41. Shahhosseini Z, Gardeshi ZH, Pourasgha M, Salehi F. A review of affecting factors on sexual satisfaction in women. Mater Socio Med 2014; 26(6):378-381. Câmara CNS, Corrêa HVV, Silva SCB, Da Silva CSA, Silva Junior M, Brito RS. Life Cycle Comparative Anal-ysis of Sexual Function in Women with Normal and Overweight Body Mass Index. Creative Education 2014; 5(15):1363-1376.
Article submitted 24/03/2015 Approved 23/10/2015
Final version submitted 25/10/2015 26.
27.
28.
29.
30.
31.
32.
33.