AR
TICLE
1 Instituto Paranaense de Desenvolvimento Econômico e Social. R. Máximo João Kopp 274/ Bloco 2, Santa Cândida. 82630-900 Curitiba PR Brasil.
[email protected] 2 Instituto Federal Farroupilha. 3 Instituto Superior de Filosoia Berthier. 4 Faculdade de Administração,
Contabilidade e Economia, Pontifícia Universidade Católica do Rio Grande do Sul.
5 Departamento de Ciências Econômicas, Faculdade de Ciências Econômicas, Universidade Federal do Rio Grande do Sul.
Smoking and poverty in Brazil: an analysis of the profile
of the smoking population based on the 2008-09
Brazilian government Family Budget Survey
Abstract This paper aims to characterize the Brazilian population who spent money with to-bacco products. POF dataset was used from IBGE of the years 2008 and2009. The same definition that IBGE usually use for tobacco consumer was applied, which is someone has spent money with any kind of tobacco products and its derivatives. It was used individual aspects taking into account such as gender, schooling, age (over 14 years old), income lines, regions and ethnics to characterize these populations. Descriptive statistics were em-ployed to estimate the results and the complex sample design of the survey was considered. Ac-cording to our results, on average, 10% of the Bra-zilian population have spent money with tobacco products. Besides, these people are older, earn low salaries and have less schooling than someone who does not consume tobacco. Moreover, for this population 1.5% of the family budget is spent on tobacco products. Last but not least, the most of tobacco consumers are men. In general, mon-ey which is spent on tobacco products can cause impressive effects on domestic budget because this value could supply other important necessities to the family. Although there are many monitoring and prevention strategies to avoid tobacco con-sume, deep knowledge about this population that actually consume these products can increase the efficacy of more specific policies.
Key words Smoking, Brazilian population, health, Expenses
Angelita Bazotti 1
Manuela Finokiet 2
Irio Luiz Conti 3
Marco Tulio Aniceto França 4
B
az
Introduction
The World Health Organization ranks illnesses linked to smoking as the second most frequent cause of death worldwide, although they can be avoided. Ten thousand deaths per day are record-ed as a result of consumption of tobacco prod-ucts – associated with various types of cancer, lung and heart diseases, arterial hypertension
and stroke1-3.
The epidemic of chronic diseases and prema-ture deaths caused by smoking which in the past principally affected the industrialized economies
is expanding rapidly in the developing countries4.
In the year 2011, approximately 80% of deaths arising from consumption of tobacco took place
in countries with low and average income5.
Further, the effects of the use of tobacco are not limited to the users themselves: evidence shows a high risk of lung cancer among those who are not smokers, that is to say, those who are exposed to so-called passive smoking. This risk is estimated at 20% for women, and 30% for men, who live with smokers. The WHO estimates the annual number of deaths arising from direct or
passive smoking at around six million6, since it is
the factor responsible for one in every ten adult deaths. In 2011, tobacco was the factor responsi-ble for one in every ive deaths of men and one in
every twenty deaths of women4. Pinto and Ugá7
calculated the direct cost of hospitalizations in
Brazil’s Single Health System (Sistema Único de
Saúde – SUS) as a result of illnesses related to tobacco in the year 2005. The illnesses analyzed were: cancer, and illnesses related to the circula-tory and respiracircula-tory systems. The authors note that the expense attributable to smoking was 27.6% of the total costs of the procedures ana-lyzed, for the three groups, and 36.3% of the total amount spent on chemotherapy.
Studies by the (Aliança de Controle do
Tab-agismo – ‘Alliance for Control of Smoking’) [a Brazilian NGO] show that Brazil spends approxi-mately R$ 21 billion annually on treating patients with illnesses related to smoking, and smoking is
responsible for 13% of the deaths in the country8.
As well as the damage to health, tobacco caus-es signiicant impacts on the domcaus-estic budget, since this income could be applied to serve other needs that are more urgent in the family unit. The evidence available shows that poorer individuals smoke more and, for them, the money spent on tobacco represents a high opportunity cost, as it is money not invested in vitally important goods
such as food, education and health4. However,
it is important to note that in families that have smokers, the percentage of total expenses that is incurred on tobacco products fell from 3% in 1995–96 to 2% in 2002–03.
Although Brazil is one of the world’s largest producers of leaf tobacco, the government has taken several measures to reduce consumption of
tobacco and tobacco-derived products9.
Accord-ing to Brazil’s National Cancer Institute (Instituto
Nacional do Câncer – INCA), in the area of ed-ucation there are one-off actions, with continu-ous awareness campaigns, the objective of which is to disseminate information about prevention of cancer, both in relation to smoking and in re-lation to the other risk factors. In the economic area, actions that have supported government decisions are planned based on studies carried out to collect data on production, prices, adver-tising, consumption and tax revenue related to tobacco and its derivative products in Brazil. The imposition of high taxes on these products seems to be very effective, because surveys in several countries show a negative relationship between
consumption of tobacco and the level of prices10.
In 2008 the WHO launched the program
known as MPOWER (Monitor, Protect, Offer,
Warn, Enforce and Raise), a package of policies based on the measures in the WHO Framework Convention on Tobacco Control (the ‘WHO FCTC’). The central objective is to help reduce tobacco consumption by promoting implemen-tation of the FCTC in the countries concerned. This package aims to provide incentive for for-mulators of public policies, in their relationship with society and the providers of health services, to conceive a world free of tobacco, offering the instruments that are necessary for reduction of consumption through promotion of a socio-eco-nomic and legal context that favors life without smoking.
The actions of this program center on the fol-lowing activities: monitoring of the use of tobac-co; adoption of prevention policies; protection of the population against tobacco smoke; offer of help in giving up smoking; warning about its dangers; compliance with prohibitions on adver-tising; and promotion and increase of taxes on the product. This package of measures aims to reduce smoking worldwide, with interventions of wide scope, and application of effective control policies, based on data collected and on a
rigor-ous monitoring of the evaluation of its impact11.
e C
ole
tiv
a,
21(1):45-52,
2016
smoking it is necessary to have knowledge of the proile of the population that consumes items related to this industry, especially because the impacts on health arising from its use are not limited only to the users themselves. This pres-ent study aims to characterize the population that reported expenditure on products related to tobacco (cigarettes, cigarillos and cigars, in particular), based on analysis of Brazil’s Family
Budgets Survey (Pesquisa de Orçamentos
Famil-iares – POF) of 2008–200912. The Brazilian
Ge-ography and Statistics Institute (IBGE) deines as ‘smokers’ those people who reported in the POF that they had spent money on articles relating to tobacco, whether they themselves are smokers or not. Thus, the criteria for characterization of this population as ‘smokers’ is the expenditure of in-come, not the act of smoking, although there is a close relationship between the inancial expense and actual consumption.
This survey makes an important contribu-tion to the literature by adding to the published data, and by employing quantitative methods on a database that measures recent expenditure (2008–09) on consumer products that are dan-gerous to health. This information makes it pos-sible to analyze new aspects about smokers, since these individuals will be the people potentially demanding both public and private health ser-vices in the future.
Materials and methods
This study uses the database of the POF for the period 2008–9. The POF is a home-research survey, carried out by sampling, which brings together a group of information about the struc-ture of the family budget, the nutritional situa-tion, the products and services available and the living conditions of the Brazilian population. The aim of the POF is to delineate the consump-tion habits of the Brazilian family, independently of earnings. The survey was held over 12 months, thus providing an estimation of family budgets including alterations of expenses and income over the period of the year. The irst POF was carried out in 1974–5, followed by surveys in 1987–8, 1995–6, 2002–3 and 2008–9.
The sample is representative of the Brazilian population and comprises permanent private domiciles for habitation of one or more persons, linked by family relationship, domestic
depen-dence or customs of living together12. The
domi-cile is the basic unit for investigation and analysis
of budgets, including the total number of people who comprise it, and may be a single person, or a group of residents who share the same source of food and, thus, carry out a group of food expens-es in common. In most situations, for the pur-poses of publication of the POF by the IBGE, this consumer unit coincides with the ‘family’.
The universe used for this study is people over the age of 14 who have incurred expense on items related to smoking that are present in the POF questionnaire. These are: cigarettes, dispos-able lighters, cigars, cigarillos, shredded tobacco, shredded tobacco for cigarettes, shredded tobac-co for pipes, matches, cigarette holders, lighter luids, lighter gas, lighter lint, rolling tobacco, snuff, rolled cigarettes, rolling paper for ciga-rettes, and cigarette paper. The section on results presents the proile – by gender, age, skin color, years of schooling and Region of Brazil – of the smoking and non-smoking population, with the
help of descriptive statistics. The t and F tests
were used to carry out statistical inferences mak-ing it possible to present and discuss the differ-ences (if any) between the characteristics of the smoking and non-smoking populations.
Results
The total Brazilian population estimated by the POF is 180,745,058, of which those over the age of 14 total 135,676,655 people. Of these, 9.9% reported that they had had expenses on tobac-co, and we will now treat them as the smoking population.
Considering the information available and the campaigns carried out, one could conclude that the fact that almost 10% of the adult popu-lation is smokers represents a signiicant percent-age, although it is below the world averpercent-age, which
is 20% of adults5.
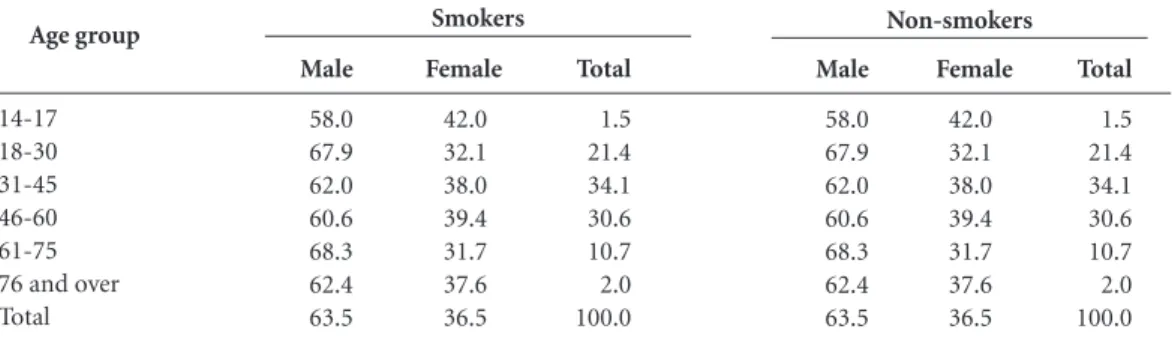
In the Brazilian smoking population, men are predominant in all the age groups (Table 1). In the non-smoking population, women are preva-lent, except in the age group 14 to 17. This shows that expenses on smoking are strongly linked to the male gender (63.5%).
We divided the smoking and non-smoking groups by age groups, to discover an age distri-bution within each. The 31-45 age group had the highest percentage of smokers, and the 18–30 age group had the largest percentage of non-smokers. The average age of smokers is 43.4, and of
non-smokers 39.3. From the value of the t test
B
az
null hypothesis that the averages are equal is re-jected. Thus, it can be stated that among smokers there are more men and that they are older than the non-smokers.
Table 2 shows the population by years of schooling, and age groups.
Firstly, it is observed that the younger peo-ple stand out for having more years of school-ing. This can be attributed to the improvement in living conditions, and expansion of access to schooling, since the mid-1990s, which was the period when the country almost achieved
uni-versal access to primary education13,14. We note
that 38.6% of the non-smoking population over the age of 76 reports zero years of schooling, and this percentage is even higher (53.6%) among smokers. In the population with 12 or more years
of schooling, 8.1% are non-smokers and 5.5% smokers.
The results show a high percentage of indi-viduals aged 18 to 30 who do not have even com-pleted primary education. Of these, 50.9% are smokers and 33.4% non-smokers. The results also show tobacco consumption seems to have a negative correlation with level of education – a result that is similar to that shown by Cavalcante
and Pinto15.
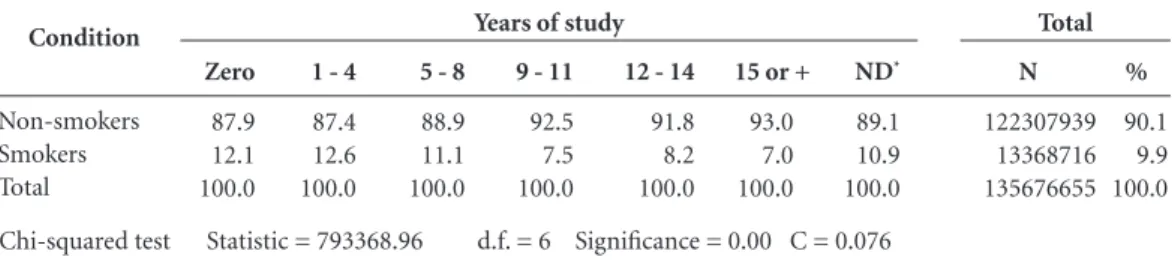
In Table 3 it is seen that there is signiicant difference between smokers and non-smokers in relation to numbers of years of schooling, from
the observed statistic of 2 (793368.96). This
dif-ference indicates that, in general, the smoking population has less years of schooling than the non-smoking. However, the contingency
coef-Age group 14-17 18-30 31-45 46-60 61-75 76 and over Total
Table 1. Percentage distribution of smokers and non-smokers by age group and gender - Brazil, 2008-2009.
Source: IBGE12, Family Budgets Survey 2008-2009.
Male 58.0 67.9 62.0 60.6 68.3 62.4 63.5 Female 42.0 32.1 38.0 39.4 31.7 37.6 36.5 Total 1.5 21.4 34.1 30.6 10.7 2.0 100.0 Male 58.0 67.9 62.0 60.6 68.3 62.4 63.5 Female 42.0 32.1 38.0 39.4 31.7 37.6 36.5 Total 1.5 21.4 34.1 30.6 10.7 2.0 100.0 Smokers Non-smokers Condition Non-smokers Smokers Years of study Zero 1-4 5-7 8 9-11 12 or over Not determined Zero 1-4 5-7 8 9-11 12 or over Not determined
Table 2. Percentages of smoking and non-smoking population by years of schooling and age group - Brazil,
2008-2009.
e C
ole
tiv
a,
21(1):45-52,
2016
icient (C) – at 0.076 – shows a low association between the levels of study analyzed.
From the point of view of income, and also of level of schooling, the results show that the consumption of tobacco is more concentrated in the populations with lower income. According to these data, 84% of the smoking population earns in the range of one to three times the min-imum wage per capita, 8.4% have income from three to ive times the minimum wage, and 7.5% have income higher than ive times the mini-mum wage, per capita. In per capita terms, the income of smokers is R$ 867.52, statistically low-er than that of non-smoklow-ers, which is R$ 957.79,
in accordance with the t test (198.71) and F test
(49096.70).
It is found that 33.6% of the population has expenses of more than 1.51% on tobacco-derived products, while 23% of the population spends up to 0.5% of their income. Individuals from a lower income group and with lower schooling are the most susceptible to consumption and, thus, to
the ills arising from tobacco products15.
Instead of focusing on cigarettes, the most popular product, this study decided to analyze all the expenditure involved in articles related to tobacco. An average expense of 2.23% of income on these articles was found. This estimate could be caused by a wider range of products being included, since the median is 1.24% – thus, it is
very close to the results indicated by the FGV16.
Consumers spend, on average, non-updated monetary amounts of R$ 9.80 per month on these products, the values of which vary from R$ 0.10 to R$ 200.00.
The study also analyzed where these popu-lations live and found that there are signiicant
differences (χ2 = 174777.45) between smokers
and non-smokers in accordance with the re-gions where they live. The South and Southeast
had higher percentages of smokers than the oth-ers – respectively 11.2% and 10.6%. Further, the percentages for the Center-West, Northeast and North are very similar: at 8.4%, 8.7% and 8.5%, respectively. However, it is not possible to identi-fy association between the regions, since the con-tingency coeficient is very low (0.036).
The results are similar to those presented
by Barros et al.17, since the South and Southeast
show the highest percentages in comparison with the other regions.
Similar conclusions were found in the
sur-veys of the Vigitel system (Sistema de Vigilância
de Fatores de Risco e Proteção para Doenças Crôni-cas por Inquérito de Saúde – Health Inquiry Moni-toring System for Chronic Disease Risk Factors and Protection).
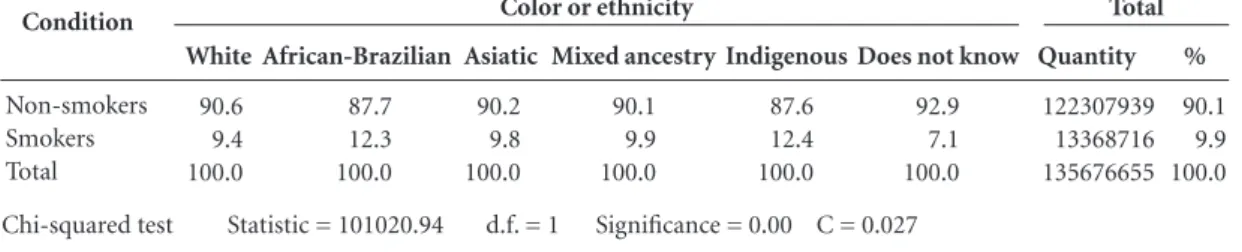
A majority proportion of the population ana-lyzed stated that themselves to be white (49.1%), followed by those who said they were of mixed ancestry (‘pardo’) (41.4%). Among the smoking population, those stating themselves to be white were 46.8%, those of mixed-ancestry 41.6%, and those of African racial identiication 10.2%. From the skin color data it is not possible to afirm that there is a signiicant differential between smokers and non-smokers.
However, as shown by Table 4, there are sig-niicant differences between the groups. The mixed-ancestry and African-Brazilian popula-tions have higher proporpopula-tions of smokers: re-spectively 12.4% and 12.3%.
Based on these data it is possible to conclude
that the χ2 test indicates that there is an
associa-tion between all the classiicaassocia-tions that refer to smokers or non-smokers in relation to the cat-egory variables (gender, color and regions of the country). However, the results obtained for the contingency coeficients (C) in general show a weak degree of association.
Condition
Non-smokers Smokers Total
Table 3. Smokers and non-smokers, by years of study and results of association tests - Brazil, 2008-2009.
Source: IBGE12, Family Budgets Survey 2008–2009. * Not determined. Zero
87.9 12.1 100.0
1 - 4
87.4 12.6 100.0
5 - 8
88.9 11.1 100.0
9 - 11
92.5 7.5 100.0
12 - 14
91.8 8.2 100.0
ND*
89.1 10.9 100.0
Years of study
15 or +
93.0 7.0 100.0
%
90.1 9.9 100.0
Total
N
122307939 13368716 135676655
B
az
Discussion and final considerations
The proile of the population that reported ex-penditure on products arising from tobacco (cigarettes, cigarillos, cigars, and others) in the POF of 2008–9 was analyzed. The sample com-prised people aged 14 or over, and the variables observed were: gender, age, racial identiication, years of schooling, geographical region, and in-come.
According to the results, 10% of the Brazilian population is smokers – which is a considerable
percentage. The statistical tests used (t test, χ2
test) for the group of data analyzed made it pos-sible to conclude that there are signiicant differ-ences between the smoking and non-smoking populations in relation to all the variables.
The individuals belonging to the lower in-come levels and of age 30-35 are the largest consumers of tobacco. Further, it was observed that the smoking population has fewer years of schooling than the non-smokers. This shows the need for investment in the creation of op-portunities for access to formal education, and increased schooling time, in Brazil, especially in primary education, since the population with a low level of schooling becomes more vulnerable to the appeal of advertising for consumption of
tobacco products18.
As Lacerda et al.19 showed, the
communi-cations media are an important link that helps in the understanding of the dynamics between human behavior, the social context and public policies, and international studies on advertising related to tobacco show that the press may have favored adoption of policies of control in some countries.
The results arising from the investigation of
Barreto et al.20, which used the National School
Children’s Health Survey (Pesquisa Nacional de
Saúde do Escolar – PeNSE), show that the prob-ability of being a regular smoker increases with age and there is a higher prevalence among peo-ple who are in public schools, have a mother with a low level of schooling, and/or state themselves to be of mixed racial ancestry.
This evidence can also orient the direction given to educational campaigns to combat this damaging habit, especially among the young population and those who are in the lower in-come groups and have less schooling, since they are the most affected. On this point, focusing
on educational actions in health and on health21
could be a promising way forward.
Although the coverage of the Brazilian health system is universal, at least in legal terms, it can show itself to be insuficient in practical terms, precisely for the lowest-income population (the irst deciles), which is the part of the population that is most dependent on the public health
sys-tem22, and which, according to Neri and Soares10,
has the worst access to the health assets, becomes ill more frequently and consumes less health services, aggravating a situation of income in-equality. Also, this population is more burdened by taxes on the consumption of these products, since they are not charges according to spending power.
The study by Cavalcante and Pinto15 on the
1995-6 POF also aimed to ind the percentage of income spent on tobacco. The authors found that the percentage spent on green vegetables was proportionately lower than the amount spent on smoking products, especially in the income group below twice the minimum wage. They also found a similar pattern when comparing these expenses with those on education and personal hygiene.
Studies by the Getúlio Vargas Foundation (FGV) show that the population’s expenditure
Condition
Non-smokers Smokers Total
Table 4. Percentage distribution of smokers and non-smokers by color or ethnicity and results of association tests -
Brazil, 2008-2009.
Source: IBGE12, Family Budgets Survey, 2008-2009. White
90.6 9.4 100.0
African-Brazilian
87.7 12.3 100.0
Asiatic
90.2 9.8 100.0
Mixed ancestry
90.1 9.9 100.0
Indigenous
87.6 12.4 100.0
Color or ethnicity
Does not know
92.9 7.1 100.0
%
90.1 9.9 100.0
Total
Quantity
122307939 13368716 135676655
e C
ole
tiv
a,
21(1):45-52,
2016
on cigarettes has been maintained in recent years and that the weighting of these expenses on con-sumers’ monthly budget is signiicant: they spend 1.20% of their average income on buying ciga-rettes, compared to 0.60% on acquiring rice and
beans16. The impact of these expenditures in
re-lation to total income also differed by age group. The portions of the smoking population that have higher income spend less, in relative terms, while they also have greater accessibility to the means for suspension of the habit.
Barros et al.17show, through the PNAD
(Na-tional Home Sampling Survey – Pesquisa
nacio-nal por amostragem de domicílios) for 2008, that daily consumption of tobacco is higher among individuals that are in the lower deciles of
in-come, and the contrary is the case for those in the highest deciles.
As well as smoking being damaging to health, the expenditure on tobacco has an effect on the domestic budget, since the income spent on these products could be diverted to serve other priori-ties and needs of the family unit, such as educa-tion, health and clothing.
The characterization of the proile of the smoking population and the non-smoking pop-ulation could contribute to formpop-ulation and im-plementation of public policies directed to the various population proiles in relation to pre-vention and overcoming of smoking habits, with policies focused on those that are most suscepti-ble to the consumption of these products.
Collaborations
B
az
Oliveira RP. Da universalização do ensino fundamental ao desaio da qualidade: uma análise histórica. Educ. Soc. 2007; 28(100):661-690.
Franco C, Alves F, Bonamino A. Qualidade do ensino fundamental: políticas, suas possibilidades, seus limi-tes. Educ. Soc. 2007; 28(100):989-1014.
Cavalcante T, Pinto M. Considerações sobre tabaco e pobreza no Brasil: consumo e produção de tabaco. In: Brasil. Ministério da Saúde (MS), Organização Pan-A-mericana da Saúde. Tabaco e Pobreza, um círculo vicio-so - A Convenção Quadro de Controle do Tabaco: uma resposta. Brasília: MS; 2004. p. 97-136.
Agência Brasil. Consumidor gasta mais com cigarros do que com arroz e feijão. [acessado 2014 dez 15]. Dis-ponível em: http://memoria.ebc.com.br/agenciabrasil/ noticia/ 2013-05-31/consumidor-gasta-mais-com-ci-garros-do-que-com-arroz-e-feijao
Barros AJD, Cascaes AM, Wehrmeister FC, Martínez-Mesa J, Menezes AMB. Tabagismo no Brasil: desigual-dades regionais e prevalência segundo características ocupacionais. Cien Saude Colet 2011; 6(9):3707-3716. Fundação Oswaldo Cruz. A fotograia da Fome. Radis
Comunicação em Saúde 2003; 8:8-9.
Lacerda AE, Mastroianni FC, Noto AR. Tabaco na mí-dia: análise de matérias jornalísticas no ano de 2006.
Cien Saude Colet 2010; 15(3):725-731.
Barreto SM, Giatti L, Casado L, De Moura L, Crespo C, Malta DC. Exposição ao tabagismo entre escolares no Brasil. Cien Saude Colet 2010; 15(Supl. 2):3027-3034. Falkenberg MB, Mendes TPL, Moraes EP, Souza EM. Educação em saúde e educação na saúde: conceitos e implicações para a saúde coletiva. Cien Saude Colet
2014; 19(3):847-852.
Mesa-Lago C. O sistema de saúde brasileiro: seu impac-to na pobreza e na desigualdade. Nueva Sociedad 2007; out:115-131.
Article submitted 21/10/2014 Approved 13/05/2015
Final version submitted 15/05/2015 13.
14.
15.
16.
17.
18. 19.
20.
21.
22. References
Brasil. Instituto Nacional de Câncer José Alencar Go-mes da Silva. A situação do tabagismo no Brasil: dados dos inquéritos do Sistema Internacional de Vigilância, da Organização Mundial da Saúde, realizados no Brasil, en-tre 2002 e 2009. Rio de Janeiro: Inca; 2011.
Instituto Nacional de Câncer, Coordenação Nacional de Controle de Tabagismo e Prevenção Primária.
Co-ordenação nacional de controle de tabagismo 1996-2001.
Brasília: Ministério da Saúde; 2002.
Mokdad AH, Marks JS, Stroup DF, Gerberding JL. Ac-tual causes of death in the United States, 2000. JAMA
2004; 291(10):1238-1245.
Iglesias R, Jha P, Pinto M, Costa-E-Silva VL, Godinho
J. Controle do tabagismo no Brasil. Washington: World
Bank; 2007. (Documento de Discussão Saúde, Nutri-ção e PopulaNutri-ção).
Eriksen M, Mackay J, Ross H. El Atlas del tabaco. 4ª ed. Atlanta, Nueva York: Sociedad Americana contra el Cáncer, Fundación Mundial del Pulmón; 2012. [aces-sado 2013 nov 10]. Disponível em: http://www.Tobac-coAtlas.org
World Health Organization (WHO). Global estimate of
the burden of disease from second-hand smoke. Geneva:
WHO; 2010.
Pinto M, Uga MA. Os custos de doenças tabaco-rela-cionadas para o Sistema Único de Saúde. Cad Saude
Publica 2010; 26(6):1234-1245.
Pinto MT, Riviere AP. Relatório Final Carga das doen-ças tabaco-relacionadas para o Brasil. Fundação Oswal-do Cruz, 2012. [acessaOswal-do 2014 ago 13]. Disponível em: http://www.actbr.org.br/uploads/conteudo/721_Rela-torio_Carga_do_tabagismo_Brasil.pdf
Silveira RLL, Dornelles M. Mercado mundial de tabaco, concentração de capital e organização espacial. Notas introdutórias para uma geograia do tabaco. Scripta Nova. Revista Electrónica de Geografía y Ciencias So-ciales. [En línea]. Barcelona: Universidad de Barcelona, 10 de octubre de 2010, vol. XIV, nº 338. [acessado 2014 nov 25]. Disponível em: http://www.ub.es/geocrit/sn/ sn-338.htm
Neri MC, Soares WL. Pobreza, Ativos e Saúde no Brasil. Rio de Janeiro: Fundação Getúlio Vargas; 2002. (En-saios Econômicos, 465)
Instituto Nacional do Câncer, Organização Pan-Ameri-cana da Saúde. Pesquisa especial de tabagismo – PETab: relatório Brasil. Rio de Janeiro: INCA; 2011
Instituto Brasileiro de Geograia e Estatística (IBGE).
Pesquisa de Orçamentos Familiares 2008-2009. Antro-pometria e estado nutricional de crianças, adolescentes e adultos no Brasil. [Internet]. Rio de Janeiro: Instituto Brasileiro de Geograia e Estatística; 2010. [2014 ago 13]. Disponível em: http://www.ibge.gov.br/home/es-tatistica/populacao/condicaodevida/pof/2008_2009_ encaa/pof_20082009_encaa.pdf
1.
2.
3.
4.
5.
6.
7.
8.
9.
10.
11.