© 2014 Dental Press Journal of Orthodontics 24 Dental Press J Orthod. 2014 May-June;19(3):24-5
Evidence-based
Orthodontics
Statistical analysis is, in fact, an error analysis. A statistical test does not guarantee reliable results, it only quantifies the probability of error of a given conclusion.1 While reading the articles of this
jour-nal, you will find a p-value. For instance, the ar-ticle by Garib et al2 describes the p-values for a
giv-en variable at two differgiv-ent momgiv-ents: this p-value,
also known as false-positive rate,1 demonstrates the
probability of error when asserting that there is a difference before and after expansion.
Every research is subjected to some degree of error, given that we are not investigating an entire population, but only a fraction, a sample. For this reason, when we compare two samples undergoing different treatment procedures with a view to identi-fying the most efficient therapy, we will always have the chance of having reached a wrong conclusion. Therefore, the lower the p-value is, the smaller the chance of error and, as a result, the more certain we are to assure that treatment “A” is more efficient than “B”.
But, how can we control a false-positive error? Initially, we have to decide on the significance level
(α) we expect to establish. In Dentistry, we usually
set a significance level not greater than 5% (α = 5%). Nevertheless, should we increase the number of comparisons of a given study, we increase the chanc-es of yielding outcomchanc-es that are due just to chance and, as a consequence, finding a false-positive result. The lottery is a good example. The chances of win-ning are little, less than 5%. However, the more we bet, the higher our chances of winning.
In statistical tests, there is a dramatic increase in false-positive rates, in which the number of com-parisons is directly proportional to the number of false-positive results, as shown in Table 1.
Thus, when we make several comparisons using a simple statistical test, we significantly increase the chances of yielding a false-positive result. Table 1 demonstrates that the chances of yielding a false-positive result are of 40% for a study involving 10 comparisons. In these cases, some adjustments are necessary to keep the significance level set at 5%. One of the procedures employed to correct false-positive rates is the Bonferroni correction. It con-sists of dividing the significance level by the number
of comparisons made in a given study.3 Suppose we
carried out a comparative analysis of five cephalo-metric variables between two groups using an in-dependent t-test. By dividing the significance level initially set at 0.05 or 5% by 5, the new level of error will be adjusted to 0.01 or 1%. Thus, differences will be considered significant for a p-value lower than or equal to 0.01. Nevertheless, Bonferroni correction
Contact address: Rafael Simas David Normando
Rua Boaventura da Silva, 567, Ap. 1201. CEP 66055-090 - Belém-PA — Brazil E-mail: [email protected] How to cite this article: Simas R, Maestri F, Normando D. Controlling false
posi-tive rates in research and its clinical implications. Dental Press J Orthod. 2014 May--June;19(3):24-5. DOI: http://dx.doi.org/10.1590/2176-9451.19.3.024-025.ebo
1 Masters student in Dentistry, Federal University of Pará.
2 Specialist in Orthodontics, Brazilian Dental Association – Southern Maranhão. 3 Professor, School of Dentistry, Federal University of Pará.
Submitted: March 05, 2014 - Revised and accepted: March 20, 2014
Controlling false positive rates in research
and its clinical implications
Rafael Simas1, Felipe Maestri2, David Normando3
Table 1. Number of comparisons (tests) and increase in false-positive rates.
# tests value FW
1 0.05 0.05
3 0.05 0.14
6 0.05 0.26
10 0.05 0.4
15 0.05 0.54
fw= 1 - (1 - pc) c
C = # of comparisons, pc stands for error type I (0.05).
© 2014 Dental Press Journal of Orthodontics 25
Simas R, Maestri F, Normando D
Dental Press J Orthod. 2014 May-June;19(3):24-5
Evidence-basedOrthodontics
results in a much more inflexible significance level than necessary, thus increasing the chances of yield-ing a false-negative rate.4
In 1995, Benjamini and Hochberg5 (BH)
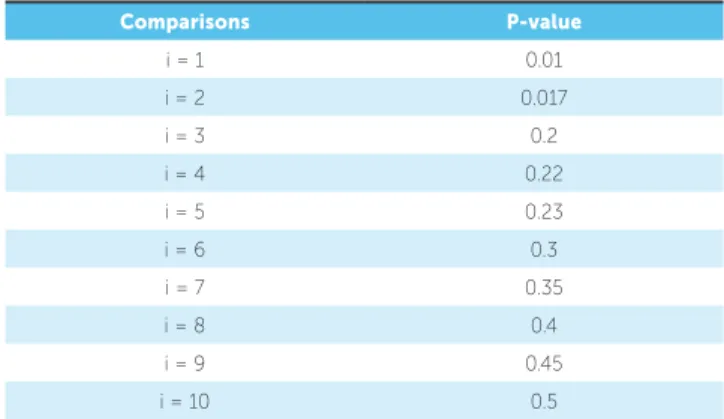
sug-gested another method to counteract false-positive rates when multiple comparisons with univariate statistical analysis are carried out. In this procedure, the researcher has to accept a minor false-positive rate and set this rate before the procedure. Suppose we compared 10 cephalometric measures between two populations A and B. After the number of com-parisons is established, we determine the p-value for each analysis and organize these values in ascend-ing order. The value of i = 1 (0.01) will be lower than the p-value, with i = 10 being the highest value. Table 2 shows the p-values in ascending order. After values are properly ranked, we apply the Benjamini-Hochberg formula: (i/m).Q (Q = false-positive ac-ceptance rate; m = total number of comparisons). This formula allows us to correct the p-value and eliminate potential false-positive rates. With a view
to obtaining the Q value, we divide the number of comparisons with P < 0.05 by the number of com-parisons with P > 0.05. Table 3 shows that after finding the Q value and applying the Benjamini-Hocheberg formula, we find the corrected p-value for each comparison (i = 1, i = 2, etc.). Subsequently, we arrange the data in a table similar to Table 3, including the initial p-value and the p-value cor-rected by means of the formula. This method allows us to determine which comparisons are significant, in which case only those with a p-value lower than
[(i/m).Q] are significant.6 Table 3 shows that
com-parisons 1 and 2 are the only ones with p-value low-er than [(i/m).Q].
In this same example, should we use Bonfer-roni correction to counteract error type I, com-parisons 1 and 2 would probably not be significant,
since α = 5% divided by the number of comparisons
(ten) would result in 0.05/10 = 0.005. This value would be lower than comparisons 1 and 2 correct-ed by the BH technique, which demonstrates how strict Bonferroni’s procedure is.
Choosing the wrong statistical test may lead cli-nicians to jump to conclusions. For instance, a given treatment may be considered the best one as a result of statistical analysis. Thus, statistical analysis is the key to reach more reliable clinical results. Employ-ing more simple statistical procedures, such as the t-test, to carry out multiple comparisons, creates the need to counteract type I error (false-positive). Therefore, it is reasonable to conclude that multiple comparisons require one to carefully choose the test as well as the corrections to be employed.
1. Normando ADC, Almeida MAO, Quintão CCA. Análise do emprego do cálculo amostral e do erro do método em pesquisas científicas publicadas na literatura ortodôntica nacional e internacional. Dental Press J Orthod. 2011;16(6):33.e1-9.
2. Garib DG, Menezes MHO, Silva Filho OG, Santos PBD. Immediate periodontal bone plate changes induced by rapid maxillary expansion in the early mixed dentition; CT findings. Dental Press J Orthod. 2014 May-June;19(3):36-43.
3. Chen JJ, Roberson PK, Schell MJ. The false discovery rate: a key concept in large-scale genetic studies. Cancer Control. 2010;17(1):58-62. 4. McDonald JH. Handbook of biological statistics. 2nd ed. Baltimore:
Sparky House; 2011. p. 256-9.
5. Benjamini Y, Hochberg Y. Controlling the false discovery rate: a practical and powerful approach to multiple testing. Journal of the Royal Statistical Society. 1995; 57(1):289-300.
REFERENCES
Table 2.
Comparisons P-value
i = 1 0.01
i = 2 0.017
i = 3 0.2
i = 4 0.22
i = 5 0.23
i = 6 0.3
i = 7 0.35
i = 8 0.4
i = 9 0.45
i = 10 0.5
Table 3.
Comparisons P-value (i/m). Q
i = 1 0.01 0.025
i = 2 0.017 0.05
i = 3 0.2 0.075
i = 4 0.22 0.1
i = 5 0.23 0.125
i = 6 0.3 0.15
i = 7 0.35 0.175
i = 8 0.4 0.2
i = 9 0.45 0.225
i = 10 0.5 0.25