FREE THEMES
1 Programa de Pós-Graduação em Saúde Coletiva, Universidade do Vale do Rio dos Sinos. Av. Unisinos 950, Cristo Rei. 93022-000 São Leopoldo RS Brasil. tissi.morimoto@ gmail.com
Hospitalization for primary care susceptible conditions, health
spending and Family Health Strategy: an analysis of trends
Abstract The goal of this study was to analyze the trend over time of hospitalizations due to condi-tions susceptible to primary healthcare (HCSPC), and how it relates to healthcare spending and Family Health Strategy (FHS) coverage in the city of São Leopoldo, Rio Grande do Sul State, Bra-zil, between 2003 and 2012. This is an ecological, time-trend study. We used secondary data avail-able in the Unified Healthcare System Hospital Data System, the Primary Care Department and Public Health Budget Data System. The analysis compared HCSPC using three-year moving aver-ages and Poisson regressions or negative binomi-als. We found no statistical significance in decreas-ing HCSPC indicators and primary care spenddecreas-ing in the period analyzed. Healthcare spending, per-capita spending and FHS coverage increased significantly, but we found no correlation with HCSPC. The results show that, despite increases in the funds invested and population covered by FHS, they are still insufficient to deliver the level of care the population requires.
Key words Quality of healthcare, Primary care,
Family health, Healthcare funding
Tissiani Morimoto 1
M
or
imot
o T
Introduction
Primary Healthcare (PHC) was designed to meet the population’s need for healthcare, as per the guidelines of the Brazilian Unified Healthcare System (SUS)1,2. Fernandes et al.3 believe that strengthening and structuring PHC is essential for organizing healthcare systems, and that pri-mary care is the main gateway into the system; 80.0% of the population’s health issues are re-solved at this level.
The Family Health Strategy (FHS) was creat-ed to strengthen PHC in Brazil and achieve the SUS objectives. The FHS was designed to be a model for primary care and facilitate access to healthcare services. FHS was conceived to be the first point of contact with healthcare services, provide comprehensive care, and coordinate with other services, providing care that is focused on family and community, overcoming inequali-ties and seeking system equality4,5.
Already there is evidence of the positive impact of FHS, such as better primary care, ex-panded universal access to healthcare, extended coverage, better intake and a stronger bond, co-ordinated services and family focus5,6. However, FHS implementation is an ongoing process5. To become the core element of healthcare transfor-mation in the country it must expand in major cities, covering a significant share of the popu-lation7,8.
Together with FHS expansion, there is also a need to continuously assess healthcare pro-grams and policies as the best way to check ef-fectiveness. This assessment enables avoiding wasting resources in ineffective programs, and helps make decisions regarding the population’s healthcare needs and demands, thus improving the solutions offered by the system3,9.
To assess the effectiveness of PHC, a num-ber of indicators of access to quality care have been proposed. One of these is known as hospi-talization for conditions susceptible to primary healthcare (HCSPC), which is a list of health problems that, if treated in a timely and suitable way, reduce the risk of hospitalization, either keeping them from arising in the first place, or as a result to proper handling in the case of chronic diseases10,11.
To make it possible to assess the quality of PHC in Brazil, the Ministry of Health prepared its own list of conditions susceptible to primary healthcare. This list has enabled studies to analyze the level of primary healthcare in Brazil, starting from the principle that high levels of HCSPC can
suggest problems of access to, or effectiveness of care11. Thus, HCSPC is an important indicator for monitoring and assessment11. Looking at how HCSPC have evolved over time can help assess the quality of the healthcare system, in particular primary care, and may show the impact of mea-sures introduced in the healthcare system, such as changes in the care model from implementing the FHS, and those arising from expanded funding.
While analyzing the healthcare system is required, it is also possible to discuss another problem that impacts SUS development – un-der-funding of healthcare in this country. Fund-ing for healthcare in Brazil is below what is re-quired to ensure universal, comprehensive, qual-ity public healthcare12. Insufficient federal funds affect the three levels of care differently. The most affected is the PHC, responsible for 20.0% of the total invested in health13,14.
Thus, this study focuses on analyzing the evo-lution in time of hospitalizations for conditions susceptible to primary healthcare, relating these to spending in healthcare and FHS coverage in the city of São Leopoldo, in the Brazilian state of Rio Grande do Sul, between 2003 and 2012.
Methods
This is an ecological time series trend study con-ducted in the city of São Leopoldo, in metropol-itan Porto Alegre, Rio Grande do Sul between 2003 and 2012.
According to the 2010 census, the population of São Leopoldo is 214,087. It belongs to the 1st Regional Health Coordination headquartered in Porto Alegre. Services provided by the City Health Department are made up of a health vig-ilance center, two specialized care services, three psychosocial care centers, six healthcare centers, nine Primary Healthcare Units, and nine FHS. The city also has a budget pharmacy and a 219-bed hospital for SUS patients.
This study used secondary data provided by DATASUS, the Unified Healthcare System IT Department, which in turn is based on SIH/SUS - the Unified Healthcare System Hospital Data System. These sources provided the number of HCSPC and all-cause hospitalizations (excluding obstetrics) in the resident population. We used the national list of hospitalizations for conditions susceptible to primary healthcare, as per Minis-try of Health Directive 221 of 17 April 200811.
e C ole tiv a, 22(3):891-900, 2017
Statistics. Annual population covered by the FHS was taken from data provided by the Ministry of Health Basic Healthcare Department (BHD).
Financial data was taken from the Summary Budget Reports issued by the city and available on SIPS, the Public Health Budget Data Sys-tem. We used total healthcare and total primary healthcare spending data. Per-capita healthcare spending and primary care as a percent of the to-tal were calculated. A deflator was used to elim-inate or minimize the influence of inflation on prices15,16. Values were adjusted using the IPCA (Ample Consumer Price Index) published by the IBGE. This is the official indicator used by the Federal Government to measure inflation.
HCSPC and all-cause hospitalization data was generated and tabulated using DATASUS’ TabWin® program. We later exported this data to Microsoft Excel® spreadsheets to calculate in-dicators, along with data on total healthcare and primary care spending, the number of FHS and their percent coverage.
The gross HCSPC per 1,000 inhabitants in the city of São Leopoldo was calculated, along with gross all-cause (excluding obstetrics) hospi-talization indicators per 1,000 inhabitants. Later, to eliminate the influence of differences due to age, the indicators were standardized17 using the population of the State of Rio Grande do Sul in 2010 as a reference. To eliminate fluctuations in annual trends, we used a three-year moving aver-age to smooth out the series and minimize ran-dom variations18.
The data was then transferred to Stata® 11.2 for statistical analysis. Initially a trend analy-sis was performed using a Poisson regression, where HCSPC, all-cause hospitalizations, total healthcare spending, FHS spending, per-capita spending and FHS coverage were the dependent variables, and the year the independent variable. We tested for over-dispersion using the poisgof command. If the result of this command was significant we proceeded with a negative bino-mial regression. The results were expressed as the mean ratios and 95% confidence intervals, and the results of the Wald test19.
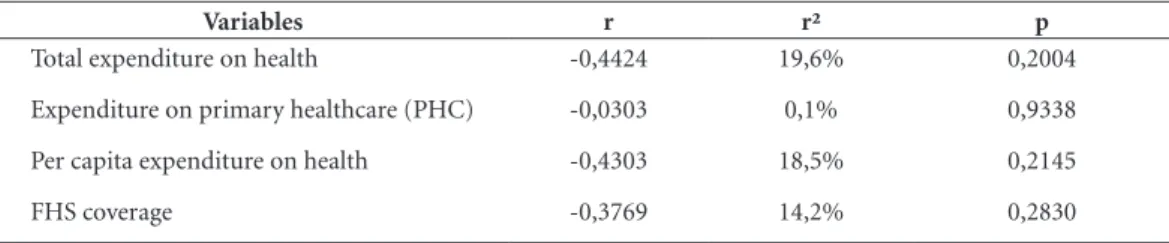
We ran a Spearman correlation to test the as-sociation between HCSPC and total healthcare spending, primary healthcare spending, per-cap-ita healthcare spending and FHS coverage, with values over 0.50 and < 0.05 being considered sig-nificant20.
The research project was approved by the Vale do Rio dos Sinos University (UNISINOS) Research Ethics Committee.
Results
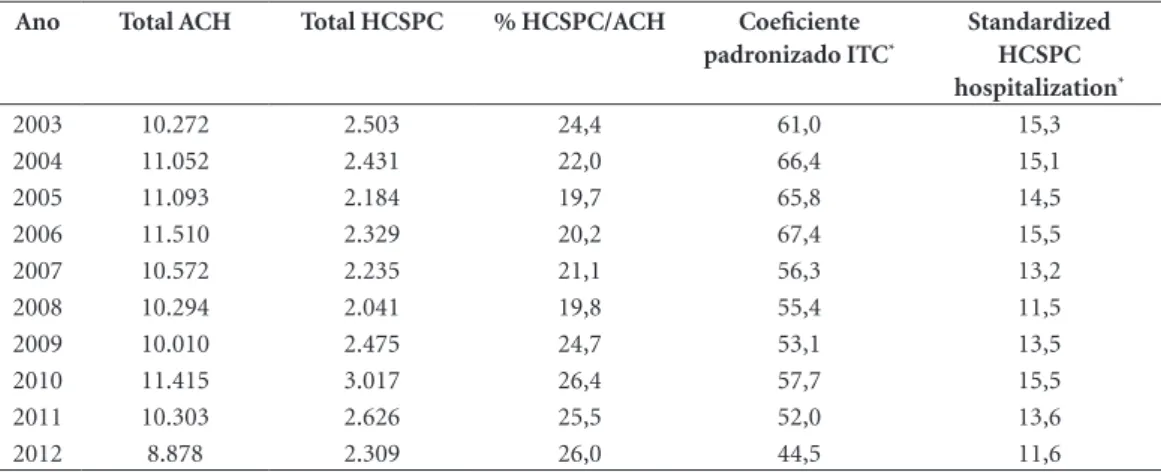
Looking at the number of all-cause hospitaliza-tions in São Leopoldo, we find a 13.6% reduction in the period, going from 10,272 hospitalizations in 2003 to 8,878 in 2012. The HCSPC indicator dropped 7.8%, from 2,503 in 2003 to 2,309 in 2012 (Table 1).
Regarding standardized indicators of all-cause hospitalizations, the largest was in 2006, with 67.4 hospitalizations per 1,000 inhabi-tants, and the smallest in 2012, with 44.5/1,000, a 34.0% drop. The highest incidence of HCSPC was also in 2006, or 15.5/1,000, and the smallest (11.5/1,000) in 2008, a 25.9% drop. HCSPC as a percent of all-cause hospitalization increased 6.7% in the period. In other words, in 2003 con-ditions susceptible to primary healthcare ac-counted for 24.4% of all-cause hospitalizations, and in 2012 for 26.0% (Table 1).
The three-year moving averages also show a trend in all-cause hospitalizations and enables comparing hospitalization behavior. The only decrease was in all-cause hospitalization (Graphic 1).
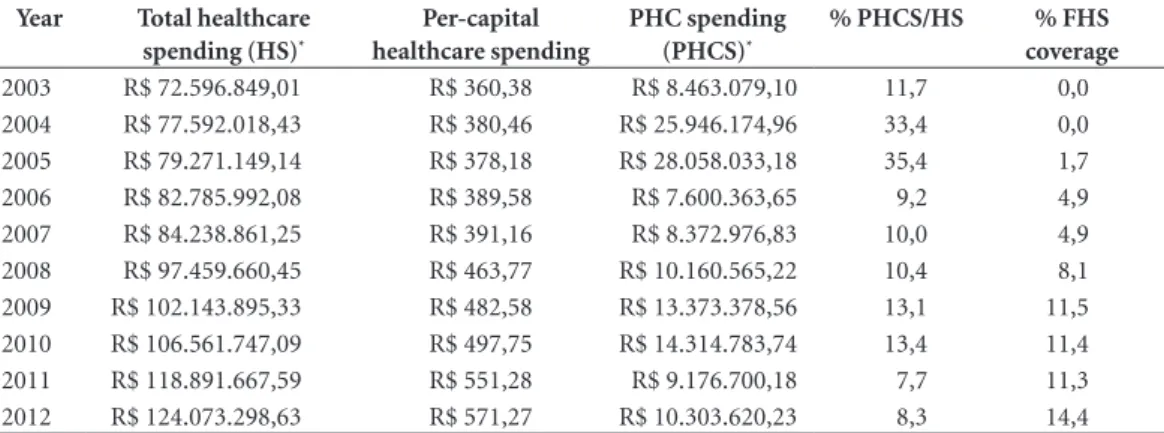
Total healthcare spending increased grad-ually, from R$ 72,596,849.01 in 2003 to R$ 124,073,298.63 in 2012, a 70.9% variation. Per-capita healthcare spending also increased, from R$ 260.38 in 2003 to R$ 571.27 in 2012, a 58.5% difference (Table 2).
Data on FHS spending varied significantly and no clear trend was found. The lowest amount was spent in 2006 (R$ 7,600,363.65) and the larg-est 2005 (R$ 28,058,033.18). Comparing 2003 (R$ 8,463,079.10) and 2012 (10,303,620.23), we find a 21.8% increase. FHS as a percent total healthcare spending also shows no trend over this period, ranging from a high of 35.4% in 2005 to a low of 7.7% in 2011. This percentage dropped to 11.7% in 2003 and 8.3% in 2012 (Table 2).
Regarding percent FHS coverage, in 2005 1.7% of the population was covered, increasing to 14.5% in 2012 (Table 2).
Results of the regression analysis shows no statistically significant change in the HCSPC indicator or FHS spending over the period an-alyzed. On the other hand, all-cause hospital-izations dropped, while total healthcare and per-capita spending increased significantly, as did FHS coverage (Table 3).
M
or
imot
o T
FHS coverage decreased HCSPC indicators. No statistically significant association was found (Table 4).
Discussion
This study found no trend towards decreasing HCSPC in the city of São Leopoldo between 2003 and 2012.
The strategy used to analyze the trends in in-dicator behaviors was based on comparing HC-SPC and all-cause hospitalizations when creating
three-year moving averages and in the Poisson or negative binomial regression. Results show no decrease in HCSPC, which was confirmed by the behavior of the moving averages and the absence of any statistical significance in the Poisson re-gression.
Numerous studies have signaled a decrease in HCSPC in different parts of Brazil21-23, often related to expanding FHS3,4,24-27. The goal of this study was to bring these results to light. In the period analyzed, HCSPC as a percent all-cause hospitalizations increased 3.7%, showing that HCSPC dropped less than all-cause
hospitaliza-Table 1. All-cause hospitalizations (ACH) and Hospitalizations for Conditions Susceptible to Primary Healthcare (HCSPC). São Leopoldo, 2003-2012.
Ano Total ACH Total HCSPC % HCSPC/ACH Coeficiente padronizado ITC*
Standardized HCSPC hospitalization*
2003 10.272 2.503 24,4 61,0 15,3
2004 11.052 2.431 22,0 66,4 15,1
2005 11.093 2.184 19,7 65,8 14,5
2006 11.510 2.329 20,2 67,4 15,5
2007 10.572 2.235 21,1 56,3 13,2
2008 10.294 2.041 19,8 55,4 11,5
2009 10.010 2.475 24,7 53,1 13,5
2010 11.415 3.017 26,4 57,7 15,5
2011 10.303 2.626 25,5 52,0 13,6
2012 8.878 2.309 26,0 44,5 11,6
*per 1,000 inhabitants.
Graph 1. Moving three-year averages for all-cause hospitalization and hospitalizations due to conditions susceptible to primary care (HCSPC). São Leopoldo, 2003-2012.
2003 2004 2005 2006 2007 2008
HCSPC All-cause hospitalizations
P
er 1000 inhabitans
2009 2010 2011 2012 2013 70
60
20 30 40
e C
ole
tiv
a,
22(3):891-900,
2017
tions. Furthermore, the Poisson regression shows that the decrease in all-cause hospitalization was statistically significant while the decrease in HC-SPC in the city was not.
Alfradique et al.11 found similar results, with HCSPC accounting for 28.3% of all SUS hospi-talizations in 2006. However, between 2000 and 2006 HCSPC dropped 15.8% across the coun-try, a larger decrease than in hospitalizations not susceptible to primary healthcare. An ecological study in Belo Horizonte conducted by Mendonça et al.22 found 26.4% HCSPC. Over the four-year period analyzed, HCSPC dropped 17.9%, com-pared to 8.3% for non-susceptible hospitaliza-tions. Following standardization, we found that HCSPC indicators dropped 15.6% in the period.
Junqueira and Duarte28 found an HCSPC indicator of 121.0 per 10 thousand inhabitants, accounting for 19.5% of all hospitalizations
in the Federal District in 2008. Numbers close to this were found in a study by Campos and Theme-Filha25 in Campo Grande, Mato Grosso do Sul, between 2000 and 2009. Those authors found an indicator of 132.1 per 10 thousand in-habitants (19.0%) in 2000, dropping to 55.1 per 10 thousand inhabitants (10.2%) in 2009.
While studies in other Brazilian locations also show a decline in HCSPC, São Leopoldo went against this trend. Thus, a further analysis of the factors associated with these unfavorable results is required.
FHS coverage of the population has expand-ed across the country, but unevenly when we compare regions, major urban centers and small and mid-sized cities and towns. We found limit-ed FHS coverage in state capitals and cities with more than 100 thousand inhabitants7,8,29. 2012 data available on BHD show 54.8% coverage in
Table 2. Total annual healthcare spending, per capita spending on healthcare, spending on primary healthcare (PHC), healthcare spending as a percent of total, and population covered by Family Health Strategy (FHS). São Leopoldo, 2003-2012.
Year Total healthcare spending (HS)*
Per-capital healthcare spending
PHC spending (PHCS)*
% PHCS/HS % FHS coverage
2003 R$ 72.596.849,01 R$ 360,38 R$ 8.463.079,10 11,7 0,0 2004 R$ 77.592.018,43 R$ 380,46 R$ 25.946.174,96 33,4 0,0 2005 R$ 79.271.149,14 R$ 378,18 R$ 28.058.033,18 35,4 1,7 2006 R$ 82.785.992,08 R$ 389,58 R$ 7.600.363,65 9,2 4,9 2007 R$ 84.238.861,25 R$ 391,16 R$ 8.372.976,83 10,0 4,9 2008 R$ 97.459.660,45 R$ 463,77 R$ 10.160.565,22 10,4 8,1 2009 R$ 102.143.895,33 R$ 482,58 R$ 13.373.378,56 13,1 11,5 2010 R$ 106.561.747,09 R$ 497,75 R$ 14.314.783,74 13,4 11,4 2011 R$ 118.891.667,59 R$ 551,28 R$ 9.176.700,18 7,7 11,3 2012 R$ 124.073.298,63 R$ 571,27 R$ 10.303.620,23 8,3 14,4
*Adjusted using the ample Consumer Price Index (IPCA) through 2012.
Table 3. Ratio of the mean coefficients for hospitalization for conditions susceptible to primary care (HCSPC), all-cause hospitalizations, total healthcare spending, primary healthcare (PHC) spending, per capita spending and FHS coverage by year. São Leopoldo, 2003-2012.
Variables Mean ratio 95% CI p
HCSPC 0,98 0,92 a 1,04 0,4858*
All-cause hospitalization 0,97 0,94 a 0,99 0,0157*
Total healthcare spending 1,06 1,06 a 1,07 <0,001#
PHC spending 0,93 0,85 a 1,02 0,1600#
Per capita spending 1,06 1,05 a 1,07 <0,001*
FHS coverage 1,32 1,20 a 1,46 <0,001*
M
or
imot
o T
Brazil. A region by region analysis shows that FHS coverage is greatest in the northeast (72.6%), and lowest in the southeast (44.2%).
Differences in coverage are also found be-tween municipalities in the same region. Look-ing at 2012 BHD data for the southern region, we find 40.3% coverage in Rio Grande do Sul, 57.6% in Paraná and 70.0% in Santa Catarina. Rio Grande do Sul had the third lowest coverage in the country, behind São Paulo (30.7%) and the Federal District (17.6%).
Studies show that HCSPC goes down with expanding FHS coverage, in areas with coverage larger than São Leopoldo. In a study conducted in Campo Grande, Campos and Theme-Filha25 found an inverse relationship between FHS cov-erage and HCSPC indicators, with 26.6% pop-ulation coverage. In a study in Belo Horizonte, Mendonça et al.22 found 74.5% FHS coverage and a significant drop in HCSPC.
Although FHS coverage in São Leopoldo increased quite a bit over the period analyzed, reaching 14.4% of the population, this is still well below the numbers recommended by the Ministry of Health. The target coverage for cities with 100 to 500 thousand inhabitants is 60.0% for consolidation of PROESF, the Program to Expand and Consolidate Family Health30. Using the same criterion of population covered by FHS, locations with less than 30.0% coverage can be classified as incipient31,32.
The negative results found in this study may indicate problems of access or effectiveness of the local healthcare system11. It is known that health-care service structure and performance are close-ly linked33. As seen before, São Leopoldo has only nine FHS for an estimated 226,988 inhabitants. Clearly a service structure such as this is unable to meet the PHC demand of the population,
placing a greater burden on tertiary care, which may be a reason for high HCSPC.
Another important point to consider is how healthcare is funded. Ensured access to health-care services assumes that not only the physical hurdles will be removed, enabling the required services on time and in suitable locations, but also sufficient funds to ensure the supply of ser-vices33.
We found a significant increase in total health-care spending in São Leopoldo, however this was not related to any decrease in HCSPC. Using the Brazilian Central Bank US Dollar exchange rate for each year, per-capita spending went from US$ 124.77 in 2003 to US$ 279.64 in 2012. This is still far below the nation’s per-capita spending, which in 2013 was US$ 474.00. Compared to other countries in Latin America, the gap is even larg-er. For example, per-capital healthcare spending is US$ 562.00 in Chile, US$ 851.00 in Argentina and US$ 740.00 in Uruguay34. This clearly un-derscores that there is insufficient funding for healthcare in Brazil, and especially in the city of São Leopoldo.
In terms of FHS spending in São Leopoldo, values fluctuate significantly, especially in 2004 and 2005, immediately following PROESF, when 33.4% and 35.4% of healthcare funds were in-vested in FHS. In 2013 Federal funds accounted for 21.0% of the total spent. Spending in São Leopoldo was below the country average across the entire period, except for 2004 and 2005. If we compare the start and end of the period an-alyzed, we found a decrease in FHS as a percent total healthcare spending.
Historically not enough is spent on health-care, however the differences in level of care are felt much more in primary healthcare. Data for 1995 shows that the Ministry of Health spent 5.4
Variables r r² p
Total expenditure on health -0,4424 19,6% 0,2004
Expenditure on primary healthcare (PHC) -0,0303 0,1% 0,9338
Per capita expenditure on health -0,4303 18,5% 0,2145
FHS coverage -0,3769 14,2% 0,2830
e C
ole
tiv
a,
22(3):891-900,
2017
times as much on secondary and tertiary care than it did on primary care. Despite the increase in FHS funding in recent years, it is still not enough to properly develop the system, given the characteristics of different regions with different types of care13,14.
According to Mendes34, FHS centered health-care systems perform better, for example by low-ering costs, improving equality, increased access to preventive services and a reduction in urgent care. In Brazil 21.0% of the funds are spent on FHS, which handles 80.0% of the demand for healthcare14.
This study found no trend to decreasing HC-SPC, nor any association between lower HCSPC and total healthcare and FHS spending, per-capi-ta spending or FHS population coverage.
Hospitalization depends on a number of fac-tors, such as morbidity, socioeconomics, individ-ual factors and external, structural determinants. Among these we point out to the availability of beds and user link to healthcare services. While in theory the number of beds available is part of the data published by the National Record of Health-care Establishments, the numbers are unreliable and often vary according to individual hospital needs and arrangements. Furthermore, São Leo-poldo, like the majority of cities in Brazil, has no formal regionalization mechanism to clearly link inhabitants and a given system gateway. Thus,
individual information on preferred use of the healthcare system could improve the set of analy-sis and pinpoint exactly where the user entered the system. For this reason, we recommend further studies to deepen the discussion and analyze the impact of this indicator on improving the health-care system, bearing in mind individual factors.
Ecological studies that analyze historical trends have limitations, such as the fact that ag-gregate analyses do not control confusion factors, and problems resulting from the quality of the data sources, along with under-notifying and classification errors. The analysis in this study used a number of measures to attempt to min-imize these limitations, such as smoothing and standardizing indicators.
M
or
imot
o T
Collaborations
e C ole tiv a, 22(3):891-900, 2017 References
1. Brasil. Conselho Nacional de Secretários de Saúde (CONASS). Atenção Primária e Promoção da Saúde. Brasília: CONASS; 2011.
2. Starfield B. Is primary care essential? Lancet 1994; 344(8930):1129-1133.
3. Fernandes VBL, Caldeira AP, Faria AA, Rodrigues Neto JF. Internações sensíveis na atenção primária como in-dicador de avaliação da Estratégia Saúde da Família.
Rev Saúde Publ 2009; 43(6):928-936.
4. Macinko J, Oliveira VB, Turci MA, Guanais FC, Bonolo PF, Lima-Costa MF. The influence of primary care and hospital supply on ambulatory care-sensitive hospital-izations among adults in Brazil, 1999-2007. Am J Public
Health 2011; 101(10):1963-1970.
5. Silva LA, Casotti CA, Chaves SCL. A produção cientí-fica brasileira sobre a Estratégia Saúde da Família e a mudança no modelo de atenção. Cien Saude Colet
2013; 18(1):221-232.
6. Elias PE, Ferreira CW, Alves MCG, Cohn A, Kishima V, Escrivão Junior A, Gomes A, Bousquat A. Atenção Básica em Saúde: comparação entre PSF e UBS por estrato de exclusão social no município de São Paulo.
Cien Saude Colet 2006; 11(3):633-641.
7. Caetano R, Dain S. O programa de saúde da família e a reestruturação da atenção básica nos Grandes Centros Urbanos: Velhos Problemas, Novos Desafios. Physis
2002; 12(1):11-21.
8. Campos FE, Aguiar RAT, Oliveira VB. O desafio da ex-pansão do Programa de Saúde da Família nas grandes capitais brasileiras. Physis 2002; 12(1):47-58.
9. Vaughan R. Evaluation and Public Health. Am J Public
Health 2004; 94(3):360.
10. Shi L, Samuels ME, Pease M, Bailey WP, Corley EH. Pa-tient characteristics associated with hospitalizations for ambulatory care sensitive conditions in South Caro-lina. South Med J 1999; 92(10):989-998.
11. Alfradique ME, Bonolo PF, Dourado I, Lima-Costa MF, Macinko J, Mendonça CS, Oliveira VB, Sampaio LFR, De Simoni C, Turci MA. Internações por condições sensíveis à atenção primária: a construção da lista bra-sileira como ferramenta para medir o desempenho do sistema de saúde (Projeto ICSAP – Brasil). Cad Saude
Publica 2009; 25(6):1337-1349.
12. Mendes A. A longa batalha pelo financiamento do SUS.
Saúde Soc 2013; 22(4):987-990.
13. Santos NR. SUS, política pública de Estado: seu desen-volvimento instituído e instituinte e a busca de saídas.
Cien Saude Colet 2013; 18(1):273-280.
14. Capucci P. Financiamento para atenção básica à saúde no Brasil: avanços e desafios. J Manag Prim Heal Care
2014; 5(1):127-128.
15. Machado CV, Lima LD, Andrade CLT. Federal funding of health policy in Brazil: trends and challenges. Cad
Saude Publica 2014; 30(1):187-200.
16. Soares A. Formação e desafios do sistema de saúde no Brasil: uma análise de investimentos realizados para ampliação da oferta de serviços. Cad Saude Publica
2007; 23(7):1565-1572.
17. Lilienfeld AM, Lilienfeld DE. Foundations of epidemi-ology. 2nd ed. New York: Oxford University Press; 1980.
18. Latorre MRDO, Cardoso MRA. Análise de séries temporais em epidemiologia: uma introdução sobre os aspectos metodológicos. Rev bras epidemiol 2001; 4(3):145-152.
19. Rosenberg D. Trend analysis and interpretation. Key concepts and methods for maternal and child health professionals. Rockville: Division of Science, Education and Analysis; 1997.
20. Chen PY, Popovich PM. Correlation: Parametric and
Nonparametric Measures. Thousand Oaks: Sage
Publi-cation; 2002.
21. Boing AF, Vicenzi RB, Magajewski F, Boing AC, Moret-ti-Pires RO, Peres KG, Lindner SR, Peres MA. Redução das Internações por Condições Sensíveis à Atenção Primária no Brasil entre 1998-2009. Rev Saude Publica
2012; 46(2):359-366.
22. Mendonça CS, Harzheim E, Duncan BB, Nunes LN, Leyh W. Trends in hospitalizations for primary care sensitive conditions following the implementation of Family Health Teams in Belo Horizonte, Brazil. Health
Policy Plan 2012; 27(4):348-355.
23. Pazó RG, Frauches DDO, Galvêas DP, Stefenoni AV, Cavalcante ELB, Pereira-Silva FH. Internações por condições sensíveis à atenção primária no Espírito San-to: estudo ecológico descritivo no período 2005-2009.
Epidemiol Serv Saúde 2012; 21(2):275-282.
24. Rehem TCMSB, Egry EY. Internações por Condições Sensíveis à Atenção Primária no Estado de São Paulo.
Cien Saude Colet 2011; 16(12):4755-4766.
25. Campos AZ, Theme-Filha MM. Internações por condições sensíveis à atenção primária em Campo Grande, Mato Grosso do Sul, Brasil, 2000 a 2009. Cad
Saude Publica 2012; 28(5):845-855.
26. Torres RL, Rehem TCMSB, Egry EY, Ciosak SI. O panorama das internações por condições sensíveis à Atenção Primária em um distrito de São Paulo. Rev Esc
Enferm USP 2011; 45(Esp. 2):1661-1666.
27. Ferreira M, Dias BM, Mishima SM. Internações por condições sensíveis: possibilidade de avaliação na atenção básica. Rev Eletr Enf 2012; 14(4):760-770. 28. Junqueira RMP, Duarte EC. Internações hospitalares
por causas sensíveis à atenção primária no Distrito Federal, 2008. Rev Saude Publica 2012; 46(5):761-768. 29. Souza MF, Hamann EM. Programa Saúde da Família
no Brasil: uma agenda incompleta? Cien Saude Colet
2009; 14(Supl. 1):1325-1335.
30. Figueiró AC, Hartz ZMA, Thuler LCS, Dias AL. Me-ta-evaluation of baseline studies of the Brazilian Fam-ily Health Strategy Expansion Project: a participatory and formative approach. Cad Saude Publica 2010; 26(12):2270-2278.
31. Carvalho SC, Mota E, Dourado I, Aquino R, Teles C, Medina MG. Hospitalizations of children due to pri-mary health care sensitive conditions in Pernambu-co State , Northeast Brazil. Cad Saude Publica 2015; 31(4):744-754.
M
or
imot
o T
33. Viacava F, Ugá MAD, Porto S, Laguardia J, Moreira RS. Avaliação de Desempenho de Sistemas de Saúde: um modelo de análise. Cien Saude Colet 2012; 17(4):921-934.
34. Mendes EV. 25 anos do Sistema Único de Saúde: resul-tados e desafios. Estud av 2013; 27(78):27-34.
Article submitted 15/Jun/2016 Approved 25/Nov/2016