DOI: 10.1590/0004-282X20130213
ARTICLE
The FAS fluency test in Brazilian children and
teenagers: executive demands and the effects
of age and gender
Teste de fluência FAS em crianças e adolescentes brasileiros: demandas executivas
e efeitos de idade e gênero
Natália Martins Dias1, Alessandra Gotuzo Seabra2
1 Psychologist, PhD in Developmental Disorders. Invited Professor of Lato Sensu Post-graduation, Universidade Presbiteriana Mackenzie, Sao Paulo SP, Brazil. Post-doctoral student;
2 Psychologist, PhD in Experimental Psychology, São Paulo University. Professor of the Developmental Disorders Program, Universidade Presbiteriana Mackenzie, Sao Paulo SP, Brazil.
Correspondence: Natália Martins Dias; Est. Municipal Nemésio Dário dos Santos s/n / Cx. Postal: 45 / Moenda; 13252-755 Itatiba SP - Brasil; E-mail: [email protected]
Support: This work was inanced in part by the Fundo de Pesquisa do Mackenzie - MackPesquisa, FAPESP and CNPq.
Conflict of interest: There is no conlict of interest.
ABSTRACT
The FAS Verbal Fluency Test is widely used in neuropsychological clinical services and research. This study investigated the contributions of different executive functions, age and gender to FAS test performance in a sample of children and teenagers divided into two groups: G1 comprised 263 children aged 6-10 years, and G2 comprised 150 teenagers aged 10-14 years. All participants were assessed using the Can-cellation Attention Test, the Auditory Working Memory Test, the Visual Working Memory Test, the Semantic Generation Test, and the Trail Ma-king Test, in addition to the FAS test. For G1, age, auditory worMa-king memory and shifting were predictors of FAS performance. For G2, gender, auditory working memory, shifting and inhibition comprised the FAS explanatory model. The study contributed to our understanding of which are the best predictor variables for the FAS test in a Brazilian sample and how executive demands change with age.
Keywords: executive function, neuropsychological tests, child development.
RESUMO
O Teste de Fluência Verbal FAS é amplamente utilizado na clínica e na pesquisa em neuropsicologia. O estudo investigou a contribuição de diferentes funções executivas (FE), idade e gênero para o desempenho no FAS em crianças e adolescentes, divididos em dois grupos: G1, 263 crianças, idade entre 6 e 10 anos, e G2, 150 adolescentes, idade entre 10 e 14 anos. Os participantes foram avaliados com o Teste de Atenção por Cancelamento, Teste de Memória de Trabalho Auditiva, Teste de Memória de Trabalho Visual, Teste de Geração Semântica e Teste de Trilhas, além do FAS. Para G1, idade, memória de trabalho auditiva e alternância foram preditores do desempenho no FAS. Para G2, gênero, memória de trabalho auditiva, alternância e inibição compuseram o modelo explicativo. O estudo contribuiu para compreender quais são as melhores variáveis preditoras do FAS em uma amostra brasileira e como as demandas executivas mudam com a progressão da idade.
Palavras-chave: função executiva, testes neuropsicológicos, desenvolvimento infantil.
Verbal luency tests, such as the Controlled Oral Word Association Test (COWAT), are among the ive most used executive function (EF) assessment instruments in North America1
. hey have also been largely used and researched in Brazil2-7
. hese tests are designed to assess verbal luency, which is one aspect of luency ability, and are related to the capacity to execute behaviors rapidly, sequentially, and in ac
-cordance with certain rules3, 8. Verbal luency can be assessed
by semantic and letter/phonemic paradigms in which the most commonly used letters are F-A-S9-11.
he FAS Verbal Fluency Test (FAS), like others based on the luency paradigm, is considered to be a complex task be
functional ways3, 8, 12. In this sense, we can hypothesize that
verbal luency tests involve: maintaining and constantly up
-dating working memory, picking the right stimulus or rule to guide the production of behaviors, inhibiting incorrect or al
-ready given answers, leveraging enough lexibility to generate new answers and to not reproduce the same behavior pat
-terns, and continuously monitoring this production. Despite these assumptions and the already known relationship bet-ween EF and the FAS, the test is widely used in neuropsycho
-logical research and clinical applications, frequently without a clear understanding of what it actually measures.
Some studies can help to shed light on this subject. First, cognitive13, 14 and neuroimaging11
studies ofer evidence that semantic and phonemic luency15
tasks present diferential and speciic demands for their solutions. Second, particu
-larly relevant for phonemic luency tests, FAS performance in healthy elderly individualshas been related to verbal intel
-ligence, speed, lexibility and semantic memory16
. In adults, some evidence also suggests that switching, which involves a signiicant degree of inhibition and lexibility, is involved in phonemic luency14, as well as the auditory subsystem of
working memory13
. hus, the literature emphasizes that pho
-nemic luency tests can be inluenced by various cognitive processes, such as intelligence, working memory, lexibility, vocabulary, attention, inhibitory control and self-monito-ring3, 8. Furthermore, other factors can also inluence verbal
luency performance: for example, performance is sensitive to age and education8, 17, and some studies also suggest a gen
-der efect, although these results have been inconsistent8, 16, 17.
Another important issue that should be considered when analyzing the demands of phonemic luency tests is a deve-lopmental one, because the demands may difer depending on the age of the individual being assessed. In a sample of individuals aged 6-15 years, Tallberg et al.11
found signiicant positive associations between age and a) the number of cor
-rect answers, b) the efective use of phonological or seman
-tic switching, and c) clustering strategies. Also, Hurks18 found
that an instruction in semantic clustering could impact ver
-bal luency performance in the older children in her sample, but not in the younger children, for whom the implementa
-tion of the new strategy appeared to be diicult. his result suggests a relationship between age and the strategy used to solve the task.
Improvement across age in phonemic luency test perfor
-mance may be due, at least partially, to the development of EFs, because evidence suggests that EFs develop throughout childhood and adolescence until early adulthood. hus, EFs can contribute in diferent ways to phonemic luency tasks to the extent that EFs themselves develop. Moreover, evidence also supports the notion that diferent executive abilities de
-velop in diferent ways4,19,20, and that the interrelationships
between EFs appear to change throughout the developmen
-tal process in a way that suggests that these abilities are more
interdependent in children and become more diferentiated in early adolescence21
In other words, whereas in children the associations between EFs tend to be higher, in older children and teenagers these relationships are only low to moderate. Hence, in childhood and adolescence, EFs can be immature; during such stages, the partial contribution of each process in generating FAS solutions can be distinct from that ob
-served in adults.
In this sense, the objective of this study was to investi
-gate the relative contributions of EFs to FAS performance using a sample of children and teenagers (Group 1, chil
-dren from grades 1-4; Group 2, teenagers from grades 5-8). We also considered age and gender efects on performance and predicted that diferential abilities could contribute to FAS performance in each group, relecting changes in solu
-tion stra tegies as a result of EF development. he study can contribute to our understanding of what is being measured by the FAS and how task demands on EFs change with age.
METHODS
Participants
Initially, we tested 495 children and teenagers aged 6-16 years recruited at two public schools in the state of Sao Paulo, Brazil. Owing to discrepancies between age and school grade, we excluded participants who had either repeated grades or had started school late relative to their peers. As a result, 413 children and teenagers aged 6-14 years (mean [M]=9.74; stan
-dard deviation [SD]=2.40) who attended grades 1-8 of two
public elementary schools comprised the inal sample. Although no formal testing was performed to rule out in
-tellectual disability beyond screening for discrepancies bet-ween age and school grade (grade retention), no students with mental disabilities or non-corrected sensory disorders were included in the sample, as assessed by records and in
-formation provided by the teachers of the participants and students’ handbooks, information that is used in eventual referrals to the specialized educational services for students who have some disability.
To analyze the diferent contributions of EFs, age and gender as a function of participants’ developmental stage, we divided them into two groups: Group 1 comprised chil
-dren from grades 1-4 and Group 2 comprised teenagers from grades 5-8. his division by school grade was justiied for some studies in a review by Strauss et al.10, in which
edu-cation accounted for more variance than did age with res-pect to luency task performance. Group 1 comprised 263 children aged 6-10 years (M=8.21; SD=1.26), 127 (48.3%) of
whom were male. Group 2 comprised 150 teenagers aged 10-14 years (M=12.43; SD=1.29), 63 (42.0%) of whom were
Instruments
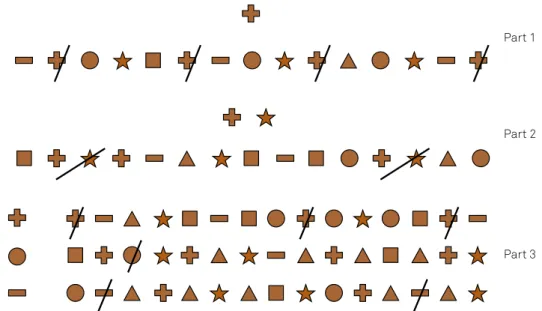
Cancellation Attention Test (CAtT)22
. he CAtT assesses selective attention (Parts 1 and 2) and selective attention and shifting (Part 3) in a test of visual searching. he test consists of three matrices with a target and 300 stimuli (geometric shapes) in each matrix. Similar to classic cancellation para
-digms, the participant identiies and marks stimuli that are similar to the target. Each matrix has a ixed time of 1 min. he total number of correct answers in each part of the test was used as the score (Figure 1).
Auditory Working Memory Test (AWMT)23
. he AWMT is a computerized test that evaluates auditory working
memory (AWM). he software emits digitized voice sequen-ces that consist of 2-10 words and numbers. he task is, irst, to repeat the words in the sequence and, then, to repeat the numbers in increasing order. For example, if the stimulus is “three - bird - one - rain,” then the correct response is “bird - rain - one - three.” he score is based on the number of correct sequences supplied.
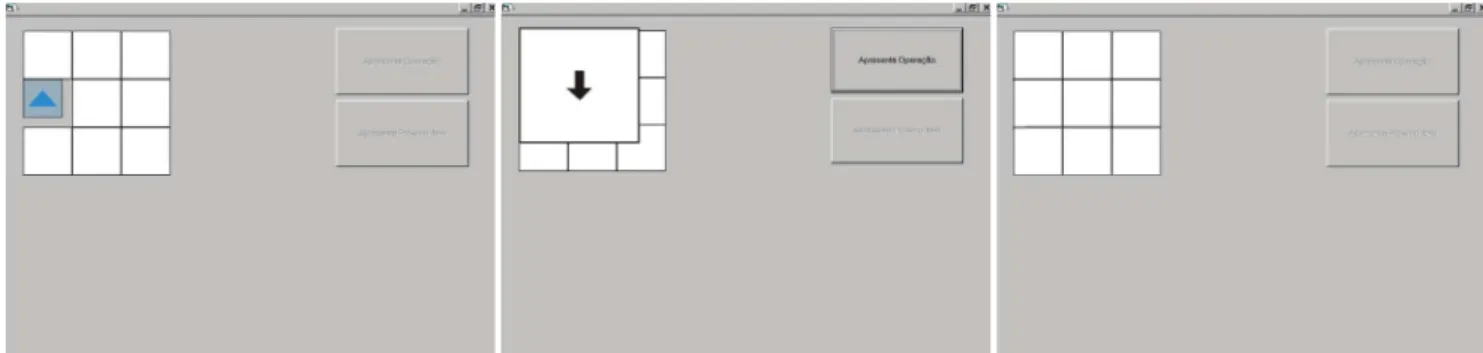
Visual Working Memory Test (VWMT)23
. he VWMT is a computerized test that assesses visual working memory. On a computer screen, one 3x3 matrix is shown which contains a stimulus in a single cell. Spatial manipulations, re presented by arrows that indicate the direction of each move, are then shown on the screen. he participant has to imagine the stimulus moving across the matrix and select its inal posi
-tion. he task increases in diiculty until four matrices are shown on the same screen. he score is the number of cor
-rect answers supplied (Figure 2).
Trail Making Test (TMT)24. he TMT assesses cognitive
lexibility. We used the Brazilian adaptation25
. he task com
-prises items (letters and numbers) that must be alternately connected in sequence over a 1-minute period. he score is the number of sequences supplied (i.e., the number of items connected correctly) in each part (A and B).
Semantic Generation Test (SeGeT)26
. he SeGeT is a com
-puterized test that measures inhibitory control (IC)27 . he subject is asked to name an action that is semantically as
-sociated with drawings (nouns) that appear on a computer screen. he nouns can be low-selection (60 items), meaning that they evoke just one word (e.g., scissors is usually asso
-ciated with the verb cut), or they can be high-selection (60 items), meaning that they can evoke a list of words (e.g.,
string, which can be associated with the words lace, tie, leap, or roll up). he diferential analysis of performance based
on the low- and high-selection conditions (performance on
Table 1. Distribution by age, school grade and group.
No. of participants
Group 1 Group 2
Age (years)
6 22 –
7 66 –
8 65 –
9 55 –
10 55 11
11 – 32
12 – 29
13 – 37
14 – 41
School grade
1 61 –
2 71 –
3 48 –
4 83 –
5 – 38
6 – 22
7 – 41
8 – 49
Figure 1. Examples of the required tasks in each part of the Cancellation Attention Test.
Part 1
Part 2
high-selection condition minus performance on low-selec
-tion condi-tion) provides a score and reac-tion time (RT) inter
-ference index. herefore, the measures used are the interfe-rence efects for score and RT24.
FAS Verbal Fluency Test (FAS)28. he computerized FAS
version was used29
to evaluate the capacity of verbal luency. he individual has to express the maximum possible num
-ber of words starting with “F” over a 1-minute period. hen, the procedure is repeated with the letters “A” and “S.” In this study, only the total score was adopted for analysis, which cor responds to the correct number of words given in the three parts of the task. Proper nouns were not allowed.
All of the tests were selected based on their psychome-tric proprieties as validated in samples of Brazilian children and teenagers4,30,31. he CAtT and TMT are available and
pu-blished in Brazil22,25. he other tests were obtained from those
who devised them.
Procedure
he project was approved by the Ethics Research Com-mittee. A consent form was sent to the School Board of Directors and students’ guardians. he tests took place in a classroom during regular school hours. Data collection be
-gan with administration of the collective tests (CAtT and TMT) over two sessions. he other tests were applied in indi
-vidual sessions for a total of four evaluation sessions for each participant, with an average time of 20 min per session. he order of the tests was counterbalanced, and only one test per day was administered to each participant.
Statistical analyses
A Pearson’s correlation analysis was performed between the predictive variables in each group. Multiple linear re
-gression analyses were performed to determine which EF varia bles predicted FAS performance while controlling for age and gender, the latter of which was entered in the analy
-sis as a dummy variable (0 - male; 1 - female). In our ana-lyses, we considered Groups 1 and 2 independently so that we could also determine whether demands or solution stra-tegies changed as a function of grade. he independent or
predictive varia bles equated to the performance in each part of the CAtT, AWMT, VWMT and SeGeT (considering score and RT interference measures separately) and the sequences supplied in Parts A and B of the TMT. he Entermethod was used to explore the contributions of each variable. In Table 2-4, signiicant results are shown in bold.
RESULTS
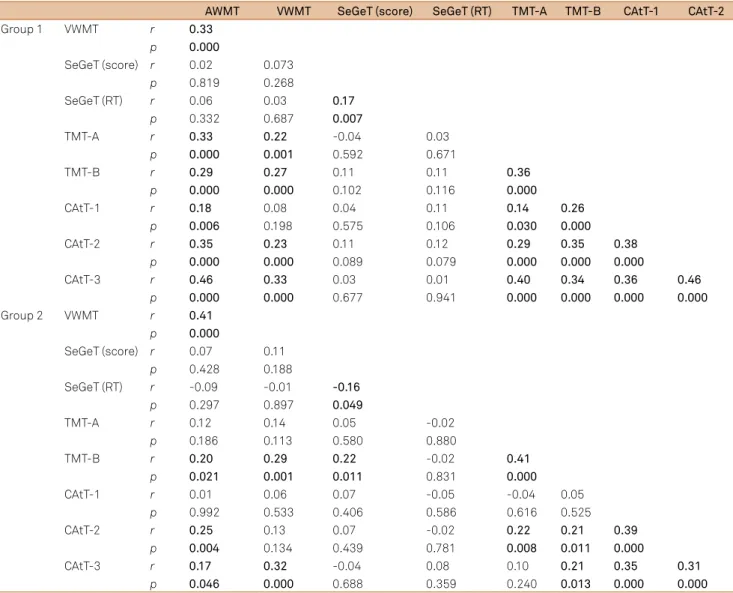
Table 2 shows the correlations between predictive varia-bles (considering EF measures only). In both groups, despite statistical signiicance, correlations between measures ten-ded to be low to moderate (r=0.14–0.46), highlighting that it could be diicult to group them into factors. So, the use of individual variables in the subsequent analyses is justiied.
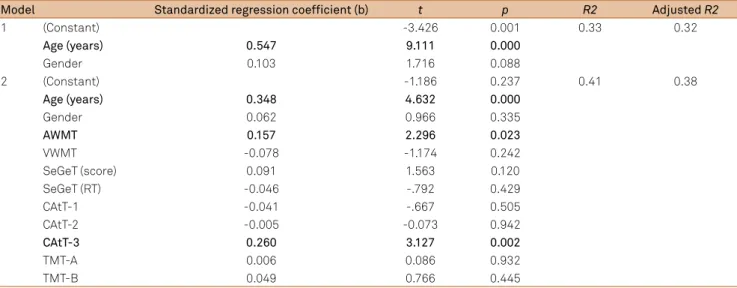
Concerning the prediction of FAS performance, regarding Group 1, age and gender were controlled at Step 1. he mo del adjustment was signiicant (p<0.001). In fact, the model had a signiicant efect on FAS performance, explaining up to 32.4% of the variance in test performance. However, although age was a signiicant predictor of FAS performance, gender had only a marginal efect. his inding indicated that, indeed, controlling for these variables – mainly age – led to a bet
-ter data it. All of the EF measures were then included in the regression. he model adjustment was signiicant (p<0.001), and EF measures were found to increase the explanatory power of the model to 38%. In this model, age remained an important predictor of FAS performance ( ß=0.35, p<0.001), but gender did not. he selective aspect of attention and shifting ( ß=0.26, p=0.002) and the AWM measure ( ß=0.16, p=0.023) signiicantly contributed to FAS performance after controlling for age and gender (Table 3).
he same procedure was repeated for Group 2. At Step 1, age and gender were entered as controlled variables and the model showed signiicant adjustment (p<0.001). Age and gender had a signiicant efect on FAS performance, explai-ning up to 12.3% of the variance in test performance, indica-ting that controlling for these variables led to a better data it. All of the EF measures were then included in the regression.
Table 2. Correlation matrix between the predictive variables in each group.
AWMT VWMT SeGeT (score) SeGeT (RT) TMT-A TMT-B CAtT-1 CAtT-2
Group 1 VWMT r 0.33
p 0.000
SeGeT (score) r 0.02 0.073
p 0.819 0.268
SeGeT (RT) r 0.06 0.03 0.17
p 0.332 0.687 0.007
TMT-A r 0.33 0.22 -0.04 0.03
p 0.000 0.001 0.592 0.671
TMT-B r 0.29 0.27 0.11 0.11 0.36
p 0.000 0.000 0.102 0.116 0.000
CAtT-1 r 0.18 0.08 0.04 0.11 0.14 0.26
p 0.006 0.198 0.575 0.106 0.030 0.000
CAtT-2 r 0.35 0.23 0.11 0.12 0.29 0.35 0.38
p 0.000 0.000 0.089 0.079 0.000 0.000 0.000
CAtT-3 r 0.46 0.33 0.03 0.01 0.40 0.34 0.36 0.46
p 0.000 0.000 0.677 0.941 0.000 0.000 0.000 0.000
Group 2 VWMT r 0.41
p 0.000
SeGeT (score) r 0.07 0.11
p 0.428 0.188
SeGeT (RT) r -0.09 -0.01 -0.16
p 0.297 0.897 0.049
TMT-A r 0.12 0.14 0.05 -0.02
p 0.186 0.113 0.580 0.880
TMT-B r 0.20 0.29 0.22 -0.02 0.41
p 0.021 0.001 0.011 0.831 0.000
CAtT-1 r 0.01 0.06 0.07 -0.05 -0.04 0.05
p 0.992 0.533 0.406 0.586 0.616 0.525
CAtT-2 r 0.25 0.13 0.07 -0.02 0.22 0.21 0.39
p 0.004 0.134 0.439 0.781 0.008 0.011 0.000
CAtT-3 r 0.17 0.32 -0.04 0.08 0.10 0.21 0.35 0.31
p 0.046 0.000 0.688 0.359 0.240 0.013 0.000 0.000
AWMT: Auditory Working Test; VWMT: Visual Working Memory Test; SeGeT: Semantic Generation Test; RT: reaction time; TMT: Trail Making Test (Part A and B); CAtT: Cancellation Attention Test (Part 1: 2 and 3).
he model adjustment was signiicant (p<0.001), and the in
-clusion of EFs improved the explanatory power of the mod
-el to 27.1%. Although the gender efect continued to be sig
-niicant ( ß=0.23, p=0.005), the age efect was not sig-niicant upon the inclusion of EF measures. he IC ( ß=-0.29, p=0.001), AWM ( ß=0.24, p=0.011) and selective attention and shifting measures ( ß=0.21, p=0.026) contributed signiicantly to FAS performance in this group (Table 4).
DISCUSSION
Our results revealed the EF demands on FAS performan-ce in a sample of children and teenagers. he impact of this inding is that we can have a better comprehension of what is indeed measured by the FAS, and about strategy changes in performance with age progression. In this way, the results suggest that diferent abilities, and also diferent rates of the
same abilities, can predict FAS performance in Groups 1 and 2. Also, age and gender can impact performance dife rently in each group. For Group 1, age and, marginally, gender (girls outperformed boys), were part of the irst model. With the in
-clusion of EF measures, the AWM and selective attention and shifting proved to be important predictors of the children’s performances, despite the continued efect of age. For this group, regression coeicients associated with age, working memory and shifting measurements were positive, sugges-ting that there is an improvement in FAS performance with advancing age. Also, participants who performed better in the auditory working memory task as well as in focus atten
-tion and shifting obtained better FAS scores.
For Group 2, the irst model showed that both age and gender could explain FAS performance. In a second set of analyses, after executive measures were entered, only a gen
Table 4. Group 2: standardized regression coeficients (b), t and p statistics, and R2 and adjusted R2 for each measurement included in the regression models.
Model Standardized regression coefficient (b) t p R2 Adjusted R2
1 (Constant) -0.434 0.665 0.14 0.12
Age (years) 0.318 3.730 0.000
Gender 0.179 2.106 0.037
2 (Constant) -1.070 0.287 0.34 0.27
Age (years) 0.145 1.629 0.106
Gender 0.231 2.861 0.005
AWMT 0.235 2.592 0.011
VWMT 0.065 0.717 0.475
SeGeT (score) -0,033 -0.404 0.687
SeGeT (RT) -0.290 -3.549 0.001
CAtT-1 -0.023 -0.243 0.809
CAtT-2 -0.030 -0.305 0.761
CAtT-3 0.212 2.256 0.026
TMT-A 0.133 1.499 0.137
TMT-B -0.109 -1.180 0.240
AWMT: Auditory Working Memory Test; VWMT: Visual Working Memory Test; CAtT: Cancellation Attention Test (Part 1: 2 and 3); RT: reaction time; SeGeT: Semantic Generation Test; TMT: Trail Making Test (Part A and B).
Table 3. Group 1: standardized regression coeficients (b), t and p statistics, and R2 and adjusted R2 for each measurement included in the regression models.
Model Standardized regression coefficient (b) t p R2 Adjusted R2
1 (Constant) -3.426 0.001 0.33 0.32
Age (years) 0.547 9.111 0.000
Gender 0.103 1.716 0.088
2 (Constant) -1.186 0.237 0.41 0.38
Age (years) 0.348 4.632 0.000
Gender 0.062 0.966 0.335
AWMT 0.157 2.296 0.023
VWMT -0.078 -1.174 0.242
SeGeT (score) 0.091 1.563 0.120
SeGeT (RT) -0.046 -.792 0.429
CAtT-1 -0.041 -.667 0.505
CAtT-2 -0.005 -0.073 0.942
CAtT-3 0.260 3.127 0.002
TMT-A 0.006 0.086 0.932
TMT-B 0.049 0.766 0.445
Dependent variable: FAS.
Predictors: Age (years); Gender (0 - male; 1 - female); AWMT: total number of correct sequences in the Auditory Working Memory Test; VWMT: total number of correct items in the Visual Working Memory Test; SeGeT (score): interference score (performance on high-selection trials minus performance on low-selection trials) in the Semantic Generation Test; SeGeT (RT): interference reaction time in seconds (reaction time on high-selection trials minus reaction time on low-selection trials) in the Semantic Generation Test; CAtT-1: total number of correct answers in Part 1 of the Cancellation Attention Test; CAtT-2: total number of correct answers in Part 2 of the Cancellation Attention Test; CAtT-3: total number of correct answers in Part 3 of the Cancellation Attention Test; TMT-A: sequence score on Part A of the Trail Making Test; TMT-B: sequence score in Part B of the Trail Making Test.
coeicients associated with gender, as well as with AWM and shifting measurements, were positive, i.e., girls perfor-med better than boys, and those who had higher scores in the AWM and shifting measurements tended to have the best results on the FAS. he regression coeicient associa-ted with the IC measurement was negative. his score refers to an RT interference measure (i.e., the RT in the high-se
-lection condition minus the RT in the low-se-lection condi
-tion on the SeGeT). he greater this diference, the greater
the interfe rence efect – i.e., the participant needed more time to inhibit competitors and answer the high-selection items. he negative regression coeicient means that par
-ticipants with less interference RT, relecting better inhibi
total number of answers (correct and incorrect) should be further investigated.
hese indings partially corroborate previous studies of adults and the elderly that have pointed to the roles of wor-king memory, especially the auditory subsystem, and, to some extent, inhibition and shifting, as important abilities involved in the FAS3,8,13,14. he insertion of these EFs in the
explicative model can be understood in terms of task requi-rements on processing information. For example, to verba-lize the answers while the test is carried out, it is necessary to access long-term memory to remember a speciic word, record the previous verbalized words to avoid repetitions, and continuously update new entries in the working memo
-ry. Besides, it is also necessary to shift between new clusters and inhibit incorrect items.
Beyond this general understanding, we also found dif
-ferential contributions to FAS performance in each of our groups. In fact, although Bolla et al.16
reported gender efects, other studies have not8,17. his can be attributed to the sam
-ples used in each study. We found that gender was not a sig
-niicant predictor of FAS performance in Group 1, but it was a signiicant predictor in Group 2, which comprised older children and teenagers. his means that, for children up to 10 years of age (Group 1), gender does not afect FAS perfor
-mance, but with age progression and, maybe, with EF deve-lopment and diferentiation, gender becomes an important variable in performance. On the other hand, age remained a signiicant predictor of FAS performance after inclusion of EF measures in Group 1, but not in Group 2. he magnitude of the age efect on EF development appears to be generally large in younger children (5-7 years), moderate in older chil
-dren (8-15 years), and quite small after that20. Data regarding
the improvement in EF performance as a function of age can be found in the study by Dias et al.4.
Additionally, regarding EF abilities, diferent demands (and explanatory powers) were associated with FAS perfor
-mance in each group. Although the AWM and selective at
-tention and shifting played a role in both groups’ performan-ces, IC only contributed to FAS performance in Group 2; in
other words, older children can use diferent strategies to solve these tasks11
. It should be mentioned that, despite the in ding that Group 1 results could be better explained by the inal model than could those in Group 2, when EF mea
-sures were entered it led to a slight increase in the explana
-tory power of the model. In contrast, when EF measures were entered, the model for Group 2 demonstrated a more consis
-tent improvement in explanatory power beyond age and gen
-der. In other words, older children and adolescents seem to show: a) more diferentiation in the contributions of EF com
-ponents relative to FAS performance, especially inhibitory control, beyond the efects of working memory and selective attention and shifting; and b) a greater efect of these con
-tributions re lative to younger children. We can suppose that further diferentiation of EF components occurs across de
-velopment12,21,32, along with verbal luency becoming more
dependent on such components; more elementary abili
-ties (such as vocabulary) become more stable over time, and diferences in performance across age become attrib
-utable to more complex abilities, such as EFs. Indeed, some stu dies have found a relationship between vocabulary and phonemic luency tasks in children aged 7-9 years32
, but not in youths33
. Vocabulary demands should be addressed and con trolled in future research. Furthermore, the explanatory powers of the models were modest. his suggests that other demands of the FAS (executive and non-executive) remain to be investigated.
Some limitations of the study should be mentioned, such as the fact that our sample consisted only of students from public schools and did not include a screening or cognitive assessment, although information about the students was provided by the schools. Despite these gaps, the study con
-tributed to our understanding of what is being measured by the FAS. In addition, our research showed that gender and age can afect performance diferentially when considering speciic age groups. Moreover, our investigation revealed that EF demands on FAS performance can change with age, which most likely relects changes in the strategies used for task resolution.
References
1. Rabin LA, Barr WB, Burton LA. Assessment practices of clinical neuropsychologists in the United States and Canada: a survey of INS, NAN, and APA Division 40 members. Arch Clin Neuropsychol 2005;20:33-65.
2. Passos VMA, Giatti L, Barreto SM, et al. Verbal luency tests reliability in a Brazilian multicentric study, ELSA-Brasil. Arq Neuropsiquiatr 2011;69:814-816.
3. Malloy-Diniz LF, Sedo M, Fuentes D, Leite WB. Neuropsicologia das funções executivas. In: Fuentes D, Malloy-Diniz LF, Camargo CHP, Cosenza RM (Eds). Neuropsicologia: Teoria e Prática. Porto Alegre: Artmed, 2008:187-206.
4. Dias NM, Menezes A, Seabra AG. Age differences in executive functions within a sample of Brazilian children and adolescents. Span J Psychol 2013;16:1-14.
5. Goncalves HA, Mohr RM, Moraes AL, Siqueira LS, Prando ML, Fonseca RP. Componentes atencionais e de funções executivas em meninos com TDAH: dados de uma bateria neuropsicológica lexível. J Bras Psiquiatr 2013;62:13-21.
7. Freitas PM, Cardoso TGS, Siquara GM, Freitas LMA, Silva, VS. Avaliação neuropsicológica dos déicits cognitivos e comportamentais associados à aprendizagem em crianças de 4 a 8 anos. Estudos IAT 2012;2:63-83.
8. Lezak MD, Howieson DB, Loring DW. Neuropsychological Assessment. 4th ed. New York: Oxford University Press, 2004.
9. Golden CJ, Espe-Pfeifer P, Wachsler-Felder J. Neuropsychological Interpretation of Objective Psychological Tests (Critical Issues in Neuropsychology). New York: Kluwer, 2002.
10. Strauss E, Sherman EMS, Spreen O. A Compendium of Neuropsychological Tests: Administration, Norms, and Commentary. 3rd ed. New York: Oxford University Press, 2006.
11. Tallberg IM, Carlsson S, Lieberman M. Children’s word luency strategies. Scand J Psychol 2011;52:35-42.
12. Miyake A, Friedman NP, Emerson MJ, Witzki AH, Howerter A, Wager T. The unity and diversity of executive functions and their contributions to complex “frontal lobe” tasks: A latent variable analysis. Cogn Psychol 2000;41:49-100.
13. Rende B, Ramsberger G, Miyake A. Commonalities and differences in the working memory components underlying letter and category luency tasks: a dual-task investigation. Neuropsychology 2002;16:309-321.
14. Troyer AK, Moscovitch M, Winocur G. Clustering and switching as two components of verbal luency: evidence from younger and older healthy adults. Neuropsychology 1997;11:138-146.
15. Szatkowska I, Grabowska A, Szymanska O. Phonological and semantic luencies are mediated by different regions of the prefrontal cortex. Acta Neurobiol Exp (Wars) 2000;60:503-508.
16. Bolla KI, Lindgren KN, Bonaccorsy C, Bleecker ML. Predictors of verbal luency (FAS) in the healthy elderly. J Clin Psychol 1990;46:623-628.
17. Barry D, Batesb ME, Labouvieb E. FAS and CFL forms of verbal luency differ in dificulty: a meta-analytic study. Appl Neuropsychol 2008;15:97-106.
18. Hurks PP. Does instruction in semantic clustering and switching enhance verbal luency in children? Clin Neuropsychol 2012;26:1019-1037.
19. Best JR, Miller PH. A developmental perspective on executive function. Child Dev 2010;81:1641-1660.
20. Best JR, Miller P, Naglieri JA. Relations between executive function and academic achievement from ages 5 to 17 in a large, representative national sample. Learn Individ Differ 2011;21:327-336.
21. Cuevas RR, Alanís T. Exploring the interrelation of executive functions during child development. J Int Neuropsychol Soc 2008;14:56-56.
22. Montiel JM, Seabra AG. Teste de Atenção por Cancelamento [Cancellation Attention Test]. In: Seabra AG, Dias NM (Eds.), Avaliação neuropsicológica cognitiva: atenção e funções executivas. Vol. 1. [Cognitive Neuropsychological Assessment: Attention and Executive Functions]. São Paulo, Brazil: Memnon, 2012:47-56.
23. Primi R. Bateria Informatizada de Capacidades Cognitivas [Computerized Battery of Cognitive Skills]. Software. Itatiba, Brazil: São Francisco University, 2002.
24. Gil R. Neuropsicologia. São Paulo, Brazil: Editora Santos, 2002.
25. Montiel J, Seabra AG. Teste de trilhas [trail making test]. In: Seabra AG, Dias NM (Eds). Avaliação neuropsicológica cognitiva: atenção e funções executivas. Vol. 1. [Cognitive Neuropsychological Assessment: Attention and Executive Functions]. São Paulo, Brazil: Memnon, 2012:69-75.
26. Seabra AG, Cozza H, Capovilla FC, Macedo EC, Dias NM. Avaliação de controle inibitório em crianças: Teste de Geração Semântica [assessment of inhibitory control in children: the Semantic Generation Test]. In: Seabra AG, Capovilla FC (Eds). Teoria e Pesquisa em Avaliação Neuropsicológica [Theory and Practice in Neuropsychological Assessment]. 2nd ed. São Paulo, Brazil: Memnon, 2009:69-75.
27. Thompson-Schill SL, Swich D, Farah MJ, D´Exposito M, Kan IP, Knight RT. Verb generation in patients with focal frontal lesions: a neuropsychological test of neuroimaging indings. PNAS 1998;95:55-60.
28. Benton AL, Hamsher KD. Multilingual Aphasia Examination. Iowa City, IA: AJA Associates, 1989.
29. Seabra AG. Teste de Fluência Verbal FAS. Software. São Paulo, Brazil: Mackenzie Presbyterian University, in press.
30. Assef ECS, Capovilla AGS, Capovilla FC. Computerized Stroop Test to assess selective attention in children with attention deicit hyperactivity disorder. Span J Psychol 2007;10:33-40.
31. Capovilla AGS, Dias NM, Trevisan BT, Montiel JM, Andrade AM. Validity of neuropsychological instruments for attention assessment in Brazilian children. J Int Neuropsychol Soc 2008;14:7-8.
32. Brydges CR, Reid CL, Fox AM, Anderson M. A unitary executive function predicts intelligence in children. Intelligence 2012;40:458-469.