Rev Saúde Pública 2004;38(3) www.fsp.usp.br/rsp
Evaluation of the fluoride concentration and
consumption of mineral water
Irene Ramiresa,*, Roberto H enrique da Costa Greca,**, Lourenço Cattana,**, Patrícia Gomes de M ouraa,***, José Roberto Pereira Laurisb and M arília Afonso Rabelo Buzalafc
aFaculdade de Odontologia de Bauru. Universidade de São Paulo (FOB/USP). Bauru, SP, Brasil. bDepartamento de Odontopediatria, Ortodontia e Saúde Coletiva. Área de Saúde Coletiva. FOB/USP.
Bauru, SP, Brasil. cDepartamento de Ciências Biológicas. Área de Bioquímica. FOB/USP. Bauru, SP, Brasil
Correspondence to: Marília Afonso Rabelo Buzalaf Depto de Ciências Biológicas - FOB/USP Al. Dr. Octávio Pinheiro Brisolla, 9-75 17012-901 Bauru, SP, Brasil E-mail: [email protected]
Financial support by Fundação de Amparo à Pesquisa do Estado de São Paulo (Fapesp - Process n. 02/13227-9). This work was presented at the Jornada Odontologica of FOB/USP, 2003.
* Master student in Public Health in Faculdade de Odontologia de Bauru/USP. ** Undergraduate dental student in Faculdade de Odontologia de Bauru/USP. *** Student of the Specialization course in Public Health HRAC FOB/USP. Received on 22/7/2003. Reviewed on 28/11/2003. Approved on 4/2/2004.
Keywords
Potable water, analysis. Fluoridation. Fluorine, analysis. Fluorosis, dental.
Abstract
Objective
Considering that water is an importance source of fluoride intake, and that the consumption of mineral water and prevalence of dental fluorosis have been increasing, the aim of this study was to evaluate the consumption of mineral water and its fluoride concentration.
Methods
The study was performed in residential districts of the municipality of Bauru, State of São Paulo, by means of stratified sampling via clusters. Each cluster corresponded to one residential block. For randomization purposes, the residential blocks were numbered within the 17 districts established by the city plan. One thousand homes were thus visited. Mineral water samples were collected using previously labeled 50 ml plastic flasks. Fluoride analysis was done using an ion-sensitive electrode (Orion 9609), after buffering using TISAB II. Information on the consumption of mineral water was obtained by means of applying a questionnaire.
Results
Around 29.72% of the city’s population was consuming mineral water. In the 260 samples analyzed from 29 different brands of water, the fluoride concentration ranged from 0.045 to 1.515 mg/l. For one brand, the label stated that the fluorideconcentration was 0.220 mg/l, but analysis revealed a concentration of 1.515 mg/l. Moreover, some brands did not specify the fluoride concentration on the label and, for these, the analysis showed concentrations ranging from 0.049 to 0.924 mg/l.
Conclusions
The results demonstrated wide variation in fluoride concentrations and reinforce the importance of the control of such waters by the sanitary surveillance agency.
INTRODUCTION
The exploitation of mineral water or bottled water in Brazil is regulated by the National Mineral Produc-tion Department of the Ministry of Mines and Energy. The definition and control of drinkability are under the control of the National Sanitary Surveillance Agency of the Ministry of Health.4 Because of the need
to standardize the utilization of mineral waters that are commercialized by means of bottling, and for other purposes, Decree Law no. 7841, known as the
“Min-eral Water Code”, was published in the Fed“Min-eral Offi-cial Gazette (DOU) on August 20th, 1945. This law
re-mains in force today, with some modifications.3
Rev Saúde Pública 2004;38(3) www.fsp.usp.br/rsp
Água mineral: flúor e consumo Ramires I et al
stratified sampling by area, achieved via clusters. Each cluster corresponded to one residential block. The percentage of the population living in each of the 17 districts established by the Bauru city plan was cal-culated (Table 1). Within each district, the clusters were numbered and randomly selected until the pro-portional number of homes in relation to the popula-tion of each district was obtained. The sample size was set at 1,000 homes, based on a confidence inter-val of 3% for a confidence level of 95%. Thus, 1,000 homes were visited, in which a total of 3,586 people were living (mean of 3.6 inhabitants per home), since the study aimed at evaluating the overall consump-tion of mineral water in the city and not the percent-ages of one or other mineral water brand consumed.
The consumption profile for bottled mineral water among the population was evaluated by means of a questionnaire applied in each of these homes. The fol-lowing were investigated: how many people lived there and what their ages were; whether mineral water was consumed or not; what brand of mineral water was used; how long they had been consuming mineral water; what fluoride concentration was specified on the label; whether some type of water purifier was used; and what awareness there was of the presence of fluoride in the mineral water and its action in caries prevention.
For the analysis of the fluoride concentration in the mineral water, the samples were collected in previ-ously labeled 50-ml plastic flasks and frozen at -20°C until analysis. Sample analysis was carried out at the Biochemistry Laboratory of Bauru Dental School (FOB/USP).
Fluoride analysis
The fluoride (F-) concentration of the water
sam-regarded as such when they have reached greater depths, thereby achieving enrichment in salts and acquiring new physicochemical characteristics.
According to Regulation no. 54 of June 15th, 2000,
mineral water is understood to be any water obtained directly from natural springs or artificially extracted from the subsoil that is characterized by a defined and constant content of mineral salts (ion composi-tion) and by the presence of trace elements and other components. Collection of these waters should be conducted under conditions that ensure the mainte-nance of the original features found at their wells or springs, which should be kept within the variation limits and have no direct influence from surface ters. In Brazil, most occurrences of mineralized wa-ters are in the form of natural springs.
Water fluoridation is a recognized method for pre-venting dental caries when it is undertaken at the ideal concentration for each region, according to the local mean temperature. However, it is also a risk fac-tor for dental fluorosis when the fluoride (F-)
concen-tration is above the recommended levels. The impact of water fluoridation is mainly indirect, through the use of water in food and beverage manufacturing proc-esses and also in food and beverage reconstitution at home (Burt,6 1992; Winkle et al,25 1995; Villena et
al,24 1996; Buzalaf et al,7 2001; Buzalaf et al,8 2003).
The production and consumption of mineral water in Brazil has increased by about 20% per year over the last five years, while the increase was 9% worldwide and 10% in the United States. The Brazilian per-capita consumption increased from 15.13 liters per year in 1995 to 23.8 liters in 2001. The southeastern region accounts for the largest production in the country, namely 53%, of which 36.9% is in the State of Sao Paulo. It should be highlighted that the production of the northeastern region has increased by 40% and now accounts for 25.10% of national production.4
Considering the variety of the sources of mineral water and the lack of data from Brazil regarding such consumption, it becomes essential to know the fluo-ride content of the water consumed, so as to be assured of its benefits in the prevention of caries without run-ning the risk of dental fluorosis (Featherstone,11 1999).
Thus, the present study had the aim of evaluating fluo-ride concentration and mineral water consumption.
M ETH O D S
The data were collected in residential areas of the city of Bauru, State of São Paulo, Brazil, by means of
Table 1 - Percent distribution of the population of Bauru in
2003, according to the city plan and the number of homes visited by area.
Areas District % N of
Population homes
A Centro 5.8 57
B Altos da Cidade 7.9 66
C Vila Cardia 5.2 52
D Vista Alegre 7.6 80
E Jaraguá/Bela Vista 21.8 218
F Vila Industrial 11.6 118
G Jd. Ferraz/Independência 9.4 94 H Parque das Camélias 4.2 42
I Núcleo Geisel 9 91
J Núcleo Octávio Rasi 1.8 18
L Unesp 0.2 1
M Terra Branca/Tangarás 0.2 3
N Tangarás 0.5 5
O Jardim Pagani 3.6 37
P Núcleo Mary Dota 6.7 66
Q Chácara São João 0.4 4
!
Rev Saúde Pública 2004;38(3) www.fsp.usp.br/rsp
Água mineral: flúor e consumo Ramires I et al
ples was analyzed in duplicate using an ion-sensi-tive electrode (Orion 9609) connected to a potentiometer (Procyon, model 720). A sample size of 1.0 ml was utilized, to which 1.0 ml of TISAB II buffer (Orion) was added. Prior to the analysis, cali-bration was carried out in triplicate, using standard fluoride solutions of concentrations ranging from 0.02 to 1.6 µgF-/ml. These were obtained through
se-rial dilution from a standard stock solution contain-ing 100 µgF-/ml (Orion). Tests with known fluoride
concentrations were performed every hour to check the calibration. The readings in mV from the stand-ards of known fluoride concentrations were entered into the Microsoft Excel spreadsheet and converted to µgF-. The calibration curves were only accepted
when the variation was no more than 5%. The mean repeatability of the readings, based on the duplicate analyses, was 91.5%. In addition, new analyses were performed on 32% of the sample, thereby revealing a reproducibility of 92.2%.
Analysis of the questionnaire
Analysis of the data obtained via the questionnaire was done by means of descriptive statistics, with the utilization of absolute and relative
frequen-cies that were described in tables and graphs.
Although mineral water consumption was reported in 312 homes out of the 1,000 vis-ited, no water was available for sample collec-tion in 26 homes. A further 26 water samples were excluded during the tabulation of the data from the questionnaire because, even though the consumer knew the brand, there was no label on the water receptacle to enable confirmation of the brand and fluoride con-centration. Thus, 260 samples were taken into account in preparing the tables and graphs.
RESU LTS
Around 29.72% of the population was
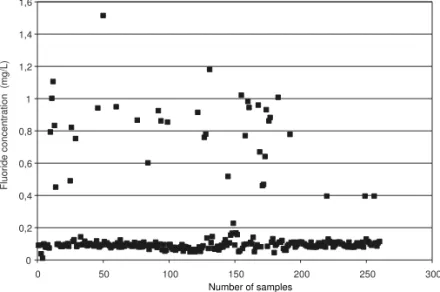
consuming mineral water, of whom 14% had had this habit for five years or more and 15.6% had ac-quired it over the last five years (1998 to 2003). In the 260 samples analyzed from 29 different brands of mineral water, the fluoride concentration ranged from a minimum of 0.045 to a maximum of 1.515 mg/l (Table 2). Among the water samples collected from nine known sources, seven of them (77.8%) presented an average fluoride concentration of be-tween 0.115 and 0.522 mg/l that was greater than what was stipulated in the label. Among the mineral waters from unknown sources, the range was from a minimum of 0.049 mg/l to a maximum of 1.180 mg/ l (Table 3). Overall, for the 260 samples analyzed, it was seen that 62.3% of the mineral waters presented fluoride concentrations ranging from 0.045 to 0.100 mg/l (non-fluoridated), 24.6% from 0.100 to 0.600 mg/l (under-fluoridated) and just 3.9% from 0.600 to 0.800 mg/l. It was further observed that 9.2% of the samples showed fluoride concentrations of 0.800 to 1.515 mg/l (over-fluoridated) (Figure). For ten brands, only one sample of each could be obtained, and these were therefore not included in the tables. For these brands, the fluoride concentrations ranged from 0.045 to 0.778 mg/l.
Table 2 - Mineral water consumed in Bauru in 2003, according to fluoride concentration shown on the label, minimum and
maximum values found and sample mean in mg/l.
Brand of mineral N of mg F-/l on Minimum M aximum M ean
w ater samples the label* mg F-/l mg F-/l mg F-/l
Source 1 7 0.010 0.061 0.083 0.071
Source 2 33 - 0.065 0.924 0.174
Source 3 4 0.059 0.099 0.140 0.115
Source 4 3 0.550 0.460 0.640 0.522
Source 5 40 0.025 0.049 1.008 0.155
Source 6 9 0.050 0.079 0.517 0.158
Source 7 44 0.220 0.075 1.515 0.183
Source 8 3 0.034 0.080 0.092 0.086
Source 9 5 0.020 0.051 1.021 0.376
F- - fluoride
*fluoride data obtained from the label provided by some participants in the study.
Figure 1 - Variation in the fluoride concentration (mg/l) found in the mineral waters consumed in Bauru, 2003.
0 0,2 0,4 0,6 0,8 1 1,2 1,4 1,6
0 50 100 150 200 250 300
Fluoride concentration (mg/L)
" Rev Saúde Pública 2004;38(3) www.fsp.usp.br/rsp
Água mineral: flúor e consumo Ramires I et al
D ISCU SSIO N
Increased consumption of mineral water in substitu-tion or addisubstitu-tion to the public water supply may have implications for safe fluoride supplementation (Brandão et al,2 1998; Lindemeyer,14 1996; Tate &
Chan,22 1994; Winkle et al,25 1995). Similarly, as has
been seen for mineral water, the consumption of infant formulae (supplemented milk) has increased greatly over recent years. These formulae are commercially available in three presentations: ready to use, concen-trated liquids, or powdered. The latter is the type most frequently found in Brazil. The fluoride concentrations in formulae ready for consumption and concentrated liquids are relatively low and are usually around 0.1 to 0.3 mg/l. However, liquid formulae require the addi-tion of an equal volume of water before consumpaddi-tion. Thus, the final fluoride concentration will be directly related to the water utilized in the dilution. In pow-dered formulae, the mean F- concentration is around
0.69 mg/l for milk-derived products and slightly higher for soybean-derived products. The reconstitution of powdered products requires the addition of an average of 145 g of powder to 880 ml of water. Thus, the final fluoride concentration also depends on the fluoride concentration of the water utilized for dilution, which usually ranges from 0.276 to 0.980 mg/l (Formon et al,12 2000; Silva & Reynolds,20 1996). For children
aged more than four months who consume an average of 120 ml/kg/day of diluted formula, their fluoride in-take is around 0.072 to 0.118 mg/kg/day for the con-centrated and powdered formulae, respectively. How-ever, it should be borne in mind that children at this age also ingest fluoride from sources other than milk (Formon et al,12 2000).
Buzalaf et al7 (2001) evaluated the fluoride
con-centration of ten brands of powdered milk, prepared according to the manufacturers’ instructions using deionized water, the public water supply (0.9 mgF-/l)
and seven different brands of mineral water. The fluo-ride concentration ranged from 0.01 to 0.75 mg/l in the milks prepared with deionized water, 0.91 to 1.65
mg/l in those prepared with the public water supply and 0.02 to 1.37 mg/l in those prepared with mineral water. Considering that the optimal daily fluoride intake recommended is 0.05 to 0.07 mg/kg of body weight (Burt,6 1992), some types of milk exceeded
the limit when prepared using water from the public water supply, considering the mean daily intake of milk recommended for each child. Since consump-tion above these levels may cause dental fluorosis, utilization of fluoridated water with fluoride concen-trations close to 1.0 mg/l as diluents for powdered milk for infants and young children should be avoided. Non-fluoridated mineral water is recom-mended for this purpose (Buzalaf et al,7 2001).
Milk is the first and main source of nourishment for children during their first months of life, when the front teeth are being formed. Human breast milk has a low fluoride concentration, usually around 0.005 to 0.010 mg/l, because the fluoride transportation from serum to milk is poor (Ekstrand et al,10 1984). The
fluoride concentration in the milk of other mammals is also low (Dias et al,9 2000; Formon et al12).
Thus, both the type of milk and the water consumed by children should be regarded as important factors in evaluating the risk of fluorosis and prescribing fluo-ride supplements (Lindemeyer,14 1996; Tate & Chan,22
1994; Winkle et al,25 1995). It can therefore be seen
that it is extremely important to evaluate the F-
con-centration of mineral water and its consumption by children (Stannard et al,21 1990; Toumba et al,23 1994).
Ordinance no. 14 of January 1st, 1977, from the
Min-istry of Health (Resolution 25/76) lays down that the label should state the composition of the product per liter as indicated in the respective analysis certificate. Resolution no. 54 of June 15th, 2000, from the
Na-tional Sanitary Surveillance Agency establishes the obligation for the label to clearly and precisely state the following information, among other matters: • “Contains fluoride”, when the product has more
than 1 mg/l of fluoride;
Table 3 - Brands of mineral water without indication of source that were consumed in Bauru in 2003, according to fluoride
concentration shown on the label, minimum and maximum values found and sample mean in mg/l.
Mineral water N of mgF- /l on Minimum M aximum M ean
brand samples the label mg F-/l mg F-/l mg F-/l
1 4 - 0.070 0.770 0.311
2 4 - 0.083 0.931 0.507
3 16 - 0.049 0.914 0.148
4 11 0.050 e 0.100 0.070 1.180 0.370
5 3 0 0.097 0.982 0.674
6 5 0 0.861 0.882 0.871
7 2 0 0.110 0.130 0.120
8 49 0.036 e 0.070 0.073 1.105 0.264
9 5 0.038 e 0.013 0.091 0.227 0.160
#
Rev Saúde Pública 2004;38(3) www.fsp.usp.br/rsp
Água mineral: flúor e consumo Ramires I et al
• “This product is not suitable for breastfeeding mothers or children aged under seven years” when the product has more than 2 mg/l of fluoride; • “Fluoride above 2 mg/l is not recommended for
daily consumption” when the product has more than 2 mg/l of fluoride.
Furthermore, according to the mineral water legis-lation, water is regarded as fluoridated when the fluo-ride concentration is greater than or equal to 0.1 mg/ l, and this should be made clear on the label. How-ever, Table 2 shows that the water from Source A indi-cates that it is “fluoridated mineral water” when in fact its fluoride concentration is only 0.010 mg/l. Analysis of seven samples from this source revealed fluoride concentration ranging from 0.061 to 0.083 mg/l, with a mean of 0.071 mg/l. The opposite was found for 33 samples from Source B, which did not describe its fluoride concentration on the label, even though the analysis found concentrations ranging from 0.065 to 0.924 mg/l, with a mean of 0.174 mg/l. This source should therefore be regarded as fluori-dated. Water from Source G, which had a consider-able consumption rate, considering that 44 samples were obtained, declared a fluoride concentration of 0.220 mg/l on its label, yet the concentration revealed by the analysis ranged from 0.075 mg/l to 1.515 mg/ l, a maximum that is much greater. The difference between the concentration stated on the label and what was actually found was even larger for water from Source I, which stated a concentration of 0.020 mg/l on the label and in fact ranged from 0.051 to 1.021 mg/l in the analysis of its five samples, with a mean of 0.376 mg/l. Of the nine brands of mineral water of known origin collected (Table 2), seven brands (77.77%) displayed a mean fluoride concen-tration of 0.115 to 0.522 mg/l that was greater than the level stated on the label. In the same way as in the investigations by Franco & Maltz13 (1991) and Villena
et al24 (1996), which were also conducted on mineral
waters found on the Brazilian market, the present study found high fluoride concentrations (above the recommended level) that were not specified on the labels, and also low concentrations (below the mini-mum level considered to be fluoridated) for waters that their producers described as fluoridated. This re-veals that, even 12 years after the first study and 7 years after the second, the problem still persists.
Table 3 presents the mineral waters for which the sources were not identified but the brands were. It re-veals large differences between the fluoride concen-trations stated on the label and what was found in the analyses. The mean values observed in the samples of these ten different brands ranged from 0.045 to 0.871 mg/l. Eighty percent of them were within the
mini-mum and maximini-mum limits, thus being considered as safe fluoridated waters, whereas the remainder had low concentrations of between 0.045 and 0.096 mg/l.
Even though there were large differences between the fluoride concentrations stated on the labels and what was revealed by analysis of the 260 samples of the 29 brands of mineral water, the maximum values of the means, namely 0.871 mg/l, were within the acceptable levels for water for daily consumption (Tables 2 and 3). Of these, five brands (20%) had a mean that was less than the minimum level regarded as fluoridated (<0.1 mg/l). Considering all the sam-ples analyzed (260), it was observed that 62.3% of the brands showed fluoride concentrations ranging from 0.045 to 0.100 mg/l (non-fluoridated), 24.6% from 0.100 to 0.600 mg/l (under-fluoridated) and just 3.9% from 0.600 to 0.800 mg/l. It was further ob-served that 9.2% of the samples revealed fluoride concentrations of 0.800 to 1.515 mg/l (over-fluori-dated). These results are similar to those found by Winkle et al25 (1995), who evaluated 78 brands of
mineral water in Iowa and found fluoride concentra-tions ranging from 0.02 to 1.36 mg/l, of which 83% were from 0.02 to 0.16 mg/l, 7% from 0.34 to 0.56 mg/l and 9% over 1 mg/l.
There has been a continuous increase in the con-sumption of mineral water in Brazil and the world, both for drinking and for preparation of foods, ice cubes and beverages, especially for children. Studies have indicated a concern among populations for seek-ing water of higher quality, which has been sought through the consumption of mineral water (Ayo-Yusuf et al,1 2001; Brandão & Valsecki,2 1998; Stannard et
al,21 1990; Villena et al,24 1996)
The present study found that around 29.7% of the population of Bauru was consuming mineral water: 14% had been using it for five years or more, while 15.6% had started consuming it during the last five years (1998-2003). That is to say, there was an in-crease in consumption of more than 50% over this period. It was further observed that 82.5% of the popu-lation that did not consume mineral water had some type of domestic water purifier. Moreover, 17.5% of the population that consumed mineral water also had water purifiers. Around 47.5% of all the homes made use of some type of water purifier: 7.7% tap-mounted purifiers, 9.8% wall-mounted purifiers and 30% bot-tle purifiers. These numbers are much higher than those found in Iowa, where 11% of the homes have water purifiers (Winkle et al,25 1995). However, it is
$ Rev Saúde Pública 2004;38(3) www.fsp.usp.br/rsp
Água mineral: flúor e consumo Ramires I et al
regard to the presence of fluoride in mineral water, around 45% of the population studied was aware of this fact, and 50% knew about its action in caries prevention.
According to Federal Law no. 8080 of September 19th, 1990, sanitary surveillance is defined as “a set
of actions that can eliminate, reduce or prevent health risks and intervene in sanitary problems that result from the environment, the production and distribu-tion of goods and the provision of healthcare-related services” (Brasil,5 1990). According to Narvai17
(2001), sanitary surveillance is one of the bases of public health and sanitary surveillance actions in the field of public health dentistry should encompass three fields: “dental care services, oral hygiene prod-ucts, and foods and beverages” (Narvai,16 1998). The
REFEREN CES
1. Ayo-Yusuf OA, Kroon J, Ayo-Yusuf, IJ. Fluoride concentration of bottled drinking waters. SADJ 2001;56:273-7.
2. Brandão IMG, Valsecki Jr A. Análise de concentração de flúor em águas minerais na região de Araraquara, Brasil. Rev Panam Salud Publica 1998;4:238-42.
3. Brasil. Decreto-Lei n. 7.841 de 8 de agosto de 1945. Código de águas minerais Diário Oficial da União, 20 ago 1945. p. 194.
4. Brasil. Portaria n. 56 / Dsb - 14 março de 1977. Ministério da Saúde. Diário Oficial da União, 15 jun 1977. Secão I - parte I.
3. Brasil. Lei Federal n. 8.080, de 19 de setembro de 1990. Lei orgânica da saúde. Diário Oficial da União, 20 set 1990. p. 18055.
6. Burt BA. The changing patterns of systemic fluoride intake. J Dent Res 1992;71:1228-37. [Special Issue].
7. Buzalaf MAR, Granjeiro JM, Damante CA, Ornelas F. Fluoride content of infant formulas prepared with deionized, bottled mineral and fluoridated drinking water. J Dent Children 2001;68:37-41.
8. Buzalaf MAR, Levy FM, Rodrigues MHC, Bastos JRM. The effect of domestic water filters on the water fluoride content and fluoride level of the public water supply in Bauru, Brasil. J Dent Children 2003;70:226-30.
9. Dias H, Rosa HM, Buzalaf MAR. Concentration de flúor em leches comercialmente disponibles em Brazil. In: Reunion Anual de La Sociedad Argentina de Investigación Ondontológica, 33/División de La International Association For Dental Research, Cordoba, 2000. Programa y Resúmenes de Trabajo. Cordoba AR, IADR, 2000. Resumo 191.
10. Ekstrand J, Hardell LI, Spak C-J. Fluoride Balance studies on infants in a 1-ppm-water-fluoride area. Caries Res 1984;18:87-92.
11. Featherstone JDB. Prevention and reversal of dental caries: role of lou level fluoride. Com Dent Oral Epidemiol 1999;27:31-40.
12. Fomon SJ, Ekstrand J, Ziegler EE. Fluoride intake and prevalence of dental fluorosis: trends in fluoride intake with special attention to infants. J Publ Health Dent 2000;60:131-9.
13. Franco FC, Maltz MA. A concentração de fluoretos em águas minerais, chás brasileiros e chimarão. In: Reunião da Sociedade Brasileira de Pesquisa Odontológica, 8. Águas de São Pedro, 1991. Anais. p. 4.
14. Lindemeyer RG. Fluoride: surprising factors in bottled waters. Penn Dental J 1996;63(1):13-7.
15. Murray JJ. O uso correto de fluoretos na saúde pública. São Paulo: OMS-Ed. Santos; 1992.
Brazilian sanitary surveillance system was reorgan-ized by means of Law no. 9782 of October 25th, 1999,
when the National Sanitary Surveillance Agency (ANVISA) was created. Its purpose is “to promote and protect public health by means of sanitary control over the production and commercialization of prod-ucts and services that are subject to sanitary surveil-lance, including the environments, processes, sup-plies and technologies that are related to such prod-ucts and services” (ANVISA, 2001). Since fluoride is a chemical element that may be present in various products, such as the public water supply, mineral water, beverages, juices, soft drinks, foods, and some drugs and nutritional supplements, the control and maintenance of its proper concentration are of inter-est to sanitary surveillance (Murray,15 1992; Narvai,17
%
Rev Saúde Pública 2004;38(3) www.fsp.usp.br/rsp
Água mineral: flúor e consumo Ramires I et al
16. Narvai PC. Vigilância sanitária e saúde bucal. São Paulo: Faculdade de Saúde Pública da Universidade de São Paulo; 1998.
17. Narvai PC. Vigilância Sanitária da fluoretação das águas de abastecimento público no município de São Paulo, Brasil, no período de 1990-1999 [dissertação de livre-docência] São Paulo: Faculdade de Saúde Pública da Universidade de São Paulo; 2001.
18. [OMS] Organización Mundial de la Salud. Fluoruros y salud. Ginebra: OMS; 1972. (Série de
Monografias, nº 59).
19. Santoro AMCV. Teor de flúor nos chás industrializados no Brasil e seu significado para a saúde bucal [dissertação de mestrado]. São Paulo: Faculdade de Saúde Pública da Universidade de São Paulo; 1977.
20. Silva M, Reynolds EC. Fluoride content of infant formula in Australia. Aust Dent J 1996;41:37-42.
21. Stannard J, Rovero J, Tsamtsouris A, Gavris V. Fuoride content of some bottled waters and recommendations for fluoride supplemetation. J Pedod 1990;14:103-7.
22. Tate WH, Chan JT. Fluoride concentrations in bottled and filtered waters. Gen Dent 1994;42:362-6.
23. Toumba KJ, Levy S, Curzon MEJ. The fluoride content of bottled drinking waters. Br Dent J 1994;176:266-8.
24. Villena RS, Borges DG, Cury JA. Avaliação da concentração de flúor em águas minerais comercializadas no Brasil. Rev Saúde Pública 1996;30:512-8.
25. Winkle SV, Levy SM, Kiritsy MC, Heilman JR, Wefel JS, Marshall T. Water and formula fluoride