1Universidade Federal da Bahia, Escola de Nutrição, Departamento Ciência da Nutrição. Av. Araújo Pinho, 32, Canela,
40110-150, Salvador, BA, Brasil. Correspondência para/Correspondence to: RC RIBEIRO-SILVA. E-mail: <[email protected]>.
2Universidade Federal da Bahia, Faculdade de Odontologia, Departamento de Odontologia Social e Pediátrica. Salvador, BA,
Brasil.
Support: Fundação de Amparo à Pesquisa do Estado da Bahia (Project nº 5250/2009) and Programa de Educação para o Trabalho - Projeto Parceria: Educação e Trabalho (PROPET), Ministério da Saúde (nº 25000.1118531/2012-49).
Effect of actions promoting healthy
eating on students’ lipid profile:
A controlled trial
Efeito de ações de promoção da alimentação
saudável sobre o perfil lipídico de
estudantes
:
um estudo controlado
Rita de Cássia RIBEIRO-SILVA1
Luce Alves da SILVA1
Maria Cristina Teixeira CANGUSSU2
A B S T R A C T
Objective
To assess the effect of nutrition intervention actions on the lipid profile of children and adolescents enrolled in public elementary schools.
Methods
This nine-month, controlled, intervention study included 202 students aged 7 to 14 years attending two schools (intervention/control) located in a poor neighborhood of the municipality of Salvador, Bahia, Brazil. Actions were implemented in the intervention school to promote healthy eating habits, presented as “Ten steps to healthy eating”. The effect of these actions was assessed by subjecting the students at baseline and end of the follow-up to biochemical, maturation, and anthropometric measurements and a produce intake survey. The dependent variables were the changes in the study biochemical parameters: total cholesterol, high density lipoprotein-cholesterol, low density lipoprotein-cholesterol, and triglycerides. Analysis of covariance assessed the changes that occurred over the study period.
Results
Conclusion
Actions of this nature have a positive impact on lipid profile. This study adds to those that use effective and viable public health strategies implementable at the primary care level.
Indexing terms: Food habits. Intervention study. Lipids. Students.
R E S U M O
Objetivo
Avaliar o efeito das ações de intervenção nutricional sobre o perfil lipídico de crianças e adolescentes matriculados na rede pública de ensino fundamental.
Métodos
Trata-se de um estudo de intervenção, controlado, com duração de 9 meses, do qual participaram 202 estudantes, com idade entre 7 e 14 anos, matriculados em duas escolas (intervenção/controle) situadas em bairro pobre do município de Salvador, Bahia, Brasil. Foram previstas para a escola sob intervenção ações com vistas à adoção de hábitos alimentares saudáveis, traduzidos nos “Dez passos para uma alimentação saudável”. Com o propósito de avaliar o efeito de tais ações, todos os alunos foram submetidos, no baseline e final do
follow-up, aos exames bioquímicos, maturacionais e antropométricos. Além disso, responderam a um inquérito de consumo de frutas, verduras e legumes Adotaram-se como variáveis dependentes as mudanças nos parâmetros bioquímicos (colesterol total, lipoproteína de alta densidade-colesterol, lipoproteína de baixa densidade-colesterol e triacilglicerol). Para avaliar as mudanças ocorridas ao longo do tempo, empregou-se análise de covariância.
Resultados
Os estudantes sob intervenção apresentaram decremento de 13,18 mg/dL na média do colesterol total (p=0,001), de 7,41 mg/dL na média do lipoproteína de baixa densidade-colesterol (p=0,038) e de 12,37 mg/dL na média dos triacilglicerídeos (p=0,029) quando comparados àqueles que não foram submetidos à intervenção.
Conclusão
Ações dessa natureza têm impacto positivo na adequação do perfil lipídico. Este estudo soma-se àqueles que adotam estratégias eficazes e viáveis em saúde pública, que podem ser desenvolvidas no âmbito da atenção básica.
Termos de indexação: Hábitos alimentares. Estudo de intervenção. Lipídeos. Estudantes.
I N T R O D U C T I O N
The risk factors associated with the relative and absolute increase in the prevalence of chronic Non-Communicable Diseases (NCD) are also reaching children and already constitute an
important cause of morbidity in this life stage1.
Concern with the morbidity profile of people everywhere led the World Health Organization (WHO) to create a proposal called “Global
Strategy on Diet, Physical Activity, and Health”2.
The general aim of this proposal, also adopted by the Brazilian Ministry of Health, is to promote and protect health by implementing sustainable actions that support healthy lifestyles, relying on the participation of health professionals and
pertinent sectors. Because of the importance of schools in the formation of healthy eating habits, the Interministerial Ordinance nº 1.010, published on May 8, 2006, instituted the guidelines for
promoting healthy eating in schools3. Thus, the
construction and assessment of intervention models made for schools meet the Brazilian Ministry of Health’s expectation and are based on the evidence promulgated by the WHO that positive behavioral changes - especially those that aim to control and reduce the risks associated with poor food choices, physical inactivity, and use of alcohol and tobacco - result in strategies capable of reducing the rates of NCD-related morbidity
The urgent need to stop the growing prevalences of NCD in Brazil justifies studies that attempt to develop effective and sustainable strategies for preventing and controlling these
diseases, by focusing on their main risk factors1,2.
Very few studies in Brazil were created with this purpose, especially youth-oriented studies. Hence, the present study aims to assess the effect of actions promoting healthy eating on the lipid profile of children and adolescents attending municipal elementary schools of a poor neighborhood
located in the outskirts of Salvador, Bahia, Brazil.
M E T H O D S
This is a nine-month controlled intervention study with male and female students aged 7 to 14 years, attending grades first to eighth of two medium-sized schools of a neighborhood of the
Distrito Sanitário do Subúrbio Ferroviário (DSSF,
District of the Railroad Outskirts) of Salvador (BA).
This district is one of the most populous in the city and represents a typical example of the complexity of the social and sanitary problem that characterizes some city areas. Today this area is mostly occupied by people from low socioeconomic classes who suffer with the lack of appropriate
infrastructure and government services5.
The sample size was calculated as follows: an intervention subject-to-control subject ratio of one (1), a statistical power of 0.80, a 95% Confidence Interval (95%CI), and a mean Total
Cholesterol (TC) difference of 0.2 mmol/L6, which
resulted in a sample size of 336 students. An extra 10% was added to account for losses due to student’s refusal to participate in the study, relocation to other cities, and transfer to other schools. Therefore, the initial sample should consist of 372 students, 186 from the intervention school and 186 from the control school. The DSSF has a total of 71 public schools; of these, two were randomly selected for the study, one to be the control and the other, the intervention. All regularly enrolled students of both schools who agreed to participate in the study were included.
The study protocol was approved by the
Research Ethics Committee of the Universidade
Federal da Bahia under Protocol number 18/09. In compliance with ethical precepts, all underweight, overweight, and dyslipidemic students were referred to primary health care units for treatment and follow-up. All guardians signed an Informed Consent Form before the students were included in the study.
The data collected at baseline included biochemical, maturation, and anthropometric measurements and a survey about Fruit and Vegetable (FV) intake. Over the nine-month study period, lectures and workshops discussing the benefits of a healthy lifestyle to promote health were provided to the intervention students. To assess the effects of these actions, all students (intervention and control) were submitted to the same measurements and survey at the end of the study, nine months after the baseline data were collected. Anthropometric assessment consisted of weight and height measurements. Blood was collected to determine the lipid profile: CT, Low Density Lipoprotein-cholesterol (LCL-c), High Density Lipoprotein-cholesterol (HDL-c), and Triglycerides (TG). When possible, the participant’s guardian was invited to answer a questionnaire about the family’s socioeconomic status.
Blood collection for lipid profiling
Five milliliters of blood were collected after a 12-hour fast at school, in an appropriate environment. The blood samples were properly conditioned and transported to the Central
Laboratory of the Complexo Hospitalar
Univer-sitário Professor Edgard Santos, where they were analyzed. Serum TC, HDL-c, and triglycerides were determined by enzymatic methods, and LDL-c was calculated by the Friedewald equation: LDL-c=CT-(HDL+TG/5) when TG exceeds 400 mg/dL. CT<150 mg/dL; LDL-c<100 mg/dL;
HDL-c≥45 mg/dL; and TG <100 mg/dL were
Anthropometric status
Weight was determined by a microelectronic scale of the brand Marte, Model PP 200-50, with a capacity of 199.95 kg and accuracy of 50 g. Height was determined by the stadiometer Leicester Height Measure, with an accuracy of one millimeter. The anthropometric status was
given by the WHO8 reference tables of percentiles
of Body Mass Index (BMI)-for-gender and BMI-for-age. BMI was given by dividing the weight in kilograms by the square of the height in meters.
The classification followed the WHO9 proposal.
Overweight and obesity were grouped together for the analyses. Therefore, the BMI of individuals with excess weight were equal to or above the 85th percentile.
Maturation stage
Pubertal development was self-assessed based on male and female sexual characteristics. The age of menarche was also collected. For girls, Tanner Stage II marked the beginning of puberty, and menarche, postpuberty. For boys, Tanner Stage III of genital development marked the beginning of the pubertal growth spurt and Stage
V, the end of puberty10,11. Hence, the students
were grouped into three categories: prepubertal (category of reference), pubertal, and postpubertal.
Food intake: fruits and vegetables
The participants’ FV intake frequency was determined by the Food Frequency Questionnaire (FFQ). Item intake frequency was divided into four categories as follows: never consumes=0; 1 to 3 monthly=1; 1 to 2 weekly=2; 2 to 4 weekly=3;
and ≥4 weekly=4. The intake frequencies of the
food groups were summarized into a single value for each student. This value was given by the
formula: (∑ of the intake frequencies of all foods
in the food group)/number of foods in the group *the maximum frequency provided by the study
FFQ12. The resulting scores were stratified into
two categories, having the 75th percentile as the
cut-off point (percentile <p75% versus percentile
≥p75%category of reference).
Collection of socioeconomic and demographic data
A structured questionnaire collected these data. The socioeconomic level of the family was given by the mother’s education level, which was
classified as follows: I ≤ fourth grade; II ≥ fifth
grade (category of reference). The demographic variables
were: gender (male (category of reference); female) and
age group (<10 years (category of reference);and ≥10 years).
The intervention protocol covered three major axes
1. The student: This axis regarded actions to keep students within a healthy weight range. Six pertinent classes were provided to promote healthy eating and physical activity, each lasting fifty minutes, over the nine-month intervention. The subjects covered during each class were: a) the importance of a healthy diet and physical activity for health promotion; b) the food pyramid, introduction of the food groups, their nutrients, and their functions in the body; c) the importance of drinking water; d) promotion of physical activity at school; e) sugar: the villain in caries; and f) the
ten steps to a healthy diet13. Next, short videos
taken from the Internet were shown to the students, commented, and discussed.
2. The teacher and cooks: The intervention for the school staff involved training the teachers and cooks. Three one-hour workshops on healthy eating were provided. They focused on the food preparation techniques and good food handling practices needed for preparing healthy and safe school meals and encouraged the use of locally produced and minimally processed fresh foods;
families. Their objective was to inform and motivate students and their families to adopt healthy eating habits.
The subjects covered in the workshops for all categories were: a) food groups, their nutrients, and their respective functions in the body, in addition to their representations in the food pyramid; and b) the ten steps for promoting a
healthy diet at school13. Problematization
followed, with a discussion about healthy eating and food preparation techniques as health-protecting factors.
All activities (lectures and workshops) planned for the intervention protocol were performed by a dietician who collaborated with the study.
Data analysis
The questionnaires were reviewed, checking the answer and the code of each question and correcting errors possibly caused by coding. The database was constructed in the software Epi-Info version 6.0, which was then checked for discrepancies, conflicting simple variable frequencies, and answer coherence.
The population was characterized by descriptive analysis using proportion for categorized data and mean ± standard deviation for the continuous variables.
Analysis of Covariance (Ancova) assessed the influence of the intervention program on the lipid profile and anthropometric changes. The dependent variables were the changes that occurred in TC, HDL-c, LDL-c, and triglycerides during the study period. The main independent variable was the intervention itself (yes/no). The biochemical parameters were assessed at baseline and end of the intervention. The estimates were
adjusted as recommended by the literature14-20
and the study dataset. Baseline age, gender, maturation stage, and BMI were the adjustment variables in Ancova. Two-tailed tests were also
used and the significance level was set to 5%. The data were treated by the Statistical Package Social Sciences (SPSS) version 13.0.
R E S U L T S
Characteristics of the study population at baseline
When the study began, 718 students were enrolled in both schools and 531 were attending classes. Of the 272 intervention students, 227 underwent blood collection and anthropometric assessment (Figure 1). Of the 259 control students, 259 underwent anthropometric assessment, and 155 underwent blood collection. At the end of the follow-up, 142 and 192 intervention students underwent anthropometric assessment and blood collection, respectively; and 137 and 60 control students underwent anthropometric assessment and blood collection, respectively. Most losses were due to dropping out of school and refusal to participate in the second stage of the study. Hence, 202 students were effectively studied to assess the effect of actions promoting healthy eating and physical activity on the lipid profile. Of these, 53.1% were females, most aged less than 10 years (69.9%); 11.9% were malnourished; 78.7% were normal weight; and 11.1% had excess weight, being 6.9% overweight and 4.2% obese. Most (66.6%) students had high TC, 45.9% had high LDL-c, 47.1% had low HDL-c, and 26.8% had high triglycerides. Many (75.1%) had inadequate FV intake (data not shown).
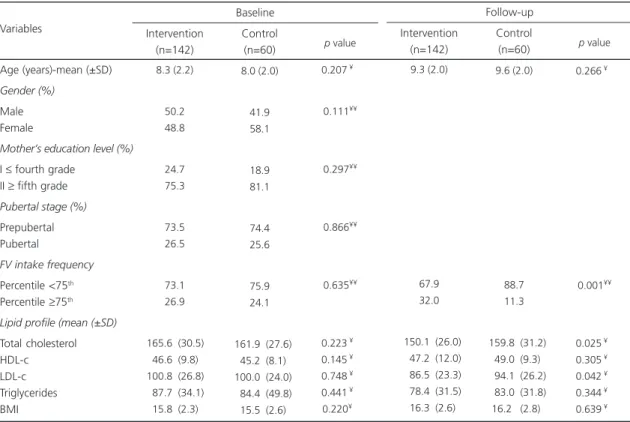
The sociodemographic, anthropometric, biochemical, and FV intake characteristics of the two groups at baseline were similar (Table 1). After the nine-month intervention, the intervention group was consuming significantly more FV than
the control group (p<0.001).
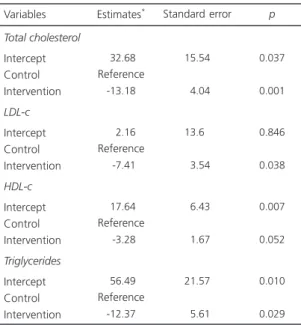
(p=0.001), 7.41 mg/dL (p=0.038), and 12.37 mg/dL
(p=0.029), respectively. These results were
adjusted for age, gender, maturation stage, and BMI. Models including the variable mother’s education level as indicator of socioeconomic status were tested. However, since the regression parameters did not change and the sample size was small, it was decided to be kept the parsimonious model (Table 2).
D I S C U S S I O N
This study was planned to assess how the actions of a program designed to encourage healthy eating impacted the lipid profile of children and adolescents enrolled in municipal
schools of Salvador (BA). This is a study developed
in an epidemiological landscape characterized by a high prevalence of dyslipidemia, excess weight, and low FV intake. This scenario, similar to that of the Brazilian and other youth in the last
decades4,21,22, indicates the need of creating and
implementing effective and integrated strategies
for reducing cardiovascular risk factors2. The
results found herein are in agreement with those that demonstrate that actions promoting healthy eating and/or regular physical activity have a positive impact on the lipid profile of children and
adolescents6,23. Unquestionably, a strong ally of
the study results is the biological plausibility of the existing associations. Dyslipidemia may be credited to physical inactivity and inappropriate food patterns, that is, patterns with a prevalence of energy-dense foods, such as foods high in fats and simple carbohydrates, to the detriment of
Table 1. Sociodemographic, lipid profile, and fruit and vegetable intake data of the groups at baseline and end of the intervention.
Salvador (BA), Brazil, 2011.
Age (years)-mean (±SD)
Gender (%)
Male Female
Mother’s education level (%)
I ≤ fourth grade II ≥ fifth grade
Pubertal stage (%)
Prepubertal Pubertal
FV intake frequency
Percentile <75th
Percentile ≥75th
Lipid profile (mean (±SD)
Total cholesterol HDL-c LDL-c Triglycerides BMI Variables 8.3 (2.2) 50.2 48.8 24.7 75.3 73.5 26.5 73.1 26.9
165.6 (30.5) 046.6 (9.8) 100.8 (26.8) 087.7 (34.1) 015.8 (2.3)
Intervention (n=142) 8.0 (2.0) 41.9 58.1 18.9 81.1 74.4 25.6 75.9 24.1
161.9 (27.6) 045.2 (8.1) 100.0 (24.0) 084.4 (49.8) 015.5 (2.6)
Control (n=60)
0.207 ¥ ¥
0.111¥¥
0.297¥¥
0.866¥¥
0.635¥¥
0.223 ¥ ¥
0.145 ¥ ¥
0.748 ¥ ¥
0.441 ¥ ¥
0.220¥ ¥
p value
Baseline
9.3 (2.0)
67.9 32.0
150.1 (26.0) 047.2 (12.0) 086.5 (23.3) 078.4 (31.5) 016.3 (2.6)
Intervention (n=142)
9.6 (2.0)
88.7 11.3
159.8 (31.2) 049.0 (9.3) 094.1 (26.2) 083.0 (31.8) 016.2 (2.8)
Control (n=60)
0.266 ¥ ¥
0.001¥¥
0.025 ¥ ¥
0.305 ¥ ¥
0.042 ¥ ¥
0.344 ¥ ¥
0.639 ¥ ¥
p value
Follow-up
Note: ¥Student’s t test;¥¥χ2 Pearson’s Chi-square test.
FV: Fruits and Vegetables; HDL-c: High Density Lipoprotein-cholesterol; LDL-c: Low Density Lipoprotein-cholesterol; BMI: Body Mass Index; SD: Standard Deviation.
of intervention performed by the present study mainly encourages higher FV intake and the restriction of foods and meals high in sugars,
saturated fats, and trans fats. Such intervention
may be an alternative for preventing childhood dyslipidemia and associated factors. This life stage is critinstruction and planning must be incorporated into food and nutrition education actions, one cannot ignore that the construction is local, that is, it is based on a specific reality as stated by the “Reference Landmark for Food and
Nutrition Education”31.
Study limitations
Even though the number of study dropouts is considered high for a nine-month intervention when compared with studies using similar high-fiber foods, such as fruits and vegetables,
which contain fewer calories and better nutritional
quality24. At the end of the nine-month
follow-up, the intervention students were consuming
more FV than the control students (p<0.001), a
finding corroborated by similar studies13,25. Dietary
fiber content is positively correlated with the
intake of whole grains, fruits, and vegetables26,27.
Fibers increase satiety and reduce appetite, TC
synthesis, and LDL-c synthesis 20,28. Another important
benefit is their action on the gastrointestinal tract, given that they reduce gastrointestinal transit
time, helping to eliminate cholesterol29.
Intervention studies have consistently reported
that fiber intake benefits the lipid profile20,24,28,30
and other health indicators13-20
.
methods13,15 and may have reduced the study power and accuracy, these losses were not unbalanced. That is, the characteristics of the dropouts and completers were similar, indicating the random character of the losses (data not shown).
The non-inclusion of the students’ levels of physical activity should also be mentioned. There is evidence suggesting an association
between physical inactivity and dyslipidemia32-34.
The lack of consistency of the collected physical activity data encouraged excluding this variable from the analysis. Due to logistics, the intake of foods high in saturated fats and/or sugars was not assessed. A higher intake of carbohydrates has been associated with low HDL-c and high
LDL-c and triglycerides35. Nevertheless, FV intake
is one of the food intake indicators used globally
to monitor NCD risk factors35,36.
The possible confounding effect of socioeconomic status was minimized by the
socioeconomic homogeneity of the sample, that is, all participants were from poor families. A wide range of program components was used in the study intervention protocol. Therefore, it is not possible to distinguish which components contributed most to the benefits promoted by the study intervention.
Despite these limitations, one cannot ignore the methodological rigor and the analytical techniques used for controlling potential confounders, reinforcing the findings and the knowledge about the positive influence of nutritional counseling on the lipid profile of children and adolescents.
C O N C L U S I O N
The results show that actions promoting healthy eating improve lipid levels. Once again this finding evidences that the study intervention model may prevent and/or treat cardiovascular risk factors in adolescents. Moreover, these results suggest that the combination of school and home actions can positively impact the health status of this population. The multi-professional approach required by such strategies is also recognized, given that the behavior and lifestyle of individuals and social groups are largely determined by their physical, socioeconomic, and cultural environments.
C O N T R I B U T O R S
RCR SILVA and LA SILVA helped to conceive the study, collect data, analyze and interpret the results, and review the manuscript. MCT CANGUSSU helped to interpret the results and review the manuscript.
R E F E R E N C E S
1. Lim SS, Vos T, Flaxman AD, Danaei G, Shibuya K, Adair-Rohani H, et al. A comparative risk assessment of burden of disease and injury attributable to 67 risk factors and risk factor clusters in 21 regions, 1990-2010: A systematic analysis for the Global Burden of Disease Study 2010. Lancet. 2012; 380(9859):2224-60.
Table 2. Analysis of covariance for the influence of the intervention program on the lipid profile of the intervention students. Salvador (BA), Brazil, 2011.
Total cholesterol
Intercept Control Intervention
LDL-c
Intercept Control Intervention
HDL-c
Intercept Control Intervention
Triglycerides
Intercept Control Intervention
-32.68
Reference
-13.18
0-2.16
Reference 0-7.41
-17.64
Reference 0-3.28
-56.49
Reference
-12.37
15.54
04.04
13.60
03.54
06.43
01.67
21.57
05.61
0.037
0.001
0.846
0.038
0.007
0.052
0.010
0.029
Note: *Regression coefficients adjusted for age, gender, maturation
stage, and body mass index at baseline.
HDL-c: High Density Lipoprotein-cholesterol; LDL-c: Low Density Lipoprotein-cholesterol.
2. World Health Organization. WHA 57.17: Global estrategy on diet, physical and health. Geneva: WHO; 2004 [cited 2013 Sept 7]. Available from: <http://www.who.int/gb/ebwha/pdf_files/WHA57/ A57_R17-en.pdf>.
3. Brasil. Ministério da Saúde. Portaria Interministerial nº 1.010 de 8 de maio de 2006. Institui as diretrizes para a promoção da alimentação saudável nas escolas de educação infantil, fundamental e nível médio das redes públicas e privadas, em âmbito nacional. Brasília: Ministério da Saúde; 2006 [acesso 2013 set 7]. Disponível em: <http://dtr2001. saude.gov.br/sas/PORTARIAS/Port2006/GM/GM-1010.htm>.
4. Barreto SM, Pinheiro ARO, Sichieri R, Monteiro CA, Batista Filho M, Schimidt MI, et al. Análise da estratégia global para alimentação, atividade física e saúde da Organização Mundial da Saúde. Epidemiol Serv Saúde. 2005; 14(1):41-68. 5. Carvalho IMM, Pereira GC. Como anda Salvador e
sua região metropolitana. 2ª ed. Salvador: Edufba; 2008.
6. Reed KE, Warburton DE, MacDonald HM, Naylor PJ, McKay HA. Action Schools! BC: A school-based physical activity intervention designed to decrease cardiovascular disease risk factors in children. Prev Med. 2008; 46(6):525-31.
7. Back Giuliano Ide C, Caramelli B, Pellanda L, Duncan B, Mattos S, Fonseca FH. I guidelines of prevention of atherosclerosis in childhood and adolescence. Arq Bras Cardiol. 2005; 85(Suppl 6):4-36. 8. Onis M, Onyango AW, Borghi E, Siyam A, Nishida
C, Siekmann J. Development of a WHO growth reference for school-aged children and adolescents. Bull World Health Organ. 2007; 85(9):660-7. 9. World Health Organization. WHO Child Growth
Standards: Length/height-for-age w-f-a, weight-for-length, weight-for-height and body mass index-for-age: Methods and development. Geneva: WHO; 2006.
10. Marshall WA, Tanner JM. Variations in the pattern of pubertal changes in boys. Arch Dis Child. 1970; 45(239):13-23.
11. Marshall WA, Tanner JM. Variations in pattern of pubertal changes in girls. Arch Dis Child. 1969; 44(235):291-303.
12. Neumann AIlCP, Shirassu MM, Fisberg RM. Consumo de alimentos de risco e proteção para doenças cardiovasculares entre funcionários públi-cos. Rev Nutr. 2006; 19(1):19-28. doi: 10.1590/ S1415-527320060000100002
13. Brasil. Ministério da Saúde. Secretaria de Atenção à Saúde. Manual operacional para profissionais de
saúde e educação: promoção da alimentação saudável nas escolas Brasília: Ministério da Saúde; 2008. Série A. Normas e Manuais Técnicos. 14. Perry CL, Bishop DB, Taylor G, Murray DM, Mays
RW, Dudovitz BS, et al. Changing fruit and vegetable consumption among children: The 5-a-Day Power Plus program in St. Paul, Minnesota. Am J Public Health. 1998; 88(4):603-9.
15. Reynolds KD, Franklin FA, Binkley D, Raczynski JM, Harrington KF, Kirk KA, et al. Increasing the fruit and vegetable consumption of fourth-graders: Results from the high 5 project. Prev Med. 2000; 30(4):309-19.
16. Robertson W, Thorogood M, Inglis N, Grainger C, Stewart-Brown S. Two-year follow-up of the ‘Families for Health’ programme for the treatment of childhood obesity. Child Care Health Dev. 2012; 38(2):229-36.
17. Tuuri G, Zanovec M, Silverman L, Geaghan J, Solmon M, Holston D, et al. “Smart Bodies” school wellness program increased children’s knowledge of healthy nutrition practices and self-efficacy to consume fruit and vegetables. Appetite. 2009; 52(2):445-51.
18. Nasser R, Cook SL, Dorsch KD, Haennel RG. Comparison of two nutrition education approaches to reduce dietary fat intake and serum lipids reveals registered dietitians are effective at disseminating information regardless of the educational approach. J Am Diet Assoc. 2006; 106(6):850-9.
19. Lock K, Pomerleau J, Causer L, Altmann DR, McKee M. The global burden of disease attributable to low consumption of fruit and vegetables: Implications for the global strategy on diet. Bull World Health Organ. 2005; 83(2):100-8.
20. Hosseinpour-Niazi S, Mirmiran P, Sohrab G, Hosseini-Esfahani F, Azizi F. Inverse association between fruit, legume, and cereal fiber and the risk of metabolic syndrome: Tehran Lipid and Glucose Study. Diabetes Res Clin Pract. 2011; 94(2): 276-83.
21. Margetts B. WHO global strategy on diet, physical activity and health [Editorial]. Public Health Nutr. 2004; 7(3):361-3.
22. Chopra M, Galbraith S, Darnton-Hill I. A global response to a global problem: The epidemic of overnutrition. Bull World Health Organ. 2002; 80(12):952-8.
23. Tershakovec AM, Shannon BM, Achterberg CL, McKenzie JM, Martel JK, Smiciklas-Wright H, et al.
One-year follow-up of nutrition education for hypercholesterolemic children. Am J Public Health. 1998; 88(2):258-61.
25. Zhu WL, Feng NP, Ma J, Wang Y, Ye GJ. The effect of dietary intervention on lipidemia in school-aged children. Zhonghua Liu Xing Bing Xue Za Zhi. 2003; 24(9):794-7.
26. Larsson SC, Mannisto S, Virtanen MJ, Kontto J, Albanes D, Virtamo J. Dietary fiber and fiber-rich food intake in relation to risk of stroke in male smokers. Eur J Clin Nutr. 2009; 63(8):1016-24. 27. Hamulka J, Wawrzyniak A, Sosinska S. Evaluation
of dietary fibre, soluble and insoluble fibre food intake in Polish households in years 1996-2005. Rocz Panstw Zakl Hig. 2008; 59(2):211-21. 28. Romero AL, Romero JE, Galaviz S, Fernandez ML.
Cookies enriched with psyllium or oat bran lower plasma LDL cholesterol in normal and hypercholesterolemic men from Northern Mexico. J Am Coll Nutr. 1998; 17(6):601-8.
29. Rosado JL, del RAM, Montemayor K, Garcia OP, Caamano MC. An increase of cereal intake as an approach to weight reduction in children is effective only when accompanied by nutrition education: A randomized controlled trial. Nutr J. 2008; 7:28. 30. Katcher HI, Legro RS, Kunselman AR, Gillies PJ,
Demers LM, Bagshaw DM, et al. The effects of a whole grain-enriched hypocaloric diet on cardiovascular disease risk factors in men and women with metabolic syndrome. Am J Clin Nutr. 2008; 87(1):79-90.
31. Brasil. Ministério do Desenvolvimento Social e Com-bate à Fome. Marco de referência de educação alimentar e nutricional para as políticas públicas.
Brasília: Ministério do Desenvolvimento Social e Combate à Fome; 2012.
32. Owen CG, Nightingale CM, Rudnicka AR, Sattar N, Cook DG, Ekelund U, et al. Physical activity, obesity and cardiometabolic risk factors in 9- to 10-year-old UK children of white European, South Asian and black African-Caribbean origin: The Child Heart And health Study in England (CHASE). Diabetologia. 2010; 53(8):1620-30.
33. Biolo G, Ciocchi B, Stulle M, Piccoli A, Lorenzon S, Dal Mas V, et al. Metabolic consequences of physical inactivity. J Ren Nutr. 2005; 15(1):49-53.
34. Mohan V, Gokulakrishnan K, Deepa R, Shanthirani CS, Datta M. Association of physical inactivity with components of metabolic syndrome and coronary artery disease: The Chennai Urban Population Study (CUPS nº 15). Diabet Med. 2005; 22(9):1206-11. 35. Santos RD, Gagliardi ACM, Xavier HT, Magnoni CD,
Cassani R, Lottenberg AM, et al. I Diretriz sobre o consumo de gorduras e saúde cardiovascular. Arq Bras Cardiol. 2013; 100(1 Supl 3):1-40.
36. World Health Organization. Diet, nutrition and the prevention of chronic diseases. Report of a Joint WHO/FAO expert Consultation. Geneva: WHO; 2003. Technical Report Series, nº 916.