Excess weight, Arterial Pressure and Physical Activity in Commuting
to School: Correlations
Kelly S. Silva and Adair S. Lopes
Programa de Pós-Graduação em Educação Física (PPGEF) - Centro de Desporto (CDS), Florianópolis, SC - Brazil
Summary
Background: The prevalence of obesity and elevated arterial pressure (AP) has increased in children and adolescents, whereas physical activity has decreased.
Objective: To identify and correlate excess weight, body fat and elevated AP among active and passive students with the way they commute to school.
Methods: One thousand five hundred and seventy students aged 7 to 12 years participated in the study conducted in João Pessoa, state of Paraíba. Students completed a questionnaire about the way they commuted to school (active = walking/ biking or passive = by car/motorcycle/bus) and the time spent traveling to school. Excess weight was determined by BMI ≥ 25 kg/m2, excess body fat as ≥ 85th percentile for tricipital fold measurement, and high AP as ≥90th percentile. Chi-square test and Poisson’s regression were used for the analysis.
Results: BActive commuting was associated with a lower prevalence of excess weight and body fat as compared to passive commuting (p<0.05). The prevalence ratio (PR) of excess weight was associated with excess body fat (Male: PR= 6.45 95%CI= 4.55-9.14; Female: PR= 4.10 95%CI= 3.09-5.45), elevated SAP [Systolic Arterial Pressure] (Male: PR= 1.99 95%CI= 1.30-3.06; Female: PR= 2.09 95%CI= 1.45-3.01), and elevated DAP [Diastolic Arterial Pressure] in girls (PR = 1.96 95%CI= 1.41-2.75). No association with active commuting was observed (p>0.05).
Conclusion: Passive commuting to school showed a correlation with excess weight and body fat but not with elevated AP. Excess weight was associated with excessive body fat and elevated AP. Excess weight should be prevented as a way to avoid fat accumulation and AP elevation. (Arq Bras Cardiol 2008;91(2):84-91)
Key words: Overweight; obesity; hypertension; motor activity; child.
Mailing address: Kelly S. Silva •
Rua Cônego João de Deus, 145 - 58.050-360 - Castelo Branco I, João Pessoa, PB – Brazil
E-mail: [email protected]
Manuscript received October 31, 2007; revised received December 18, 2007; accepted January 03, 2008.
Introduction
Obesity and high arterial pressure (AP) have increased dramatically in children and adolescents, whereas physical activity has decreased proportionally1. Over the past decades, the level of physical activity has decreased for several reasons, such as the increased use of motor vehicles to commute to school, longer time spent in sedentary activities and less participation in organized sports2. These changes resulted in adverse effects on physical and mental health, increasing exposure to risk situations and reducing opportunities of one leading a healthy lifestyle.
Walking to school is frequently associated with increased physical activity among students from several countries3,4, whereas passive transportation has been associated with a 12-20% reduction in meeting physical activity guidelines and a 17-22% increase in the prevalence of sedentarism5. However, few investigators have examined the contribution
of active commuting in reducing the prevalence of excess weight, arterial hypertension and other risk factors.
Research conducted with adolescents and young adults has shown that excess weight was greater among students who went to school by bus or car when compared to those who walked or biked3,6. In North Carolina, overweight youngsters were 46% less likely to walk to school than those with a normal weight7. However, other studies conducted in Melbourne8 and Tehran9 have not reported any association between the type of commuting and being overweight.
how long does it normally take for you to get to school? (less than 10 minutes, 10-20 minutes or more than 20 minutes). The reproducibility of these questions measured during the test/retest showed a 0.95 intra-class correlation coefficient.
The anthropometric measurements followed standardized rules22. A Plenna digital scale was used to measure body mass (kg), and a measuring tape fixed to the wall was used to determine height (cm). The tricipital skin fold (TSF) was measured with a Harpenden calliper, and the mean value obtained from two readings made at two-minute intervals was recorded. The skinfold measurement was made by two experienced examiners, with <2% technical error between intra- and inter-observer, and 0.97 intra-class correlation coefficient (95%CI= 0.95-0.98).
Classification of excess weight (Overweight + Obesity) was made using age- and gender-specific BMI cut-off values
≥25 kg/sq2, according to those proposed by the International
Obesity Task Force (IOTF)23. Excess of body fat was defined as
tricipital skin fold ≥ the 85th percentile, distributed by gender and age, according to the criteria proposed by Must et al24.
AP reading was taken in the afternoon by the auscultatory method, using an aneroid sphygmomanometer (Missouri Indústria e Comércio Ltda.) and a pediatric stethoscope. Device calibration was checked periodically and the cuff sizes were appropriate for arm circumferences. After the subject had been resting for 5 minutes in a sitting position, the AP was read with the right arm positioned at heart level; two readings were made with a minimum five-minute interval between them, and the lower value was recorded. The systolic arterial pressure (SAP) was determined at the occurrence of sounds (Korotkoff phase I) and the diastolic arterial pressure (DAP) at the disappearance of the sounds (Korotkoff phase V). Arterial pressure cut-off values were based on percentile tables by gender, age, and height. High AP was defined as SAP and/or DAP values equal to or greater than the 90th percentile, according to the classification proposed by The Fourth Report on the Diagnosis, Evaluation, and Treatment of High Blood Pressure in Children and Adolescents25.
Measurements were taken in the classroom using the circuit method, except for arterial pressure, which was measured in a private room. After having completed the questionnaire (15-20 minutes), students’ anthropometric (10-(15-20 minutes) and arterial pressure measurements (20-30 minutes) were taken. The staff in charge consisted of a nurse, five physical education students, and two physical education professionals. Students were considered active commuters when they went to school walking or by bike and passive commuters when they were taken by motor vehicles. The time intervals to get from home to school were analyzed separately and as groups.
The Chi-square test was used to compare the frequency of excess weight, excess body fat and high AP among the students who where active commuters and those who were passive commuters, considering gender, age bracket and type of school. Poisson’s regression was used following two adjustment models; in the first model, age, time spent commuting and type of school were considered; and in the second, adjustments were made for all variables studied. This procedure was applied in three different analyses: Considering that active commuting to school increases
the chances of students being more active, and that physical activity may contribute to maintaining healthy body weight, normal body fat proportions and blood pressure levels, this study sought to investigate the prevalence and association between excess weight, excess body fat and high AP among students who actively commuted vs those who passively commuted to school.
Material and methods
This study is part of an epidemiological cross-sectional survey on the prevalence and factors associated with cardiovascular diseases among students in the city of João Pessoa, state of Paraíba. The survey was conducted from April to September 2005, after approval by the Universidade Federal da Paraíba Research Ethics Committee (RG 129/03).
The study population included Elementary School students, 7 to 12 years of age, of both genders. The sampling process was performed in three phases: I – the city was divided into five districts, according to the City Health Office; II – Municipal public and private schools; and III – Classes (1st-4th graders). Of the 248 Elementary Schools in the city, those attended only by girls (n=10), those that did not offer all grade levels or those with less than thirty students (n=88) were excluded. Of the 150 eligible schools, 15 (10 public and 5 private) were selected and 3 in each district were evaluated.
The proposal by Luiz & Magnanini19 for epidemiological studies was chosen to calculate the size of the sample, considering a 95% confidence interval, a 3% level of tolerable error, and an estimated 60% prevalence of sedentarism20. Since cluster sampling (intact groups) was used, a 1.6 design effect and a minimum sample size of 1,497 students were defined; also, for safety reasons, an additional 10% were included to compensate for incidental losses. According to the sampling plan, 1,647 apparently healthy students who were not undergoing any medical treatment were enrolled in the study.
Of these 1,647 youth, 3.6% (n= 60) did not fit the study’s age bracket requirements, and 1.0% (n= 17) students missed the test day or refused to have their measurements taken. The final sample consisted of 1,570 (808 boys and 762 girls), a sample size that maintained the initial statistical power and representativeness of the study population. The principals and teachers of the selected schools, as well as the parents and their children, were informed about the objectives and procedures of the study and, after having given their written consent, data collection began.
1 - Excess body weight; 2 – Excess body fat; 3 – High AP. In all tests applied, a probability lower than 0.05 (p<0.05) was considered a statistically significant difference. Age brackets were classified according to what is proposed by the World Health Organization26.
Results
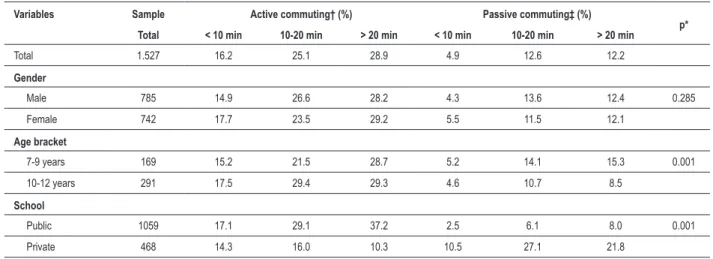
Of the students who actively commuted to school (70%), 25% lived within a 10-20 minute walking distance and 29% lived more than 20 minutes walking distance. Of the passive commuters (30%), 12.6% were taken by car in a 10-20 minute ride, and 12.2% in a ride longer than 20 minutes. There were no differences between genders (p>0.05); however, the frequency of active commuting was greater among students from 10 to 12 years of age and among those who attended public schools, when compared to students aged 7 to 9 years and those who attended private schools (p<0.05) (Table 1).
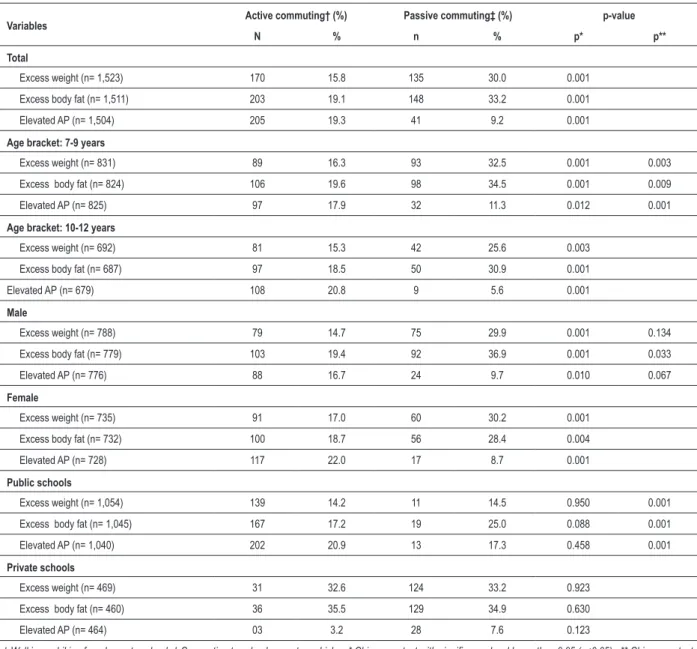
Excess weight and excess body fat were more frequent and high AP was less frequent among passive commuters compared to those who were active (p<0.05). Boys had a greater excess of body fat when compared to girls (p<0.05). As to ages and type of school, rates of excessive weight and excessive body fat were higher among the younger students and those attending private schools, whereas AP was higher among the older students who actively commuted and those who attended public schools (p<0.05) (Table 2).
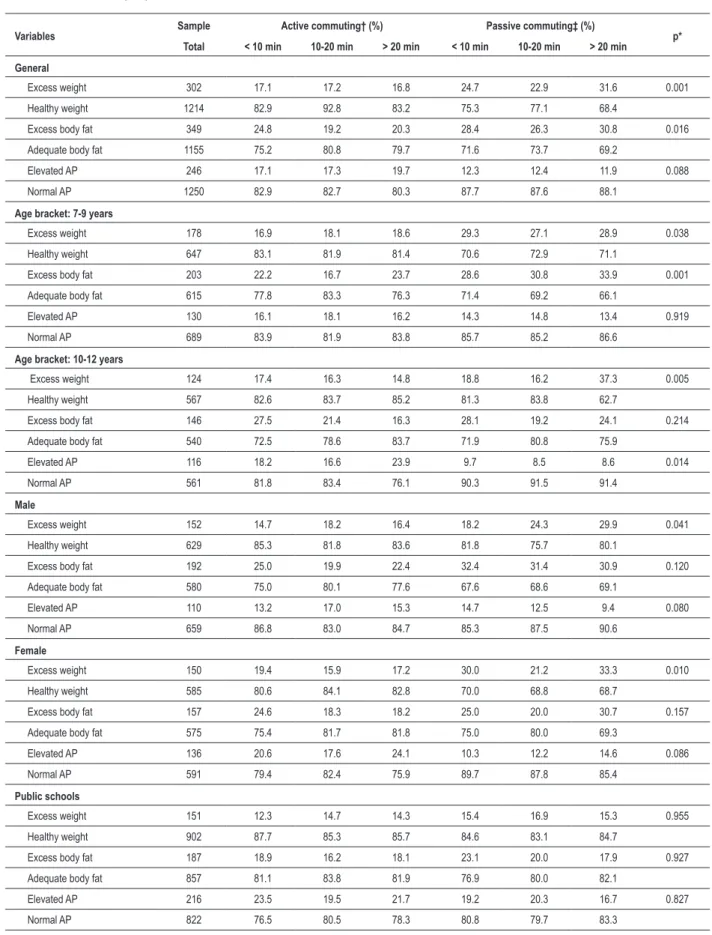
Considering the mode of commuting and time spent traveling to school, the frequency of excessive weight was 17% among those who walked or biked, and 23% to 32% among those who were taken by motor vehicles (p<0.05). Excessive body fat was greater among passive commuters (26 to 32%) or those who were active commuters but traveled less than 10 minutes (25%), relative to those who had to
walk/bike ≥10 minutes (p<0.05). Regarding the time spent commuting, no differences were observed in the frequency of high AP among active and passive commuters (p>0.05).
For both genders and age brackets and students in private schools, active commuting was associated with lower rates of excessive weight when compared to those students who were passive commuters (p<0.05) (Table 3).
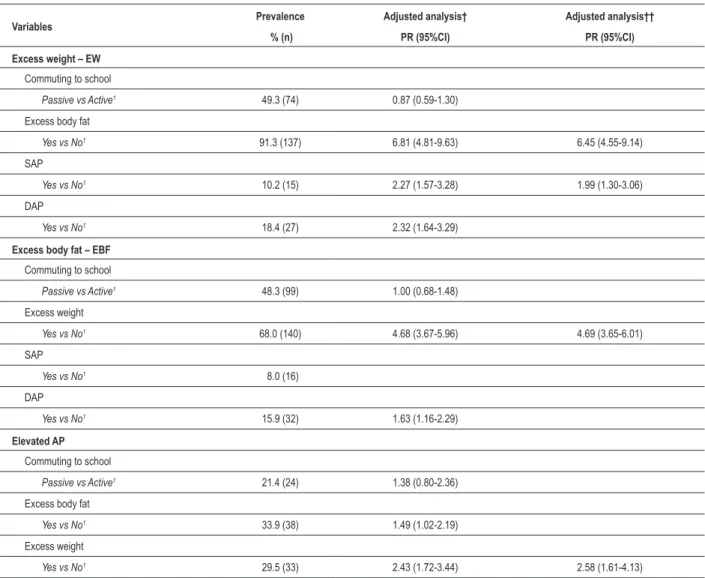
Prevalence and prevalence ratios were analyzed as to excess weight, excess of body fat and high AP by gender. In the male group (Table 4), the analysis model adjusted for all variables showed that excessive weight was associated with excessive body fat (PR= 6.45; 95%CI= 4.55-9.14) and high SAP (PR= 1.99; 95%CI= 1.30-3.06); and excessive body fat and high AP were associated with excessive weight (PR= 4.69; 95%CI= 3.65-6.01; and PR = 2.58; 95%CI= 1.61-4.13), respectively.
In the female group, (Table 5), the adjusted analysis model indicated an association of excessive weight with excessive body fat (PR= 4.10; 95%CI= 3.09-5.45), high SAP (PR= 2.09; 95%IC= 1.45-3.01) and high DAP (PR= 1.96; 95%IC= 1.41-2.75). Both excess body fat and high AP showed an association only with the excess weight (PR= 4.30; 95%CI= 3.28-5.63; and PR= 2.69; 95%CI= 1.97-3.68).
Discussion
In this study, more than half of the students who actively commuted to school traveled ten or more minutes, and of the 30% who used other modes of transportation, the trip to school lasted more than twenty minutes for only 12% of them. Active commuting to school was associated with a lower prevalence of excess weight and excess body fat compared to passive commuting. Similar results were recorded for North-American adolescents3,6,7,14, whereas other studies found no association with excess weight 9 or excess body fat3,4.
Considering the time spent traveling to school, the type of commuting did not alter the frequency of high AP. The relationship between arterial blood pressure and physical activity is not yet fully established for this age range, and some studies report an association11 whereas others do not12,13.
Table 1 - Mode of transportation and time spent commuting from home to school by sex, age and type of school - João Pessoa, PB, 2005.
Variables Sample Active commuting† (%) Passive commuting‡ (%)
p*
Total < 10 min 10-20 min > 20 min < 10 min 10-20 min > 20 min
Total 1.527 16.2 25.1 28.9 4.9 12.6 12.2
Gender
Male 785 14.9 26.6 28.2 4.3 13.6 12.4 0.285
Female 742 17.7 23.5 29.2 5.5 11.5 12.1
Age bracket
7-9 years 169 15.2 21.5 28.7 5.2 14.1 15.3 0.001
10-12 years 291 17.5 29.4 29.3 4.6 10.7 8.5
School
Public 1059 17.1 29.1 37.2 2.5 6.1 8.0 0.001
Private 468 14.3 16.0 10.3 10.5 27.1 21.8
Table 2 - Frequency (%) of excess weight, excess body fat and elevated AP considering the mode of transportation to school - João Pessoa, PB, 2005.
Variables Active commuting† (%) Passive commuting‡ (%) p-value
N % n % p* p**
Total
Excess weight (n= 1,523) 170 15.8 135 30.0 0.001
Excess body fat (n= 1,511) 203 19.1 148 33.2 0.001
Elevated AP (n= 1,504) 205 19.3 41 9.2 0.001
Age bracket: 7-9 years
Excess weight (n= 831) 89 16.3 93 32.5 0.001 0.003
Excess body fat (n= 824) 106 19.6 98 34.5 0.001 0.009
Elevated AP (n= 825) 97 17.9 32 11.3 0.012 0.001
Age bracket: 10-12 years
Excess weight (n= 692) 81 15.3 42 25.6 0.003
Excess body fat (n= 687) 97 18.5 50 30.9 0.001
Elevated AP (n= 679) 108 20.8 9 5.6 0.001
Male
Excess weight (n= 788) 79 14.7 75 29.9 0.001 0.134
Excess body fat (n= 779) 103 19.4 92 36.9 0.001 0.033
Elevated AP (n= 776) 88 16.7 24 9.7 0.010 0.067
Female
Excess weight (n= 735) 91 17.0 60 30.2 0.001
Excess body fat (n= 732) 100 18.7 56 28.4 0.004
Elevated AP (n= 728) 117 22.0 17 8.7 0.001
Public schools
Excess weight (n= 1,054) 139 14.2 11 14.5 0.950 0.001
Excess body fat (n= 1,045) 167 17.2 19 25.0 0.088 0.001
Elevated AP (n= 1,040) 202 20.9 13 17.3 0.458 0.001
Private schools
Excess weight (n= 469) 31 32.6 124 33.2 0.923
Excess body fat (n= 460) 36 35.5 129 34.9 0.630
Elevated AP (n= 464) 03 3.2 28 7.6 0.123
† Walking or biking from home to school; ‡ Commuting to school on motor vehicles; * Chi-square test with signiicance level lower than 0.05 (p<0.05). ** Chi-square test with signiicant level lower than 0.05 for the calculation of differences between genders, age brackets and type of school.
It is known that cross-sectional epidemiological studies do not allow the inference of a causal relationship between physical activity and arterial pressure. However, longitudinal18,27 and interventional studies11 have shown a strong connection, especially in long-term follow-up programs.
Regarding the age bracket and type of school, both excess weight and excess body fat were greater among younger students and in private schools, compared to older students and in public schools. Another study reported similar results28. AP was greater among older students and in those who attended public schools. The modified behavior of AP in older subjects may be associated with biological maturation, a time of considerable changes in body size and hormones.
Other non-controlled factors that may influence arterial pressure are environmental, social and economic in nature. A study conducted with Italian children showed that compared to those with high incomes, low-income families have lower educational levels, are more likely to face greater adversities and restrictions in daily life17, and are thus more susceptible to high levels of stress, inadequate eating and sleeping patterns, and blood pressure abnormalities. In Finland, a longitudinal study showed that high educational levels were associated with lower SAP levels15.
Table 3 -Frequency (%) of excess weight, excess body fat and elevated AP considering the mode of transportation and time spent commuting to school - João Pessoa, PB, 2005.
Variables Sample Active commuting† (%) Passive commuting‡ (%) p*
Total < 10 min 10-20 min > 20 min < 10 min 10-20 min > 20 min
General
Excess weight 302 17.1 17.2 16.8 24.7 22.9 31.6 0.001
Healthy weight 1214 82.9 92.8 83.2 75.3 77.1 68.4
Excess body fat 349 24.8 19.2 20.3 28.4 26.3 30.8 0.016
Adequate body fat 1155 75.2 80.8 79.7 71.6 73.7 69.2
Elevated AP 246 17.1 17.3 19.7 12.3 12.4 11.9 0.088
Normal AP 1250 82.9 82.7 80.3 87.7 87.6 88.1
Age bracket: 7-9 years
Excess weight 178 16.9 18.1 18.6 29.3 27.1 28.9 0.038
Healthy weight 647 83.1 81.9 81.4 70.6 72.9 71.1
Excess body fat 203 22.2 16.7 23.7 28.6 30.8 33.9 0.001
Adequate body fat 615 77.8 83.3 76.3 71.4 69.2 66.1
Elevated AP 130 16.1 18.1 16.2 14.3 14.8 13.4 0.919
Normal AP 689 83.9 81.9 83.8 85.7 85.2 86.6
Age bracket: 10-12 years
Excess weight 124 17.4 16.3 14.8 18.8 16.2 37.3 0.005
Healthy weight 567 82.6 83.7 85.2 81.3 83.8 62.7
Excess body fat 146 27.5 21.4 16.3 28.1 19.2 24.1 0.214
Adequate body fat 540 72.5 78.6 83.7 71.9 80.8 75.9
Elevated AP 116 18.2 16.6 23.9 9.7 8.5 8.6 0.014
Normal AP 561 81.8 83.4 76.1 90.3 91.5 91.4
Male
Excess weight 152 14.7 18.2 16.4 18.2 24.3 29.9 0.041
Healthy weight 629 85.3 81.8 83.6 81.8 75.7 80.1
Excess body fat 192 25.0 19.9 22.4 32.4 31.4 30.9 0.120
Adequate body fat 580 75.0 80.1 77.6 67.6 68.6 69.1
Elevated AP 110 13.2 17.0 15.3 14.7 12.5 9.4 0.080
Normal AP 659 86.8 83.0 84.7 85.3 87.5 90.6
Female
Excess weight 150 19.4 15.9 17.2 30.0 21.2 33.3 0.010
Healthy weight 585 80.6 84.1 82.8 70.0 68.8 68.7
Excess body fat 157 24.6 18.3 18.2 25.0 20.0 30.7 0.157
Adequate body fat 575 75.4 81.7 81.8 75.0 80.0 69.3
Elevated AP 136 20.6 17.6 24.1 10.3 12.2 14.6 0.086
Normal AP 591 79.4 82.4 75.9 89.7 87.8 85.4
Public schools
Excess weight 151 12.3 14.7 14.3 15.4 16.9 15.3 0.955
Healthy weight 902 87.7 85.3 85.7 84.6 83.1 84.7
Excess body fat 187 18.9 16.2 18.1 23.1 20.0 17.9 0.927
Adequate body fat 857 81.1 83.8 81.9 76.9 80.0 82.1
Elevated AP 216 23.5 19.5 21.7 19.2 20.3 16.7 0.827
Table 3 - continuation
Variables Sample Active commuting† (%) Passive commuting‡ (%) p*
Total < 10 min 10-20 min > 20 min < 10 min 10-20 min > 20 min
Private schools
Excess weight 151 30.3 27.4 37.5 29.8 26.0 45.1 0.042
Healthy weight 312 69.7 72.6 62.5 70.2 74.0 54.9
Excess body fat 162 40.9 31.5 38.3 31.3 29.6 41.6 0.366
Adequate body fat 298 59.1 68.5 61.7 68.7 70.4 58.4
Elevated AP 30 0.0 8.1 4.2 8.5 8.2 7.9 0.260
Normal AP 428 100.0 91.9 95.8 91.5 91.8 92.1
† Walking or biking from home to school; ‡ Commuting to school on motor vehicles; * Chi-square test with signiicance level lower than 0.05 (p<0.05).
Table 4 – Prevalences and Prevalence Ratios (PR) adjusted for weight, body fat and elevated AP in the male group.
Variables Prevalence Adjusted analysis† Adjusted analysis††
% (n) PR (95%CI) PR (95%CI)
Excess weight – EW
Commuting to school
Passive vs Active1 49.3 (74) 0.87 (0.59-1.30)
Excess body fat
Yes vs No1 91.3 (137) 6.81 (4.81-9.63) 6.45 (4.55-9.14)
SAP
Yes vs No1 10.2 (15) 2.27 (1.57-3.28) 1.99 (1.30-3.06)
DAP
Yes vs No1 18.4 (27) 2.32 (1.64-3.29)
Excess body fat – EBF
Commuting to school
Passive vs Active1 48.3 (99) 1.00 (0.68-1.48)
Excess weight
Yes vs No1 68.0 (140) 4.68 (3.67-5.96) 4.69 (3.65-6.01)
SAP
Yes vs No1 8.0 (16)
DAP
Yes vs No1 15.9 (32) 1.63 (1.16-2.29)
Elevated AP
Commuting to school
Passive vs Active1 21.4 (24) 1.38 (0.80-2.36)
Excess body fat
Yes vs No1 33.9 (38) 1.49 (1.02-2.19)
Excess weight
Yes vs No1 29.5 (33) 2.43 (1.72-3.44) 2.58 (1.61-4.13) 1 Reference variable - 1.00; †adjusted for age (years), time spent commuting from home to school and type of school (public and private); ††analysis adjusted for all
variables, remaining in the model those with signiicance level lower than 0.05 (p<0.05).
studies13,29,30 have shown a strong association between high AP and excess weight. A prospective epidemiological study showed that boys (8-15 years of age) with BMI between the
In Australia, a longitudinal study assessed every three years observed that the chance of an individual having high AP or hypertension in adulthood (25 years) was 53% greater among overweight or obese men compared to those whose weight was within normal ranges18.
In this study, the behavior of arterial pressure was not associated with the mode of transportation to school. A research conducted with Chinese adults indicated an association between active commuting to work (31-60 minutes) and reduced arterial pressure relative to those who took a bus to work10. Among students in the city of Vitória, state of Espirito Santo, no correlation was found between maximal oxygen consumption and arterial pressure13, and, among students from João Pessoa, PB30 (14-17 years of age) and from New Delhi12, there was no association with physical activity.
Information about the modes of transportation to school was provided by the students,which may lead to an overestimate or underestimate of the answers. However, the excellent degree
of reproducibility of the questionnaire and the existence of studies that use this methodology warrant these results. Arterial pressure was read at one single timepoint; therefore, it is not indicated for describing the prevalence of hypertension. Nevertheless, this measurement has been commonly used in association studies. It is suggested that further research of the same nature be undertaken, and that other factors (measurement of energy expenditure during commuting, contribution to physical activity level) and associations (obesity, hypertension, diabetes) be investigated.
The students who actively commuted to school were less overweight and had less excess body fat when compared to those who were taken by car, and arterial pressure was dissociated from the type of commuting when the time spent traveling to school was examined. In the adjusted analysis, excess body weight increased the prevalence ratio of students presenting excess body fat and high SAP, as well as high DAP in girls. Both excess body fat and high AP were associated only
Table 5 – Prevalences and Prevalence Ratios (PR) ajusted for excess weight, body fat and elevated AP in the female group.
Variables Prevalence Adjusted analysis† Adjusted analysis††
% (n) PR (95%CI) PR (95%CI)
Excess weight - EW
Commuting to school
Passive vs Active1 39.7 (60) 1.09 (0.72-1.66)
Excess body fat
Yes vs No1 72.4 (110) 4.00 (3.04-5.27) 4.10 (3.09-5.45)
SAP
Yes vs No1 11.4 (17) 2.54 (1.73-3.74) 2.09 (1.45-3.01)
DAP
Yes vs No1 26.8 (40) 2.43 (1.75-3.38) 1.96 (1.41-2.75)
Excess body fat - EBF
Commuting to school
Passive vs Active1 40.5 (60) 1.17 (0.75-1.82)
Excess weight
Yes vs No1 73.3 (110) 4.06 (3.12-5.30) 4.30 (3.28-5.63)
SAP
Yes vs No1 11.6 (17) 0.82 (0.40-1.70)
DAP
Yes vs No1 23.8 (35) 1.10 (0.73-1.66)
Elevated AP
Commuting to school
Passive vs Active1 12.7 (17) 0.74 (0.46-1.20)
Excess body fat
Yes vs No1 29.4 (40) 1.21 (0.83-1.76)
Excess weight
Yes vs No1 32.8 (45) 2.40 (1.79-3.23) 2.69 (1.97-3.68) 1 Reference variable= 1.00; †adjusted for age (years), time spent commuting from home to school and type of school (public and private); ††analysis adjusted for all
References
1. Williams CL, Hayman LL, Daniels SR, Robinson TN, Steinberger J, Paridon S, et al. Cardiovascular and health in childhood: a statement for health professionals from the Committee on Atherosclerosis, Hypertension, and Obesity in the Young (AHOY) of the Council on Cardiovascular, Disease in the Young, American Heart Association. Circulation. 2002; 106: 143-60.
2. Centers for Disease Control and Prevention - CDC. Barriers to children walking to or from School - United States, 2004. MMWR Morb Mortal Wkly Rep. 2005; 54 (38): 949-52.
3. Heelan KA, Donnelly JE, Jacobsen DJ, Mayo MS, Washburn R, Greene L. Active commuting to and from school and BMI in elementary school children preliminary data. Child Care Health Dev. 2005; 31: 341-9.
4. Cooper AR, Weddercopp N, Wang H, Andersen LB, Froberg K, Page AS. Active travel to school and cardiovascular fitness in danish children and adolescents. Med Sci Sports Exerc. 2006; 38: 1724-31.
5. Tudor-Locke C, Neff LJ, Ainsworth BE, Addy CL, Popkin BM. Omission of active commuting to school and the prevalence of children’s health-related physical activity levels: the Russian Longitudinal Monitoring Study. Child Care Health Dev. 2002; 28: 507-12.
6. Gordon-Larsen P, Nelson MC, Beam K. Associations among active transportation, physical activity, and weight status in young adults. Obes Res. 2005; 13: 868-75.
7. Evenson KR, Huston SL, Mcmillen BJ, Bors P, Ward DN. Statewide prevalence and correlates of walking and bicycle to school. Arch Pediatr Adolesc Med. 2003; 157: 887-92.
8. Timperio A, Ball K, Salmon J, Roberts R, Giles-Corti B, Simmons D, et al. Personal, family, social, and environmental correlates of active commuting to school. Am J Prev Med. 2006; 30: 45-51.
9. Moayeri H, Bidad K, Aghamohammadi A, Rabbani A, Anari S, Nazemi L, et al. Overweight and obesity and their associated factors in adolescents in Tehran, Iran, 2004-2005. Eur J Pediatr. 2006; 165: 489-93.
10. Hu G, Pekkarinen H, Hanninen O, Yu Z, Guo Z, Tian H. Commuting, leisure-time physical activity, and cardiovascular risk factors in China. Med Sci Sports Exerc. 2002; 34: 234-8.
11. Hansen HS, Froberg D, Hyldebrandt N, Nielsen JR. A controlled study of eight months of physical training and reduction of blood pressure in children: the Odense schoolchild study. BMJ. 1991; 303: 682-6.
12. Singh AK, Maheshwari A, Sharma N, Anand K. Lifestyle associated risk factors in adolescents. Indian J Pediatr. 2006; 73: 901-6.
13. Rodrigues NA, Moyses MR, Bissoli NS, Pires JGP, Abreu GR. Cardiovascular risk factors in a population of Brazilian schoolchildren. Braz J Med Biol Res. 2006; 39: 1637-42.
14. Rosenberg DE, Sallis JF, Conway TL, Cain KL, Mckenzie TL. Active transportation to school over 2 years in relation to weight status and physical activity. Obesity. 2006; 14: 1771-6.
15. Kivimäki M, Kinnunen M, Pitkänen T, Vahtera J, Elovainio M, Pulkkinen L. Contribution of early and adult factors to socioeconomic variation in blood
pressure: thirty-four–year follow-up study of school children. Psychosom Med. 2004; 66: 184-9.
16. Ribeiro JC, Guerra S, Oliveira J, Andersen LB, Duarte JA, Mota J. Body fatness and clustering of cardiovascular disease risk factors in portuguese children and adolescents. Am J Hum Biol. 2004; 16: 556-62.
17. Barba G, Troiano E, Russo P, Strazzullo P, Siani A. Body mass, fat distribution and blood pressure in Southern Italian children: results of the ARCA project. Nutr Metab Cardiovasc Dis. 2006; 16 (4): 239-48.
18. Burke V, Beilin LJ, Dunbar D, Kevan M. Associations between blood pressure and overweight defined by new standards for body mass index in childhood. Prev Med. 2004; 38: 558-64.
19. Luiz RR, Magnanini MMF. A lógica da determinação do tamanho da amostra em investigações epidemiológicas. Cad Saúde Coletiva. 2000; 8: 9-28.
20. Hallal PC, Bertoldi AD, Gonçalves H, Victora CG. Prevalência de sedentarismo e fatores associados em adolescentes de 10-12 anos de idade. Cad Saúde Pública. 2006; 22: 1277-87.
21. Barros MVG, Assis MAA, Pires MC, Grossemann S, Vasconcelos FAG, Luna MEP, et al. Desenvolvimento e validação do questionário dia típico de atividades físicas e de alimentação. In: Barros MVG, Nahas MV. Medidas da atividade física: teoria e aplicação em diversos grupos populacionais. Londrina: Midiograf; 2003.
22. Lohman TG, Roche AF, Martorell R. Anthropometric standardization reference manual. Illinois: Human Kinetics Books; 1988.
23. Cole TJ, Bellizzi MC, Flegal KM, Dietz WH. Establishing a standard definition for child overweight and obesity worldwide: international survey. BMJ. 2000; 320: 1240-3.
24. Must A, Dallal GE, Dietz WH. Reference data for obesity: 85th and 95th percentiles of body mass index (wt/ht2) and triceps skinfold thikness. Am J Clin Nutr. 1991; 53: 839-46.
25. National High Blood Pressure Education Program Working Group on Hypertension Control in Children and Adolescents. The Fourth Report on the diagnosis, evaluation, and treatment of high blood pressure in children and adolescents. Pediatrics. 2004; 114: 555-76.
26. Physical status: the use and interpretation of anthropometry. Report of a WHO Expert Committee. World Health Organ Tech Rep Ser. 1995; 854: 1-452.
27. Field AE, Nancy RC, Matthew WG. Weight status in childhood as a predictor of becoming overweight or hypertensive in early adulthood. Obes Res. 2005; 13: 163-9.
28. Costa RF, Cintra IP, Fisberg M. Prevalência de sobrepeso e obesidade em escolares da cidade de Santos, SP. Arq Bras Endocrinol Metab. 2006; 50: 60-7.
29. Monego ET, Brandão PC, Jardim V. Determinantes de risco para doenças cardiovasculares em escolares. Arq Bras Cardiol. 2006; 87: 37-45.
30. Silva KS, Farias Júnior JC. Fatores de risco associados à pressão arterial elevada em adolescentes. Rev Bras Med Esp. 2007; 13: 237-40.
with excess weight. In conclusion, it is necessary to prevent excess weight to avoid the accumulation of fat and increased AP. For this end, it is suggested that children be encouraged to engage in physical activities on their way to school and during their free time, as well as to adopt healthy eating habits.
Acknowledgements
We would like to express our appreciation to Francisco M. Silva for his direct participation in the elaboration of the project and to the trainees at the Laboratório de Estudos e Pesquisa do Movimento Humano – LEPEM/UFPB (Laboratory of Studies and Research on Human Movement) who took part in the extensive data collection and tabulation. We are also thankful to the principals, teachers and students of the
schools selected for data collection.
Potential Conflict of Interest
No potential conflict of interest relevant to this article was reported.
Sources of Funding
There were no external funding sources for this study.
Study Association