Place and type of meals
consumed by adults in
medium sized cities
Programa de Pós-Graduação em Epidemiologia. Universidade Federal de Pelotas. Pelotas, RS, Brasil
Correspondence:
Juliana Pires Carús
Rua Marechal Deodoro, 1160 3° piso Centro 96020-220 Pelotas, RS, Brasil
E-mail: [email protected] Received: 1/29/2013
Approved: 9/20/2013
Article available from: www.scielo.br/rsp
ABSTRACT
OBJECTIVE: To describe the meals consumed by adults living in a midsize city in the South of Brazil, according to the place and preparation.
METHODS: A population-based cross-sectional study was conducted in Pelotas, Southern Brazil, in 2012. The two-stage sampling design used the 2010 census tracts as primary sampling units. Data were collected on the place of meals (at home or out) and on the kind of preparations consumed at home (homemade, snacks, take away food) covering the two days prior to the interview, using a standardized questionnaire.
RESULTS: The study included 2,927 adults, of which 59.0% were female, 60.0% were below 50 years of age and 58.0% were in work. Data were collected on 11,581 meals consumed on the two days preceding the interview, 25.0% were consumed outside of the home at lunchtime, and 10.0% at dinnertime. Considering home meals, most participants reported eating food prepared at home at both lunch and dinner. The majority of out-of-home meals (64.0% for lunch and 61.0% for dinner) were consumed in the work place, mostly based on food prepared at home. Individuals eating out of home were mostly male, young and highly educated. The occupational categories that ate at restaurants more often were trade workers, businessmen, teachers and graduate professionals.
CONCLUSIONS: Despite the changes in eating patterns described in Brazil in recent years, residents of medium-sized towns still mostly eat at home, consuming homemade food.
DESCRIPTORS: Food Habits. Food Consumption. Feeding Behaviour. Population Surveys. Cross-Sectional Studies.
Juliana Pires CarúsI
Giovanny V A FrançaI
Changes to the population’s lifestyle, due to global-ization and urbanglobal-ization have led to changes in eating patterns and behavior.6-8,13,14 Lack of time to prepare and eat food has stimulated the food industry to develop new techniques for conserving and preparing food, providing a greater variety of ready to eat options.7,8,11 Moreover, certain foods have become globalized, having been introduced into different cultural and economic contexts.8,11,12
In Brazil, in recent decades, changes have been observed in individual’s eating habits; not only has intake of ultra-processed foods increased,11 but also the locations in which meals are eaten and the types of food eaten has changed.
In the United States, spending on eating out, in relation to total food spending, increased from 26.0% in 1970, to 39.0% in 1996, and reached 42.0% in 2002.a In Brazil, comparing data form the Household Budget Surveys (POF) from 2003-2003 and 2008-2009, we can see that the increase in mean monthly spending on eating out increased (from 24.1% to 31.1%),b especially in fast food restaurants, the number of which also increased, adapting to this demand.4,5
The aim of this study was to describe meals eaten by adults regarding the place and type of food consumed in a medium sized city in the South of Brazil.
METHODS
This was a descriptive population-based cross-sectional study conducted in the city of Pelotas, in the South of Brazil, between February and June 2012. This study is part of an academic study on the health of the popu-lation of Pelotas, called the research consortium.2 The sampling design involved two stages, using census tracts from the 2010 Demographic Censusc as the primary sample unit. The tracts were selected with probability proportional to their size, after being sorted according to geographic location. Within each tract, a
ixed number of residences was selected, producing a
self-weighted sample.
To estimate the sample size, in the absence of local information, a prevalence of 50.0% of meals eaten out was considered, maximizing the total sample size. A
95% conidence level was used, with acceptable error
of three percentage points. The result obtained was increased by 10.0% to allow for losses and refusals, INTRODUCTION
and by another 50.0%, to take into account a design effect of 1.5. The minimum necessary sample was esti-mated to be 1,759 adults. Given that the study had other
objectives that required more individuals, the inal study
sample included 3,120 adults.
The meals – lunch and dinner – consumed by the inter-viewees in the two days preceding the interview were studied in relation to two aspects: (1) the place where they were consumed (at home, pay-by-weight restau-rant, ala carte restaurant, snack bar/pizzeria or work-place); and (2) type of food consumed. The types were pre-coded, which limited the response options. For meals eaten at home, the types of food recorded were: homemade meals, homemade snacks, frozen meals, take-away meals and snacks. For meals consumed outside of the home, information was collected on the type of restaurant or place, assuming that in these cases
the place would also deine the type of meal consumed:
pay-by-weight restaurant, ala carte restaurant, fast food restaurant, pizzeria, workplace or other.
Due to the limitation in the number of questions imposed by the research consortium, the type of prepa-ration consumed in the workplace was investigated in a subsample, interviewed by telephone. This subsample was selected systematically for each occupational cate-gory. Ten individuals were selected for each category, with the exception of the teachers, where only nine indi-viduals responded that they had eaten at work or another place outside of the home in the two days preceding the interview. In total, there were 89 telephone interviews. Each individual was asked whether they had brought food from home to work, otherwise, where and what kind of food they had eaten.
The demographic and socioeconomic variables studied were: sex, age, schooling, economic level according to the National Economic Indicator (IEN),1 based on household assets and head of household schooling.
Occupation was classiied based on the Brazilian
Occupation Classiication (CBO),d totaling nine
cate-gories: (1) out of work; (2) domestic employment, including maid, janitor, cook, butler, nanny, security, gardener, housekeeper; (3) general work or cleaner in a company; (4) technical, services, trade: civil servants, drivers, supervisors, freelance; (5) businessmen, shop owners: managers, small business, executives, directors; (6) industrial services, construction, truck loading and unloading, locksmith, factory workers, mason, painter, electrician, joiner, welder, carpenter;
a Lin B-H, Frazão E, Guthrie J. Away-from-home foods increasingly important to quality of American diet. Agric Inform Bull (Washington DC).
1999;(749):1-22.
b Instituto Brasileiro de Geografia e Estatística. Pesquisa de orçamentos familiares 2008-2009: despesas, rendimentos e condições de vida. Rio
de Janeiro: IBGE; 2010.
(7) higher education professionals: nutritionists, lawyers, agronomists, psychologists, physicians, and other; (8) teachers and education professionals; (9) others: this category included less common occupa-tions, such as members of the armed forces, police,
and ire department.
The data collection was carried out by 30 trained inter-viewers. Training lasted 40 hours and included carrying out a pilot study in a census tract not selected for the study sample.
Quality control was conducted in 10.0% of the sample, through a second interview, based on a subset of the original questions. The question relating to this study was: “Is there a day of the week on which you usually eat out for lunch?”
The analyses, performed using Stata version 12.1, always took into account the sample design. The sample was described, presenting absolute and rela-tive frequencies of the socioeconomic and demo-graphic characteristics. The percentage of meals eaten out of home on the two days preceding the interview
was estimated for lunch and dinner, stratiied by the
independent variables analyzed. Fisher’s exact test was used to test for differences between the groups regarding the proportion of meals which were eaten
out, adopting a 5% level of signiicance.
Based on the subsample of individuals interviewed by telephone, we estimated the total percentage of meals which were prepared at home and brought to work. As
a ixed number of individuals were interviewed in each
occupational category, each group was weighted when a global estimate was calculated, yielding a representa-tive value for the population.
The study was approved by the Ethics Committee of the Faculty of Medicine, Universidade Federal de Pelotas (OF.77/11). All the interviews took place at
the subject’s home, after the informed consent form had been signed.
RESULTS
In total, 3,120 eligible adults were identiied for the
study and 2,927 were successfully interviewed. Losses and refusals were 9.3% of the eligible sample. For the question used in the quality control interviews, a Kappa
coeficient of 0.73 (p < 0.001) was found.
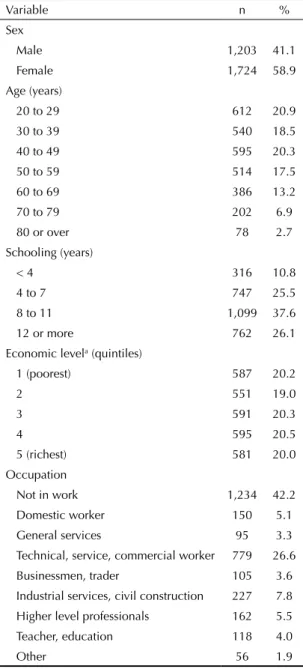
Table 1 shows the characteristics of the sample, of which 58.9% were female, 59.7% were aged under 50 and 63.7% had more than eight years of schooling. Regarding occupation, 42.2% were not in work, a group which included students and pensioners, as well as the unemployed. The most common occupational group was that composed of technical, services and commerce
workers (26.6%), which covered a wide variety of func-tions. Next came the groups of industrial services and construction (7.8%), higher level professionals (5.5%) and domestic employees (5.1%).
Each individual was asked about their meals – lunch and dinner – consumed on the two days preceding the interview. Information was obtained on 11,581 meals, with 25.0% and 9.7% of lunches and dinners consumed outside of the home, respectively (Table 2). Men, indi-viduals aged 20 to 29 years, those with 12 or more years of education, as well as domestic employees were those who most frequently ate lunch outside of the home.
Concerning dinner, the proile was similar, except for
Table 1. Socioeconomic and demographic characteristics of
the sample. Pelotas, RS, Southern Brazil, 2012. (N = 2,927)
Variable n %
Sex
Male 1,203 41.1
Female 1,724 58.9
Age (years)
20 to 29 612 20.9
30 to 39 540 18.5
40 to 49 595 20.3
50 to 59 514 17.5
60 to 69 386 13.2
70 to 79 202 6.9
80 or over 78 2.7
Schooling (years)
< 4 316 10.8
4 to 7 747 25.5
8 to 11 1,099 37.6
12 or more 762 26.1
Economic levela (quintiles)
1 (poorest) 587 20.2
2 551 19.0
3 591 20.3
4 595 20.5
5 (richest) 581 20.0
Occupation
Not in work 1,234 42.2
Domestic worker 150 5.1
General services 95 3.3
Technical, service, commercial worker 779 26.6 Businessmen, trader 105 3.6 Industrial services, civil construction 227 7.8 Higher level professionals 162 5.5
Teacher, education 118 4.0
Other 56 1.9
occupation. Higher level professionals as well as those in other occupations, had the highest percentage of dining outside of the home. Meals consumed outside of the home during working days were mostly at lunch-time (25.2%). On Saturdays and Sundays, dining out was more frequent (11.5%).
The Figure characterizes meals eaten at home and eaten out, according to occupation groups. Eating lunch at home was most common in all groups, with the highest proportion for those who did not work. Groups of domestic employees, general services and industrial services had the highest frequency of eating lunch at
Table 2. Number and percentage of meals eaten outside of the home on the two days preceding the interview. Pelotas, RS,
Southern Brazil, 2012. (N = 11,581)
Variable
Meals outside of the home
Lunch (N = 5,819) Dinner (N = 5,762)
n % n %
Total 1,453 25.0 557 9.7
Sex p = 0.002 p = 0.001
Male 664 27.8 272 11.5
Female 789 23.0 285 8.4
Age (years) p < 0.001 p < 0.001
20 to 29 408 33.5 204 16.9
30 to 39 331 30.8 110 10.3
40 to 49 311 26.4 112 9.5
50 to 59 245 23.9 79 7.8
60 to 69 108 14.0 39 5.1
70 to 79 36 8.9 12 3.0
80 or more 14 9.0 1 0.6
Schooling (years) p < 0.001 p < 0.001
< 4 80 12.7 30 4.8
4 to 7 344 23.0 105 7.1
8 to 11 546 25.0 217 10.0
12 or more 483 31.8 205 13.6
Economic levela (quintiles) p = 0.021 p = 0.233
1 (poorest) 240 20.5 113 9.7
2 296 27.0 80 7.4
3 337 28.7 118 10.2
4 298 25.2 123 10.6
5 (richest) 269 23.3 121 10.6
Occupation p < 0.001 p < 0.001
Not in work 272 11.0 139 5.7
Domestic worker 144 48.2 30 10.1
General services 68 36.6 16 8.7
Technical, service, commercial worker 507 35.8 203 13.2
Businessmen, trader 74 35.7 30 14.5
Industrial services, civil construction 169 37.4 33 7.4
Higher level professionals 106 33.0 53 16.5
Teacher 78 33.2 32 13.7
Other 35 31.5 20 17.8
Day of the week p = 0.657 p = 0.020
Monday to Friday 1,084 25.2 385 9.0
Saturday and Sunday 369 24.4 172 11.5
work or in another place. Teachers, higher level profes-sionals and business men or commerce workers, on the other hand, had the highest percentages of eating in pay-by-weight restaurants. Concerning dinner, there was a large predominance, in all categories, of eating at home, with a greater share of snacks prepared at home, compared with lunchtime.
Table 3 shows the type of food consumed at home, and where meals outside of the home were made. Meals eaten at home were most frequently prepared at home, both for lunch (95.6%) and for dinner (66.5% homemade meals and 30.1% of homemade snacks). The majority of meals eaten out of home were in the work-place or in a work-place referred to as “other” in the ques-tionnaire – both at lunchtime (64.3%) and dinnertime (61.1%). The second most common place was pay-by-weight restaurants at lunchtime (28.8%) and fast food restaurants or pizzerias for dinner (23.6%).
The majority of the individuals interviewed by telephone who had reported a meal in the workplace said that they had consumed food brought from home. The exception was the occupational group labeled as “other”, including mostly armed forces and police members, who reported eating lunch in a refectory. The proportion of individuals bringing food from home varied from 70.0% in the busi-nessmen group to 100% in the group of domestic, general or industrial service workers. The mean proportion for all occupational groups was 91.0% of meals based on food brought from home (data not shown).
Using this estimate of 91.0% of food consumed in the workplace being homemade, it was possible to eval-uate the total percentage of meals reported in which homemade food was consumed. For meals eaten at home, 96.5% of them were based on homemade food. In meals eaten outside of the home, 55.9% of them were of homemade food Overall, homemade food was the base of 89.4% of the meals.
Table 3. Type of homemade meals and place of meals eaten outside of the home. Pelotas, RS, Southern Brazil, 2012.
Type of food consumed at home
Meal
Homemade food
Homemade
snack Tupperware Frozen meal Bought snack Total
n % n % n % n % n % n %
Lunch 4,166 95.6 80 1.8 81 1.9 18 0.4 13 0.3 4,358 100.0
Dinner 3,432 66.5 1,556 30.1 23 0.5 27 0.5 126 2.4 5,164 100.0 Place of meals consumed outside of the home
Meal
Pay-by-weight restaurant
A la carte restaurant
Snack bar or pizzeria
Workplace or
other Total
n % n % n % n % n %
Lunch 413 28.8 68 4.7 31 2.2 921 64.3 1,433 100.0 Dinner 29 5.4 53 9.9 127 23.6 328 61.1 537 100.0
Figure. Location and type of meal according to occupation. Pelotas, RS, Southern Brazil, 2012. (lunch: N = 5,791; dinner: N = 5,699)
Lunch Dinner
Other
Teachers, education
Higher level professionals
Service industry
Businessmen, trade
Service, technicians
General service
Domestic employees
Not in work
0% 20% 40% 60% 80% 100% 0% 20% 40% 60% 80% 100%
At home, homemade food Outside of the home, pay-by-weight restaurant
At home, homemade snack Outside of the home, workplace or other location
DISCUSSION
This population based study, conducted in a medium
sized city in the South of Brazil, identiied high percent -ages of meals eaten at home, with the majority of meals eaten being homemade. Meals eaten outside of the home were predominantly consumed at work, or in pay-by-weight restaurants. No differences were observed regarding the day of the week, although there were differences according to occupation.
The results contradict the general perception that in
everyday life in Brazil a signiicant share of food
consumed is fast food and is eaten outside of the home.
This study, in a medium sized city, relects a reality
which probably differs from that of state capitals or large cities. In the situation studied, it was easier to eat at home due to shorter travelling times. Moreover, the reports indicated a lack of cafeterias in companies.
Studies in developed countries which approach the consumption of meals outside of the home, such as those of Guthrie9 and Kant,10 have shown that, since the 1970s, eating patterns have been characterized by decreasing consumption of homemade food and an increase in meals eaten out. A study in Belgium found that 35.0% of individuals consumed at least 25.0% of their daily calorie intake outside the home.14
Brazilian studies have also shown high percentages of food eaten outside of the home, around 40.0%e with a positive association between eating out and being overweight.4
However, it was observed that only 16.0% of total energy intake came from food outside of the home. This may be explained by the type of food consumed, with only 28.0% of meals eaten in restaurants, regardless of the type of meal consumed – fast food, pay-by-weight or other.3
In this study, it was observed that around 90.0% of meals reported in the two days preceding the interview were
based on homemade food. This inding is in contrast to
the prevailing opinion in the literature, that increased spending on ready to eat meals and eating out means that there is a high consumption of ready to eat or industrial-ized food in Brazil. It cannot be denied that the impor-tance of this type of food has increased, but increased spending does not imply (not used in this case) consump-tion of primarily this type of food. Moreover, in Brazil, the price of ready to eat food, especially industrialized food, is very high, which restricts its use by the majority of the population, although from the point of view of spending, the percentage is much higher than its percentage of food intake. This study concerns adults and the ques-tions were applied individually, meaning that individual
consumption was identiied, rather than household, as is
the case in food spending studies. In the context of the
study, a medium sized city in the interior, homemade food predominated in individual’s food intake.
Even in the Unites States, where fatty foods and ready meals are commonly adopted, studies of eating out trends show that the mean number of meals eaten out per week went from 2.5 to 2.8 between 1987 and 2000, and that the percentage of individuals who ate out six or more times went from 12.0% to 15.0% in the same period.10 Based on this information, it can be concluded that a large part of meals in the United States are also consumed at home, although there is no data on the type of food consumed.
Some limitations need to be considered when inter-preting the results of this study. One concerns the fact that meals consumed in the workplace were not inves-tigated. This information was obtained later, from a subsample. Even so, the panorama which presented itself was unmistakable. Choosing to examine the two days preceding the interview optimized the capacity to remember exactly what was consumed, but it has some drawbacks. First, the fact that the two days are consec-utive, in the majority of cases, including two working days. Second, Friday and Saturday were underrepre-sented, as a low number of interviews were conducted on Sundays. Moreover, verifying the foods consumed individually on the two preceding days does not explain
the consumption of meals, but when veriied for groups
of individuals, it allows the meals consumed in a typical week to be characterized.
In order to correctly interpret our results one needs to bear in mind that only the main meals (lunch and dinner) were investigated. We did not gather information about snacks, tidbits or other foods consumed between main meals. The approach differs from most of the available literature based on national surveys that focus on food groups and energy content.3,4
We also sought to evaluate in more detail the differ-ences per occupational category, as this is important
for drawing up health policies. We veriied that there
were significant differences and that the group of domestic, industrial and civil construction and general services workers – those who are least specialized – are those who most commonly eat homemade food. More specialized groups and those who work in commercial services, on the other hand, make most frequent use of pay-by-weight restaurants.
This set of data should serve to guide new, more in-depth studies of this panorama and to prevent policies on obesity and food guidance from neglecting the domestic environment and homemade food. It is in this context that the vast majority of meals eaten by adults are prepared.
e Instituto Brasileiro de Geografia e Estatística. Pesquisa de orçamentos familiares 2008-2009: análise do consumo alimentar pessoal no Brasil.
1. Barros AJD, Victora CG. A nationwide wealth score based on the 2000 Brazilian demographic census. Rev Saude Publica. 2005;39(4):523-9. DOI:10.1590/S0034-89102005000400002
2. Barros AJD, Menezes AMB, Santos IS. O Mestrado do Programa de Pós-graduação em Epidemiologia da UFPel baseado em consórcio de pesquisa: uma experiência inovadora. Rev Bras Epidemiol. 2008;11(Supl 1):133-44. DOI:10.1590/S1415-790X2008000500014
3. Bezerra IN, Sichieri R. Eating out of home and obesity: a Brazilian nationwide survey. Public Health Nutr. 2009;12(11):2037-43. DOI:10.1017/S1368980009005710
4. Bezerra IN, Sichieri R. Characteristics and spending on out-of-home eating in Brazil. Rev Saude Publica. 2010;44(2):221-9. DOI:10.1590/S0034-89102010000200001
5. Bleil SI. O padrão alimentar ocidental: considerações sobre a mudança de hábitos no Brasil. Cad Debate. 1998;6:1-25.
6. Dave JM, An LC, Jeffery RW, Ahluwalia JS. Relationship of attitudes toward fast food and frequency of fast-food intake in adults. Obesity (Silver Spring). 2009;17(6):1164-70. DOI:10.1038/oby.2009.26
7. Diez Garcia RW. Práticas e comportamento alimentar no meio urbano: um estudo no centro da cidade de São Paulo. Cad Saude Publica. 1997;13(3):455-67. DOI:10.1590/S0102-311X1997000300021
8. Diez Garcia RW. Reflexos da globalização na cultura alimentar: considerações sobre as mudanças na alimentação urbana. Rev Nutr. 2003;16(4):483-92. DOI:10.1590/S1415-52732003000400011
9. Guthrie JF, Lin BH, Frazao E. Role of food prepared away from home in the American diet, 1977-78 versus 1994-96: changes and consequences. J Nutr Educ Behav. 2002;34(3):140-50. DOI:10.1016/S1499-4046(06)60083-3
10. Kant AK, Graubard BI. Eating out in America, 1987-2000: trends and nutritional correlates. Prev Med. 2004;38(2):243-9. DOI:10.1016/j.ypmed.2003.10.004
11. Monteiro CA, Levy RB, Claro RM, Castro IR, Cannon G. A new classification of foods based on the extent and purpose of their processing. Cad Saude Publica. 2010;26(11):2039-49. DOI:10.1590/S0102-311X2010001100005
12. Monteiro CA, Levy RB, Claro RM, Castro IR, Cannon G. Increasing consumption of ultra-processed foods and likely impact on human health: evidence from Brazil. Public Health Nutr. 2011;14(1):5-13. DOI:10.1017/S1368980010003241
13. Ortiz-Hernandez L, Gomez-Tello BL. Food consumption in Mexican adolescents. Rev Panam Salud Publica. 2008;24(2):127-35. DOI:10.1590/S1020-49892008000800007
14. Vandevijvere S, Lachat C, Kolsteren P, Van Oyen H. Eating out of home in Belgium: current situation and policy implications. Br J Nutr. 2009;102(6):921-8. DOI:10.1017/S0007114509311745
This study was supported by the Coordenação de Aperfeiçoamento de Pessoal de Nível Superior (CAPES – Master’s grant – PROEX 337/2010).