*e-mail: [email protected]
Characterization and Three-dimensional Reconstruction of
Pores of Self-reducing Pellets Done by EAF Dust
Elisa Pinto da Rocha*, José Adilson de Castro
Programa de Pós-graduação em Engenharia Metalúrgica – PPGEM, Universidade Federal Fluminense – UFF, Av. dos Trabalhadores, 420, CEP 27255-125, Volta Redonda, RJ, Brazil
Received: October 4, 2012; Revised: September 22, 2013
This work focused on the characterization physical and microstructural of the self-reducing pellet made of Electric Arc Furnace (EAF) dust using different low cost techniques. The serial sectioning technique was used to evaluate detailed measurements of pore connections, tortuositiy of pores and porosity distribution. The chemical analysis using Inductively Coupled Plasma Atomic Emission Spectroscopy (ICPAES), Scanning Electron Microscopy (SEM), Optical Microscopy (OM) and X-ray diffraction were carried out to identify the common phases presented in EAF dust agglomerate. It was observed that the pellet phase composition is formed by iron as magnetite, metallic iron, wustite, and zinc ferrite. The visualization of the reconstructed 3D microstructure provided average qualitative and quantitative analysis of the porosity (41.61%), a consistent result and in accordance with that obtained by pycnometry technique (41.53%). As expected, these results are more precise when compared with the result obtained by two-dimensional technique (23.41%). In addition, it was calculated the value of the tortuosity parameter (0.84) that suggested a morphological structure closest to cylindrical shape.
Keywords: 3D reconstruction, serial sectioning, self-reducing pellet, EAF dust
1. Introduction
The detailed characterization of raw materials in the steel industry is recognized as an important tool to warranty the quality of steel product and largely applied on the development of new processes based on raw materials
such as ultraine iron ores, dust and solid residues from
the steel industry. For instance, in agglomerates, some microstructural parameters are relevant to study the inner phenomena that take place into the reduction processes; such as the mineralogical composition, size distribution of particles, porosity and pore connectivity within these agglomerates. The raw material used to produce pellets and sinters in the iron ore sintering process can be obtained from several sources, such as, iron ore or dust recycling within the steelworks1. There are many environmental and economic beneits in recycling large amount of waste materials and
energy, but, in the case of pellet and sinter produced with addition of electric arc furnace dust, it is necessary to predict the quality of the produced pellet due its impact in the production of pig iron. The chemical composition of the agglomerates will play important role in the formation of phases and consequently, in the thermodynamic and kinetic phenomena that take place into the subsequent processes. Despite of large amount of iron present in EAF dust (Fe3O4, FeO, Fe2O3, Fe particles), some impurities such as zinc, cadmium and chromium are bottleneck for the technologies that have been proposed, since high concentration of zinc leads to producing complex phases, as, zinc ferrite (ZnFe2O4), zinc silicates (ZnSiO2) and zinc oxide (ZnO), and contains also, toxic components like
lead, cadmium, arsenic and chromium, which would have environment load2. Some metallographic two-dimensional
techniques like optical and electronic microscopy and X-ray diffraction have been used to characterize pellets with limited results. Wagner et al.3, developed a method
to quantify porosity in iron ore pellets using digital images obtained by optical microscope. Iglesias4, characterized the
sinter by digital images in optical microscope, identifying main phases like magnetite, hematite, ferrites, silicates and pores. However, in the mentioned studies and others5-9,
were not considered the inherent three-dimensional characteristics of the pore structures. Rodrigues et al.10,
performed a study about 3D reconstruction of the porous structure of Ti-6Al-4V alloy by serial sectioning, and the visualization of the microstructure provided a qualitative and quantitative analysis of the porosity of the alloy at different temperatures and demonstrated the feasibility of this technique to obtain detailed information regarding pore connectivity and morphology. On the other hand, the high temperature process used to treat the agglomerates of
waste materials strongly depends on the diffusion of luids
within particles which is strongly affected by the porosity distributions and topology. An important parameter to
estimate the porous topology is the tortuosity that relects
the material anisotropy11. The tortuosity parameter can
be regarded as the relation between the effective and the
linear lengths of the pore penetrated by the luids within
the reacting agglomerates. The pore diameter distributions are usually variable and can be connected and cause
disorder in the luid low molecules inside the pore walls
and causes an increasing of the residence time of the luid inside the pellet and the eficiency of reaction is increased
with a higher generation of product or it is decreased due to encapsulating effect of the reaction product into disconnected pores11. Therefore the clariication of luid low and heat transfer phenomena within the pores of the agglomerates offers opportunities to enhance the eficiency
of the unit operation of various industrial processes based on self-reducing agglomerate10,11. In this context, the serial
sectioning technique combined with chemical analysis and thermodynamic calculations are considered of low cost and useful tools to address detailed study on self-reducing agglomerates. The serial sectioning technique consists of three-dimensional numerical reconstruction of the microstructure from consecutive images obtained by optical
microscope, for the supericial thin sections of the sample,
removed by polishing12,13. This technique includes sequential
steps as following: mechanical or chemical polishing of the sample surface; Vickers microhardness measurement; two-dimensional images acquisition in optical microscope; images alignment and three-dimensional reconstruction and visualization of the 2-D plans14. For each polishing
step, the same amount of material is removed and others microhardness measurements are performed15. In this work
the serial sectioning methodology was performed using the free software NIH ImageJ16 in order to visualize the inner
structure of the pores present in the self-reducing pellets. The next step consists to measure the average tortuosity and the porosity values which plays important role on the mechanical strength of the agglomerates and heat and on mass transfer phenomena, which in turn, determines
the eficiency of the processing technology based on the
self reducing agglomerates10. When the self-reducing of
the pellet begins, the reducing gases formed in the inner of the agglomerate, in contact with the reagent, make the chemical reactions according Equations 1, 2, 3 and 4, been the controller of the kinetic reduction process.
( ) ( ) ( ) ( )
2 3l,s g 3 4l,s 2g
3Fe O + CO ↔ 2Fe O + CO (1)
(s) 2(g) (g)
C + CO → 2CO (2)
3 4(l,s) (g) (l,s) 2(g)
Fe O CO+ ↔3FeO + CO (3)
(s) (g) (l,s) 2(g)
FeO CO+ ↔ Fe + CO (4)
The overall mechanism is believed to be controlled by the rate of solution loss reaction (Equation 2)5. A
rate equation largely used to model the kinetics of these processes is given by Equation 5. This kinetic reaction rate equation depends on the inner structure of the agglomerates such as contact areas, porosities and tortuosity, besides the gas diffusivities and activated sites for the reaction taking place17.
2(g)
2 2 2
2 2 2
1 g g CO
CO
CO CO CO
1 par CO CO bulk ave par d R
M A D Sh k
−
ε ρ φ
ϕ
= +
η
(5)
In Equation 5, the parameter A is the supericial area
of the particle that is function of the form factor and of the volumetric fraction as shown in Equation 6; and ηave, is a diffusion term that involves the tortuosity and porosity parameters, respectively, τ and ξ according Equations 7, 8 and 9.
(
)
6 / ( ) par
A = ε dφ (6)
( )
2
1 1
tanh 3 3 CO
ave
−
Θ Θ
η =
Θ
(7)
( )
22 1 6 CO pch eff CO k d D
Θ = ϕ (8)
2 2 pch eff bulk CO CO pch
D =ξ D
τ (9)
In this study, the porosity obtained by the serial sectioning methodology was compared with traditional pycnometric technique. In addition, the agglomerate was characterized by chemical analysis using the Inductively Coupled Plasma Atomic Emission Spectroscopy (ICP), Scanning Electron Microscopy, Optical Microscopy and X-ray diffraction to recognize the present phases and additional discussions to compare the techniques. All the samples were prepared with pellet size compatible with the traditional pellets largely used in the reduction processes which would be easily applied for all proposed self-reducing processes.
2. Experimental Procedure
2.1.
Chemical characterization
The chemical composition of the pellet was identiied
oxygen and carbon. Due the high amount of carbon found in X-ray and EDS not be reliable, the calculations for others elements detected were rearranged using calculation basis on 15% of carbon, a value commonly used in production of pellets with this kind of raw material18.
2.2.
Three-dimensional microstructural
characterization
The metallographic preparation consisted to ground the sample in SiC paper (120-2500 grit) and after this, the polishing was performed with the dry sample (always that an image was acquired), using SiC paper with 4000 grit in a sanding machine PLOZED. It was not possible to perform the polishing with chemical suspension, because this could damage agglomerate structure of the sample and destroy the pores of the surface. In order to keep the same reference
lame and return at the same position the microhardness was
measured near the area to be analyzed. This procedure was repeated for each new polishing and image acquisition for 85 sequential images. Microhardness Vickers measurements were carried out in a Shmadzer model binocular microscope composed by lens of 0.65M 40x, and the penetration
time of the indenter was ifteen seconds and the hardness
required was 2.94N. The digital images were acquired
with a 5X magniication in an optical microscope Leitz
model Metallovert, using the software PixeLink Capture to acquire the images (dimensions 1280 × 1024 pixels). At each polishing step carried out, the spacing between two slices was computed from the reducing of diagonals of Vickers marks, observed in two sequential images. The thickness (∆h) of material removed at each polishing performed, is computed from the difference between mean values of Vickers diagonals before and after polishing (D1 − D2) by Equation 10:
1 2
2 tan( / 2)
D D
h −
∆ = ϕ (10)
Where, ϕ is the angle between opposite faces in square-based pyramid with value of 136°. The three-dimensional visualization was processed using the freeware software NIH Image J, following the sequential steps: i) segmentation of images: this step is used to discern the pores, by pixels differentiation, of the other phases (pattern); ii) alignment of the 2-D planar sections using the available plugin “StackReg” developed by Philippe Thévenaz, from the Biomedical Imaging Group of the École Polytechnique Fédérale de Lausanne19. The plug-in was based on four
steps that were used in this work: translation, rigid body,
rotation and afine. This alignment is necessary to ensure
that the pore analyzed in the previous image is the same one which is visualized in the posterior image. The alignment
process inishes only when the images are perfectly aligned
to each other. Sometimes, the alignment was necessary to be performed manually using the plugin “Align Slice”20; and,
iii) volume renderization using “Volume Viewer”21 plugin
to allow a more “solid” visualization of the microstructure and after removing the pattern, it was possible to visualize the porous inner structure of the reconstructed volume. The amount of material removed after each polishing step was about 2.82 µm; according to the literature10 the
amount of material removed is accepted until 3 μm, since above this value, some important information could be lost. Considering each image acquired with the same thickness
than the material removed, and that, eighty ive images
were obtained, so, the computed volume for the sample is 1485 × 1188 × 241 µm3. The tortuosity parameter was
calculated for 20 different pores. In addition, the pore
fraction was calculated for 5 ields with the software NIH ImageJ using the plugin “Voxel Counter”22 and the result
was compared with the porosity obtained by the pycnometric technique and analysis of 2D digital images by SEM.
In order to compare the methodologies additional pycnometry measurements were carried out. The pycnometric technique is a comparative method between the relative densities of the solid and liquid23. This method
is based on ASTM B 311-93 standard and it is valid for metallic materials containing less than 2% porosity23. Due
to the porosity of the self-reducing pellet to be high, in this study it was necessary to coat its surface by applying a
thin polymeric ilm in order to avoid the pores illed by the
liquid and so, to invalidate the true value for the measureable weight. According to the Equations 11 and 12, it is possible to estimate the results for density and porosity of the pellet, respectively.
a a l
a
P
P P
ρ = ρ − (11)
(%) t a 100
t
pore =ρ −ρ ×
ρ
(12)
Where, Pa is the weight of dry sample (kg.m/s2), P is the
measurable weight of the sample (kg.m/s2), ρ
l is the liquid
density (g/m3), ρt is the theoretical density (g/m3) and ρa is
the apparent density (g/m3). The theoretical density can be
determined by a theoretical calculation23. In this work, the
theoretical density was obtained using mixture rule based
on the volume fraction of each phase identiied by using
the software Match. The density and pores fraction were calculated by 5 different pellets through the pycnometer. The liquid used was water and for each pellet, the measurements
for measurable and true weights were accomplished ive
times. In addition, a 2D image analysis was carried out to compare the accuracy for the 3D method. This was carried out using the software NIH ImageJ, with the available resource Voxel Counter. After the metallographic preparation of the sample, all the digital images obtained in SEM were processed and analyzed using the freeware for image analysis NIH Image J. The images were treated and converted to bitmap code and selected by the brightness cut off to identify the pores. The pore fraction in 2-D was
measured for ive random areas.
3. Results and Discussions
3.1.
Results of chemical characterization
In order to estimate the quality of the pellet produced with EAF dust, the elements presents in the pellet were
identiied and quantiied by ICPAES analysis. To compare
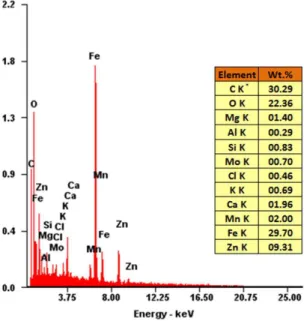
technique, EDS and X-ray analysis were carried out for different areas of the sample and the results using EDS method is presented in Figure 1, while x-ray spectra is shown in Figure 2. Both techniques showed a high value of carbon, and as it was explained (see section 2.1) the carbon fraction was estimated on 15% and the fraction of others elements were rearranged according to this new argument adopted. The EDS results are obtained using the averaged value of 5 random regions of the sample. In Table 1, according to the results of ICPAES, EDS and X-ray analysis, a high
concentration of iron was identiied as Fe+3 or Fe+2 ions and
also like neutral element23. In addition, some elements in
low concentration as 6.30% calcium, 3.12%, manganese, and 3.06% magnesium, detected by ICPAES could be confused with the crystallographic structure of silicon found in high amount as SiO2 phase by X-ray diffraction. The zinc concentration of 10.63% in EDS technique, was
identiied as ZnO and associated with iron as franklinite,
according to the results obtained by X-ray diffraction. These results are in agreement with previous works reported at the literatures24,25. The quantity of oxygen and carbon detected by EDS technique are not reliable since a few ields of
the sample were analyzed however, mass balance of these elements were used to estimate the elements of inaccurate determination. The results obtained by X-ray diffraction show the major elements are carbon, oxygen (by mass balance), zinc and iron. As presented in Figures 1, 2, this
study conirms the range of the main components presented
in the self-reducing agglomerates of EAF dust obtained by previous works6-8,24-27 besides the higher concentrations of
zinc and iron based phases. Figure 2 shows the mean result for spectra obtained for each part of the pellet using the software Match v.1.0, and the composition of each phase calculated by the software. The X-ray diffraction results of the different regions of the sample were similar indicating the homogeneity of pellet composition. The blue spectrum is the experimental result and the color peaks are the spectra calculated based on available PDF database and its mass composition of the phases estimated by the software based on Rietveld method. The software also estimates the Rp
parameter that is a measure of conidence on quantifying
the phases by the Rietveld method. Its value is considered in acceptable region between 15 and 30%[28]. From the
results of the composition of the phases, the calculation was performed on mass fraction presented in Figure 2 for each component through a simple mass balance. It is possible to observe the large amount of magnetite, franklinite, zincite, wustite and quartz. According to literatures5-9,26,27, magnetite
is commonly detected in high amount in electric arc furnace
Figure 1. EDS spectra for random area of the self-agglomerate
pellet of EAF dust. *Quantify of carbon and oxygen is not reliable.
dust. This characteristic of the EAF dust is conirmed in
this study, as observed in Figures 1, 2. A summary of the average elemental analysis obtained by different techniques is presented in Table 1 for self-reducing pellets of EAF dust. In this kind of material, the carbon content is higher than the necessary amount for the reduction of the oxides in
self-reducing pellets of EAF (usually until 15%) and contributes to dilute the large zinc amount present in the EAF dust and enable the production of agglomerates suitable to be used as raw materials for processes based on self-reducing technology17,24-27.
3.2.
Results for microstructural characterization
3.2.1. Two-dimensional results
The analysis of the digital images obtained by SEM allowed to identify the pores present in the surface of the sample and thus, quantifying the pores fraction for posterior comparison with the 3D reconstruction technique. Figure 3 shows the images of a random area of the sample where the contrast of the pores in the images is poor and thus the pixel selection is performed to get better contrast using the software NIH ImageJ. After the segmentation step the resource termed analyze particles, available in the software, allowed the pore fractions calculations. The analysis of the different areas indicates that there was a large variation on the results of pores fraction in the different areas and this can be explained by the strong anisotropy of the material. It was observed that the distribution of pores in the pellet is higher in the central region of the agglomerates3. The average
porosity found for the different areas was 22.4%. In contrast, Wagner et al.3 measured the pore fraction of pellets of iron
ore shows slightly higher values. It is worth to mention that the morphology and spatial distribution of the pores in agglomerates play a relevant role in compressive strength and transport phenomena29,30. Therefore, a method able to
furnish accurate results is of fundamental importance. This
Table 1. Average elements in the sample of EAF dust pellets
detected by ICPAES, EDS and X-ray diffraction.
Methods ICPAES EDS X-Ray
Elements Composition (wt. (%))
Aluminium 0.24 0.25 0.00
Calcium 6.30 3.12 0.00
Cobalt 0.02 0.00 0.00
Chrome 0.33 0.00 0.00
Iron 53.64 41.78 34.82
Potassium 1.57 0.48 0.00
Magnesium 3.06 1.41 0.00
Manganese 3.12 0.99 0.00
Nickel 0.12 0.00 0.00
Silicon 1.98 0.78 10.75
Zinc 14.61 10.63 13.86
Carbon 15.00 15.00 15.00
Oxygen 0.00 25.00 25.56
Molibdenium 0.00 0.37 0.00
Chlore 0.00 0.19 0.00
Total 100.00 100.00 100.00
Figure 3. Selection of the pixels for the porosity identiication in a random area of 2D image.
work aims to furnish comparative methodologies analysis to estimate inner parameter for modeling inner phenomena.
3.2.2. Three-dimensional results
In order to construct the 3D images, Figures 4 and 5 are used. Figure 4 shows the pixels selection while Figure 5 shows the sequence and alignment of 2D images for 3D reconstruction. At each polishing step, the material amount removed between two sequential images showed some negligible discrepancy in the values. This happens because the material is anisotropic and some parts are softer than others and careful hardness mark is important to assure same amount of removed material. Equation 10 allows the calculation the thickness of the material removed in each polishing cycle and the result found was 2.82 µm and assumed for all steps. To remove false pore caused by image noise which appeared in the pictures, it was applied some resources available in the software NIH ImageJ (Filter plus and threshold). This step, called segmentation, consists of distinguishing the interesting phase of the matrix by pixels differentiation. Figure 4, from the left to right, the
irst picture is the original photo of a random area of the
sample; the second photo is the original photo after the treatment of pixels using the resources smooth to round
the bounds of the phases; enhance contrast and filter plus and fast filter to remove the noises of the images; contrast and brightness to distinguish and emphasize the contrast between matrix and pores; and in the third photo the image was changed for white (matrix) and black (pores), after to apply the threshold resource of the software NIH ImageJ.
This treatment was done for the eighty and ive 2-D images
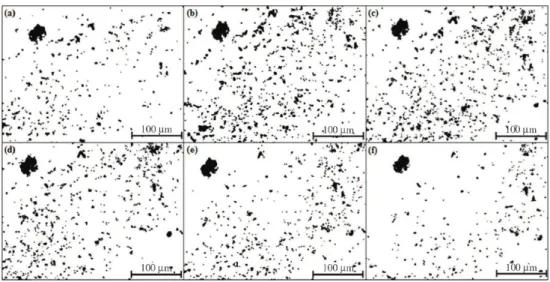
after to build a stack of images. Due to the rotation and displacement possibly generated during image acquisition, it was necessary to use the plug-in StackReg. When the pictures showed a high distortion compared to other it was necessary to perform the alignment manually using the Align Slice plug-in. Figure 5 presents an example of the alignment for
six sequential images (from (a) until (f)) of a random ield.
In Figure 5 it is easily noted a dark region formed by pores closer to each other caused by microhardness mark that must be removed from the image analysis in order to avoid over prediction of the pore volume fractions. In addition, it is possible to note that some pores disappear away from the second to third image, and new pores arise in the fourth until sixth image. After the alignment of the images
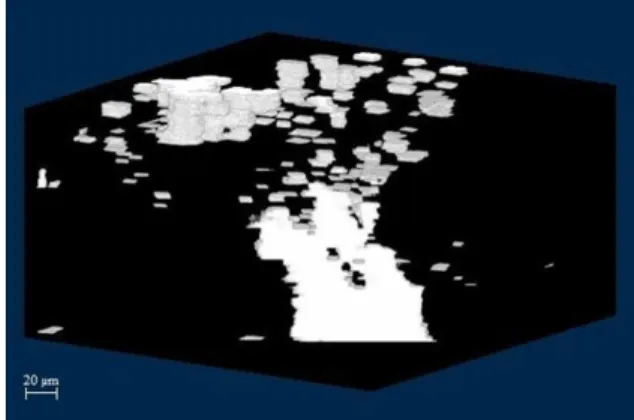
the ields were reconstructed using the resource Volume Viewer. Much of the presents pores visualized in Figure 6
were classiied like micropores and it was not possible to
Figure 5. Alignment of the sequence from (a) until (f) of 2D sectioning for the 3D reconstruction of the self-reducing pellet.
visualize the connectivity after the polishing. Figures 6a-c,
show the reconstructed images of some ields without the
matrix. Some pores showed an irregular structure, but the majority of the pores show a nearly cylindrical geometry. The micropores are nearly spherical shapes. The majority of isolated micropores arise inside some grains and phases. This usually happens during the agglomeration process, when the growth of the grains causes the detachment between the pores and the spherical geometry of these pores that remaining in the grain20,26. Figure 7 is an example of 3D image reconstruction ield with details to visualize the
morphology of the pores present. Isolated pores and several distorted shapes were observed.
3.3.
Predictions of tortuosity and porosity
The tortuosity and porosity parameters in the pellets are extremely important for the kinetics of reduction reactions. Higher tortuosity values is expected to increase
the turbulence and the residence time of the gas (CO) inside of pellet29. The tortuosity is deined mathematically
by Equation 13.
2
v
L L
τ = (13)
In this study the tortuosity parameter was calculated for 20 pores reconstructed in the sectioning area of the sample. Figure 8 allows to observe how this calculation was carried out using the ImageJ software and the legend
attached to the igure displays the values of the real (Lv) and linear (L) lentghs in μm and the respective tortuosities (τ) for the 20 different pores reconstructed. The average value for tortuosity was 0.82. It is a value close to 1 that suggests a nearly cylindrical geometry shape of the large pores. In general, the pores show real path length longer than the
straigth ones in the direction of luid low. Excluding the 7th
pore measured, the tortuosity value found was about 0.80. The pores 2, 3, 9 and 12 had the larger tortuosity, 1.00, indicating cylindrical structure. The porosity was calculated by plug-in Voxel Counter. This step was performed by the ratio between the voxels of the pores present in the
analyzed ield and voxels of the entire ield. The porosity
was calculated for 5 different ields and the superior pores
distribution was 48.81%, and the inferior, 32.54%. This difference is explained due the material heterogeneity and the porosity increases from the surface to the center of the pellet3. In addition, the porosity was calculated by the pycnometric technique, which is assumed as the best method for volumetric bulk measurents, for 5 different pellets. With Equations 2 and 3, the apparent density and pore fractions were estimated assuming that the theoretical density
(ρt), the weigth of dry pellet (P), apparent weigth (Pa), apparent porosity (ρa) and fraction of pores for 5 different self-reducing pellets of EAF were calculated. The porosity range was from 39% to 43% showing that the 3D sectioning technique is compatible with pycnometry. Figure 9 shows
Figure 7. Three-dimensional reconstruction for geometric
quantiication of porosities, tortuosity and connectivity of EAF
dust self-reducing pellet.
the comparative results obtained for the three techniques of porosity measurements considered in this work. The two-dimensional analysis of the images obtained in SEM shows the more discrepant value. Problably, it ocurrs due to 3D features of pores in the anisotropic materials. As it was observed, the three-dimensional reconstruction and pycnometry showed similar values due to their natural 3D features. Additionally, the analysis by two-dimensional images using SEM requires a large number of pictures of all surface of pellet and usually offers lower accuracy. Thus, this study recommended the 3D sectioning reconstruction as an accurate and feasible technique to detailed characterization of self-reducing pellets for pore measurement, inner structure and measurements of inner parameters of the pore such as tortuosity, connectivity and volume fractions of micropores and clusteres.
4. Conclusions
In this work the chemical and microestructural characterization of self-reducing pellets made of EAF dust was carried out. The ICPAES (Inductively Coupled Plasma
Atomic Emission Spectroscopy) technique was considered suitable to recognize and to quantify the constituents present in the self-reducing pellet. The X-ray diffraction allowed to identify and to quantify the main phases of the pellet of EAF with typical values: magnetite (11.6%), zinc ferrite (11.4%), wustite (14.05%), zincite (11.10%), quartz (19.93%), iron (5.50%) and carbon (15.00%> estimated), commonly found in electric arc furnace dust18,27; and using mass balance it was
possible to estimate the amount of oxygen present in oxides detected (25.56%). A large amount of quartz was detected by X-ray diffraction and perhaps, the silicon could have been confused by others elements in lower concentration with similar crystallographic structure. The three techniques allowed detecting a high amount of iron and zinc, commonly found in EAF dust. The three-dimensional reconstruction by serial sectioning technique was compared with those found by two-dimensional image analysis obtained in SEM and pycnometry technique. The average of results for porosity obtained for three-dimensional, pycnometry and two-dimensional techniques were, respectively, 41.61%, 41.53% and 23.41%. The 3-D method presented more accurate results, as expected, since the porosity is a parameter of typical three-dimensional feature especially for anisotropic materials. In addition, the 3-D technique has the advantage of visualizing the pore morphology and interconnectivity among them, an important reduction kinetic parameter of the self- reducing pellets. By observing
the inal reconstruction images it was found that the pores
are close to cylindrical shape with low interconnectivity. In this work, the average value of tortuosity obtained for a typical self-reducing pellet of EAF dust was 0.84 that proposes a morphological structure close to cylindrical. In addition, the pycnometry allowed calculating the density of the pellet, 2.3342 g/cm3.
Acknowledgements
This study was partially supported by CAPES- Coordenação de Aperfeiçoamento de Pessoal de Nível Superior, CNPq and Faperj - Brazil.
Figure 9. Porosity comparison among different techniques.
References
1. Castro JA, Sazaki Y and Yagi J. Three Dimensional Mathematical Model of the Iron Ore Sintering Process Based on Multiphase Theory. Materials Research. 2012; 42:44-52. 2. Cooper MS. Reciclagem do pó de aciaria como matéria-prima
na fabricação de materiais cerâmicos argilosos: controle das emissões atmosféricas de zinco. [Thesis]. Porto Alegre: Universidade Federal do Rio Grande do Sul; 2006.
3. Wagner DT, Rouco HV, Gomes OFM, Paciornik S and Vieira MB. Caracterização de pelotas de minério de ferro por microscopia digital e análise de imagens. Tecnologia em Metalurgia, Materiais e Mineração. 2009; 5(4):215-218. http:// dx.doi.org/10.4322/tmm.00504005
4. Iglesias JCA, Gomes OFM, Schinazi G, Paciornik S and Vieira MB. Caracterização Quantitativa de Sínter. Tecnologia em Metalurgia, Materiais e Mineração. 2010; 7(1-2):12-17. http:// dx.doi.org/10.4322/tmm.00701003
5. Takano C, Cavallante FL, Mantovani MC and Mourão MB. Electric arc furnace dust characterization and recycling by Self-Reducing Pellets. In: Metallurgical Industries. São Paulo; 1999. p. 37-48.
6. Telles VB, Oliveira JR, Espinosa DCR and Tenório JAS. Reaproveitamento da poeira de aciaria elétrica através do processo de micropelotização. In: Anais do Seminário de Aciaria Internacional; 2010; Resende. Resende; 2010. 7. Heck NC and Costa MI Jr. Caracterização mineralógica de
poeiras do forno elétrico a arco. In: Anais do Congresso Anual ABM; 1998; São Paulo. São Paulo; 1998. p. 1344-1353. 8. Silva MC, Bernardes AM, Bergmann CP, Tenório JAS and
Espinosa DCR. Characterization of electric arc furnace dust generated during plain carbon steel production. Ironmaking and Steelmaking. 2008; 35(4):315-320. http://dx.doi. org/10.1179/030192307X232936
10. Rodrigues MRB. Reconstrução Microestrutural 3D das Ligas Ti-6Al-4V e Nb-TiO2 por Seccionamento em Série. [Thesis]. Volta Redonda: UFF; 2009.
11. Bear J. Dynamics of fluids in porous media. New York: Dover Publications; 1972. p. 106-118.
12. Lee SG and Gokhale AM. Visualization of three-dimensional pore morphologies in a high-pressure die-cast Mg-Al-RE alloy. Scripta Materialia. 2007; 56:501-504. http://dx.doi. org/10.1016/j.scriptamat.2006.11.012
13. T e w a r i A a n d G o k h a l e A M . A p l i c a t i o n o f t h r e e Dimensional digital image processing for reconstruction of microestrutural volume from serial sections. Materials Characterization. 2000; 44:259-269. http://dx.doi.org/10.1016/ S1044-5803(99)00004-2
14. Lee SG, Gokhale AM and Sreeranganathan A. Reconstruction and visualization of complex 3D pore morphologies in a high-pressure die-cast magnesium alloy. Materials Science and Engineering. 2006; 427:92-98.
15. Wunsch B and Chawla N. Serial sectioning for three-dimensional visualization and modeling of SiC particle reinforced aluminum composites. TMS Outstanding Student. 2003; 1-16. Avalaible from: <http://www.tms.org/ Students/Winners/Wunsch/Wunsch.html>.
16. Rasband WS. Image J. Bethesda: U. S. National Institutes of Health; 2008. Avalaible from: <http://rsb.info.nih.gov/ij/>. 17. Castro JA, Silva AJ, Sasaki Y and Yaghi J-I. A Six-phases 3-D
Model to Study Simultaneous Injection of High Rates of Pulverized Coal and Charcoal into the Blast Furnace with Oxygen Enrichment. ISIJ International. 2011; 5:748-758. http://dx.doi.org/10.2355/isijinternational.51.748
18. Takano C, Nascimento RC and Mourão MB. Recycling of solid wastes containing iron from integrated steelmaking plant. In: Proceedings of 2nd Japan-Brazil simposyum on dust processing- Energy- Environment in Metallurgical Industries; 2000.
19. Thévenaz P. StackReg. Switzerland: École Polytechnique Fédérale de Lausanne; 2009. Avalaible from: <http://bigwww.
epl.ch/thevenaz/stackreg/>.
20. Landini G. Align_Slice. England: School of Dentistry of University of Birmingham; 2006. Avalaible from: <http:// www.dentistry.bham.ac.uk/landinig/software/software.html>. 21. Barthel KW. Volume Viewer. Bethesda: National Institute
of Health; 2009. Avalaible from: <http://rsb.info.nih.gov/ij/ plugins/volume-viewer.html>.
22. Rasband W. Voxel Counter. Bethesda: National Institute of Health; 2010. Avalaible from <http://rsbweb.nih.gov/ij/plugins/ voxel-counter.html>.
23. Boeira AP. Macrossegregação e Formação de Poros na Solidificação de Ligas Al-Cu: Modelagem Numérica e Desenvolvimento Experimental. [Thesis]. Campinas: Universidade Estadual de Campinas; 2006.
24. Hagni A, Hagni R and Demars C. Mineralogical Characteristics of Electric Arc Furnace Dusts. Review of Extractive Metallurgy. 1991; 43:28-30.
25. Telles VB. Reciclagem da poeira de aciaria elétrica na sinterização de minério de ferro visando à eliminação de zinco. [Dissertation]. São Paulo: Universidade Federal de São Paulo; 2010.
26. Mantovani MC, Takano C and Cavallante FL. Caracterização de três tipos de poeiras geradas em fornos elétricos a arco. In:
Anais do Congresso Anual da ABM; 1998; São Paulo. São Paulo; 1998.
27. Machado JGMS. Estudo da caracterização e avaliação da influência do tempo na redução carbotérmica do pó de aciaria elétrica. [Dissertation]. Porto Alegre: Universidade Federal do Rio Grande do Sul; 2004.
28. Caglioti G, Paoletti A and Ricci FP. Introduction to the rietveld method. In: Young RA. The Rietveld Method. Oxford: University Press; 1993. Available from: <http://www.scielo. br/>. Acess in: 26/03/2011.
29. Inazumi T, Nakano M and Kasama S. Study of pore networks in iron ore sinter by X–ray CT image analysis. Bulletin of the Geological Survey. 1995; 46:573-594.
30. Mota M, Teixeira JA, Bowen R and Yelshin A. Effect of tortuosity on transport properties of mixed granular beds. In:
Proceedings of 8th World Filtration Congress; 2000.
Appendix
Nomenclature
Fe3O4 magnetita FeO wustita Fe2O3 hematita
Fe iron
ZnFe2O4 zinc ferrite ZnSiO2 zinc silicate ZnO zincite Fe+3 íons iron III Fe+2 íons iron II
τ pore tortuosity
Lv average length crossed by the luid through the pores.
L Linear length in the direction of luid low.
D1 e D2 mean diagonals obtained from images before and after polishing.
φ angle formed between diagonal and height of microimpression geometry.
ρa apparent density of the pellet.
ρt theoretical density of the pellet.
ρl luid density (1 g/cm3).
P Weight of dried pellet.
Pa Apparent weight of the sample.