Article
0103 - 5053 $6.00+0.00
*e-mail: [email protected]
Multivariate Optimization and Validation of an Analytical Method for the
Determination of Cadmium in Wines Employing ET AAS
Sérgio L. C. Ferreira,*,a Robson M. de Jesus,a Geraldo D. Matos,a Jailson B. de Andrade,a Roy E. Bruns,b
Walter N. L. dos Santos,c Danuza D. Cavalcante,c Maria G. R. Valed and Morgana B. Dessuyd
aInstituto de Química, Universidade Federal da Bahia, 40170-270 Salvador-BA, Brazil
bInstituto de Química, Universidade Estadual de Campinas, 13083-970 Campinas-SP, Brazil
cUniversidade do Estado da Bahia, 91501-970 Salvador-BA, Brazil
dInstituto de Química, Universidade Federal do Rio Grande do Sul, 91501-970 Porto Alegre-RS, Brazil
O presente trabalho descreve a otimização e validação de um método para determinação direta de cádmio em amostras de vinho por espectrometria de absorção atômica com atomização eletrotérmica (ET AAS). A otimização foi realizada empregando um planejamento fatorial completo de 2 níveis, incluindo os fatores: tempo (10 s) e temperatura de pirólise (600 oC), temperatura de atomização (1300 oC) e massa de modificador (15 µg). Sob as condições otimizadas, foi encontrada uma massa característica de 0,7 pg, limite de detecção e quantificação de 0,030 e 0,100 µg L−1, respectivamente, para um volume de amostra de 20 µL. A precisão foi de 0,30, 0,37 e 0,49% (RSD) para amostras de vinho com concentrações de 1,286, 0,266 e 0.356 µg L−1, respectivamente. A exatidão da metodologia de determinação direta empregando ET AAS foi avaliada por comparação usando um método de digestão ácida e determinação também por ET AAS para cinco amostras de vinho. O método foi aplicado para determinação de cádmio em 30 amostras de vinhos brasileiros. A concentração de cádmio variou de 0,146 a 1,563 µg L−1, cujos valores estão abaixo do nível máximo permitido pela Organização Internacional de Vinha e Vinho (OIV) e pela legislação brasileira, 10 µg L−1.
This work describes the optimization and validation of a direct method employing electrothermal atomic absorption spectrometry (ET AAS) for the determination of cadmium in wine. The optimization step was carried out using a two-level full factorial design, involving the followings factors: pyrolysis time (10 s) and temperature (600 oC), atomization temperature (1300 oC) and modifier mass (15 µg). Under the optimized conditions, a characteristic mass of 0.7 pg and limits of detection and quantification of 0.030 and 0.100 µg L−1, respectively, were obtained using a sample volume of 20 µL. The precision expressed as relative standard deviation (RSD %) was 0.30, 0.37 and 0.49% for wines with cadmium concentrations of 1.286, 0.266 and 0.356 µg L−1, respectively. The accuracy of the new direct determination methodology applying ET AAS was assessed by comparison with an acid digestion methodology, also with determination by ET AAS, using five wine samples. The proposed method was applied for the determination of cadmium in 30 Brazilian wine samples. The cadmium content varied from 0.146 to 1.563 µg L−1; all these values are lower than the permissible maximum level stipulated by the International Organization of Vine and Wine (OIV) and also by Brazilian legislation, which is 10 µg L−1.
Keywords: cadmium, ET AAS, Brazilian wines, cadmium in Brazilian wines
Introduction
Wine, a product of yeast fermentation of natural sugars present in grape juice, has been a widely consumed
beverage in many parts of the world for thousands of years with very obvious commercial value and social
importance.1,2 Numerous studies have shown that the
solution. The composition and the quality of wines can be influenced by many and diverse factors corresponding to the specific production area, such as grape variety, soil and climate, herbicidal treatment, culture, yeast, winemaking practices, transport and storage.3,4 Cadmium is a metal of
high toxicity and, nowadays, is ubiquitous in food, water
and air.5,6 The highest human cadmium exposure comes
from tobacco smoke and from ingestion of food and beverages, including wines, most of which arises from the uptake of cadmium by plants from fertilizers, pesticides, fungicides, sewage, sludge, manure and atmospheric
deposition.1 Cadmium is absorbed more efficiently by the
lungs (30 to 60%) than by the gastrointestinal tract. The most serious chronic effect of oral exposure to cadmium is renal toxicity.7 A joint FAO/WHO (Food and Agriculture
Organization / World Health Organization) expert committee has estimated a provisional tolerable weekly intake of cadmium for an adult to be from 0.4 to 0.5 mg. In wines, the permissible maximum level for cadmium has been stipulated by International Organisation of Vine and Wine (OIV) as 10 µg L−1.8 Brazilian legislation also
limited the cadmium content at this value.9
Trace element determination in complex matrices, such as wine, has traditionally been a challenging analytical task because of the potential interference due to concomitants. According to a recent literature survey a wide variety of analytical techniques have been applied to quantify the trace metal content of wine, such as ion chromatography, stripping potentiometry, inductively coupled plasma mass spectrometry, inductively coupled plasma optical emission spectrometry, flame atomic absorption spectrometry, and electrothermal atomic absorption spectrometry (ET AAS).10,11 Sample pretreatment is usually required for
achieving good accuracy and to destroy the organic matrix and/or to extract the metal ions bound in inorganic and
organic complexes.12 Besides this, cadmium is present in
wine at low concentration and its determination in this kind of sample requires the use of analytical techniques of high sensitivity. In this context, ET AAS is a good choice, because of its good detectivity and its tolerance of inorganic and organic matrices, which should make the direct determination of cadmium in wine without any sample preparation possible.11,13,14
Chemometric techniques have been applied in analytical chemistry for evaluation of results and also for optimization of analytical methods.15-19 For evaluation,
the multivariate analysis techniques: principal component analysis (PCA) and hierarchical cluster analysis (HCA) are the ones that are employed most frequently.20 For
optimization the most frequently used techniques are: two-level factorial design21,22 which is used for preliminary
evaluation of effects of factors on the analytical systems and also response surface methodologies that allow the determination of critical conditions.23,24 Some authors
have used these design techniques for optimization of methods established using ET AAS. Benzo et al.25
performed a fractional factorial design involving five factors for the optimization of the experimental conditions for the determination of vanadium in aqueous solutions by ET AAS. Grinberg and Campos used factorial design for optimization of the iridium coating procedure in a method proposed for the determination of lead in whole blood and urine by ET AAS. Employing the conditions optimized, up to 1100 firings were possible with the same coating without sensitivity losses.26 Pereira-Filho and
co-workers27 employed factorial design for optimization of
the pyrolysis and atomization temperatures established for the determination of cadmium by ET AAS. All these
studies were performed using aqueous solutions.Also,
Santos used factorial design for optimization of the instrumental conditions for the determination of several
metals in hemodialysis water employing ET AAS28
and Ferreira and co-workers established instrumental conditions for quantification of silicon, arsenic, copper and lead in petroleum derivatives by ET AAS using multivariate optimization techniques.29
In the present paper, a procedure for the direct determination of cadmium in wine is proposed using ET AAS. The parameters were optimized by a two-level full factorial design.
Experimental
Instrumentation
All measurements were carried out using a ZEEnit 600 atomic absorption spectrometer (Analytik Jena AG, Jena, Germany) equipped with a transverse-heated graphite tube atomizer and Zeeman-effect background correction. Transversely heated pyrolytic graphite coated tubes with PIN platform were used for all determinations. A cadmium hollow cathode lamp (Varian, Mulgrave, Australia) was used as radiation source with a current of 3 mA (wavelength 228.8 nm, spectral resolution 1.2 nm). An MPE 60 furnace autosampler (Analytik Jena) was used for sample introduction. Argon with a purity of 99.997% (White Martins, Salvador, Brazil) was used as the purge gas with an internal flow rate of 2.0 L min−1 during all
Reagents and solutions
Deionized water, obtained from a Milli-Q system (Millipore, MA, USA) with a specific resistivity of
18 MΩcm, was used to prepare all solutions and
standards. All reagents were of analytical grade. The nitric acid solutions used in this work were prepared by appropriate dilution from concentrated nitric acid (Merck, Darmstadt, Germany). The working standards were prepared immediately before use, by serial dilutions
from a 1000 mg L−1 cadmium stock solution (Merck) in
0.014 mol L−1 nitric acid.
The palladium modifier solution added to samples and standards was prepared by diluting 0.5 mL of palladium modifier stock solution (10.0 ± 0.2 g L−1 Pd in 15% (v/v)
HNO3) to 10 mL, resulting in a final concentration of 500 mg L−1 Pd.
Samples
A total of 30 Brazilian red and white wines from different growing areas were purchased at a local market. Details about the type of grape, etc., are given together with the analytical results in the Results and Discussion section.
Sample preparation using a digester block
Five selected wine samples were subjected to an acid digestion to evaluate the accuracy of the proposed method. A volume of 5 mL of wine sample was digested in a digester block with the addition of 10 drops of concentrated nitric acid and 2 mL of 30% (v/v) hydrogen peroxide (Merck). The mixture was heated at 150 °C under reflux for 2 h using a digester system with a
“cold finger”.30 The residue was diluted to 10 mL with
0.014 mol L−1 nitric acid. All samples were digested in
triplicate.
Optimisationstrategy
The experimental conditions of drying time, drying temperature, gas flow and clean step were fixed as recommended by the instrument manufacturer and are shown in Table 1. The optimization step of the factors modifier mass, pyrolysis time, pyrolysis temperature and atomization temperature was carried out using a two-level full factorial design. The experimental dominions were established according to literature data, previous experiments and are presented in Table 2 as coded and real
values.31 The integrated absorbance (peak area) was used
as response. The evaluation of the results of the factorial design was carried using Analysis of Variance at the 95% confidence level and also a Pareto Chart. All experiments were made using 20 µL of wine sample (without dilution) and in random order. The experimental data were processed
using the STATISTICA computer program.32
Results and Discussion
Establishment of the experimental conditions for Cd determination
The optimization was carried out using a (24)
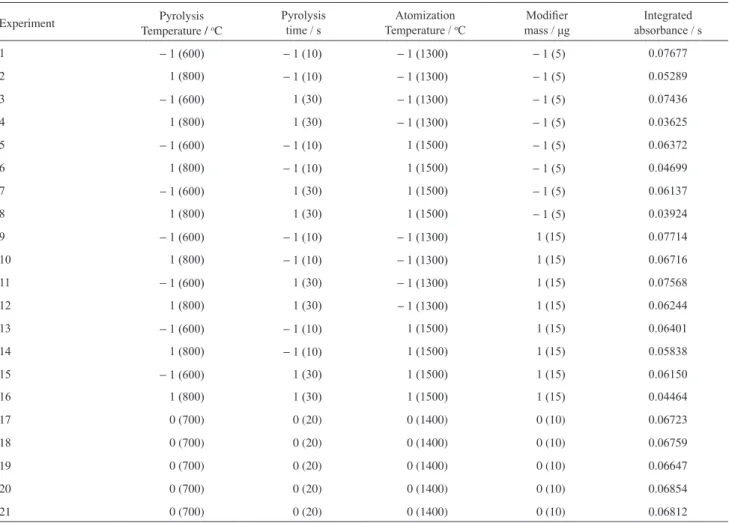
two-level full factorial design, involving the following factors: pyrolysis time, pyrolysis temperature, atomization temperature and modifier mass. The integrated absorbance (peak area) was used as response. The 16 runs of the factorial design were performed without replicates. Table 2 shows the matrix of the factorial design with real and coded values and the results of the experiments carried out, having absorbance integrated (area peak) as response.
Evaluation of the factorial design as a Pareto chart (Figure 1) demonstrates that, for the experimental dominions established, all factors are significant, and the effect values for these variables are: modifier mass (+0.00742 ± 0.00111), pyrolysis time (−0.00645 ± 0.00111), pyrolysis temperature (−0.01832 ± 0.00111) and atomization temperature (−0.01036 ± 0.00111), with the experimental error being calculated by five replicates of the central point. These results demonstrated that the pyrolysis and atomization temperatures are the most important factors of the process. Considering these results, the instrumental conditions recommended for the method are: modifier mass (15 µg), pyrolysis time (10 s), pyrolysis temperature (600 oC) and atomization temperature (1300 oC). The data
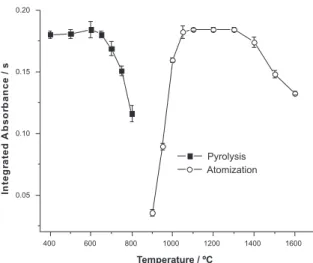
agree with the results obtained by conventional pyrolysis and atomization curves, which were found using a modifier mass of 15 µg and pyrolysis time of 10 s, as shown in Figure 2.
Table 1. Temperature program used for Cd determination
Step T / oC Ramp / (oC s-1) Hold time / s
Drying 110 15 15
Drying 120 10 15
Drying 140 5 10
Pyrolysis 600 10 10
Atomization 1300 FPa 8
Cleanout 2300 FP 5
Table 2. Matrix of the full two-level factorial design 24 (N=1)*
Experiment Pyrolysis
Temperature / oC
Pyrolysis time / s
Atomization
Temperature / oC
Modiier
mass / μg
Integrated absorbance / s
1 − 1 (600) − 1 (10) − 1 (1300) − 1 (5) 0.07677
2 1 (800) − 1 (10) − 1 (1300) − 1 (5) 0.05289
3 − 1 (600) 1 (30) − 1 (1300) − 1 (5) 0.07436
4 1 (800) 1 (30) − 1 (1300) − 1 (5) 0.03625
5 − 1 (600) − 1 (10) 1 (1500) − 1 (5) 0.06372
6 1 (800) − 1 (10) 1 (1500) − 1 (5) 0.04699
7 − 1 (600) 1 (30) 1 (1500) − 1 (5) 0.06137
8 1 (800) 1 (30) 1 (1500) − 1 (5) 0.03924
9 − 1 (600) − 1 (10) − 1 (1300) 1 (15) 0.07714
10 1 (800) − 1 (10) − 1 (1300) 1 (15) 0.06716
11 − 1 (600) 1 (30) − 1 (1300) 1 (15) 0.07568
12 1 (800) 1 (30) − 1 (1300) 1 (15) 0.06244
13 − 1 (600) − 1 (10) 1 (1500) 1 (15) 0.06401
14 1 (800) − 1 (10) 1 (1500) 1 (15) 0.05838
15 − 1 (600) 1 (30) 1 (1500) 1 (15) 0.06150
16 1 (800) 1 (30) 1 (1500) 1 (15) 0.04464
17 0 (700) 0 (20) 0 (1400) 0 (10) 0.06723
18 0 (700) 0 (20) 0 (1400) 0 (10) 0.06759
19 0 (700) 0 (20) 0 (1400) 0 (10) 0.06647
20 0 (700) 0 (20) 0 (1400) 0 (10) 0.06854
21 0 (700) 0 (20) 0 (1400) 0 (10) 0.06812
*Real values are in parentheses.
Figures of merit
Using the experimental conditions established in the optimization step, the method allows the direct determination of cadmium in wine with a characteristic mass of 0.7 pg, limit of detection and quantification (calculated as 3δ/s and 10δ/s, where δ is the standard deviation of the blank solution and s the slope of analytical curve employed) were 0.030 and 0.100 µg L−1, respectively,
for a sample volume of 20 µL.33
The slope of the analytical curves established with aqueous standards, (0.084 ± 0.002, N=3) s L µg-1,was
always lower than that obtained for wine samples using the analyte addition technique, although the same modifier was used in all cases. For this reason the slope of the addition curve was determined for six wine samples. The values were 0.130; 0.121; 0.114; 0.115; 0.123 and 0.123 s L µg−1.
All the other wine samples were analyzed using the average slope of (0.121 ± 0.006, N=6) s L µg−1 calculated for the
six selected samples.
The precision (expressed as relative standard deviation of seven repetitive determinations) was evaluated for three wine samples with cadmium concentrations of 1.29,
0.27 and 0.36 µg L−1, and was 0.30%, 0.37% and 0.49%,
respectively. The accuracy was investigated by comparing the results obtained with this method for five wine samples with those found after complete mineralization using acid digestion and determination with ET AAS; the results are presented in Table 3. The linear regression method was used to compare the results obtained with the two methods, and the equation expressed as confidence intervals was:
[Digestion procedure] = 1.20 ± 0.27 [Direct method] − 0.12 ± 0.22, r = 0.9926
These results demonstrate that the calculated slope and intercept do not differ significantly from the “ideal” values of 1 and 0, respectively, and that there is no evidence for a systematic difference between the two methods for the determination of cadmium in wine.
Using the optimized conditions up to 400 firings were possible with the same tube without sensitivity losses.
Application
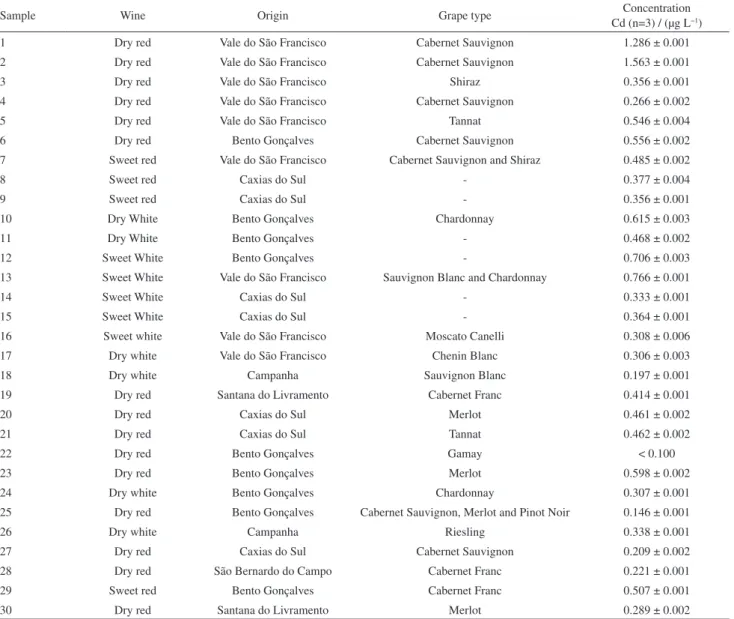
The proposed method was applied for the determination of cadmium in 30 Brazilian wine samples from the following regions: Vale do São Francisco, Bento Gonçalves, Campanha, Caxias do Sul, Santana do Livramento and São Bernardo do Campo. All samples were analyzed in triplicate. The results are shown in Table 4; the cadmium content varied from 0.146 to 1.56 µg L−1, with an average concentration of 0.460 µg L−1.
These values are in agreement with data reported in the literature for cadmium content in wines.11,34,35 All values
found in this study were significantly lower than the permissible maximum level stipulated by the International Organization of Vine and Wine (OIV) and also by Brazilian legislation.
Conclusions
The experimental conditions established by two-level full factorial design for the determination of cadmium employing ET AAS are very similar to the conditions obtained using univariate methodology establishing conventional pyrolysis and atomization curves. However, optimization using factorial design makes the determination of the experimental conditions with fewer experiments possible, obtaining information for all the four factors involved in the process.
The wine matrix has an effect on the integrated absorbance signal of cadmium and also on the slope of the calibration curves. This effect is significantly different for undigested and acid digested wine. It is
Figure 2. Pyrolysis (Ta = 1200 oC) and atomization (Tp = 600 oC) curves for 20 µL of Cabernet Sauvignon wine using 15 µg Pd as chemical modifier (N=3).
Table 3. Evaluation of the accuracy of the proposed method (N=3)
Wine sample
Cd concentration (proposed method) /
(µg L−1)
Cd concentration (acid
digestion) / (µg L−1)
Dry red 1 1.286 ± 0.001 1.428 ± 0.008
Dry White 1 0.615 ± 0.003 0.681 ± 0.001
Sweet White 1 0.706 ± 0.003 0.713 ± 0.006
Sweet White 2 0.766 ± 0.001 0.759 ± 0.001
Table 4. Determination of cadmium in Brazilian wine samples (N=3)
Sample Wine Origin Grape type Concentration
Cd (n=3) / (µg L−1)
1 Dry red Vale do São Francisco Cabernet Sauvignon 1.286 ± 0.001
2 Dry red Vale do São Francisco Cabernet Sauvignon 1.563 ± 0.001
3 Dry red Vale do São Francisco Shiraz 0.356 ± 0.001
4 Dry red Vale do São Francisco Cabernet Sauvignon 0.266 ± 0.002
5 Dry red Vale do São Francisco Tannat 0.546 ± 0.004
6 Dry red Bento Gonçalves Cabernet Sauvignon 0.556 ± 0.002
7 Sweet red Vale do São Francisco Cabernet Sauvignon and Shiraz 0.485 ± 0.002
8 Sweet red Caxias do Sul - 0.377 ± 0.004
9 Sweet red Caxias do Sul - 0.356 ± 0.001
10 Dry White Bento Gonçalves Chardonnay 0.615 ± 0.003
11 Dry White Bento Gonçalves - 0.468 ± 0.002
12 Sweet White Bento Gonçalves - 0.706 ± 0.003
13 Sweet White Vale do São Francisco Sauvignon Blanc and Chardonnay 0.766 ± 0.001
14 Sweet White Caxias do Sul - 0.333 ± 0.001
15 Sweet White Caxias do Sul - 0.364 ± 0.001
16 Sweet white Vale do São Francisco Moscato Canelli 0.308 ± 0.006
17 Dry white Vale do São Francisco Chenin Blanc 0.306 ± 0.003
18 Dry white Campanha Sauvignon Blanc 0.197 ± 0.001
19 Dry red Santana do Livramento Cabernet Franc 0.414 ± 0.001
20 Dry red Caxias do Sul Merlot 0.461 ± 0.002
21 Dry red Caxias do Sul Tannat 0.462 ± 0.002
22 Dry red Bento Gonçalves Gamay < 0.100
23 Dry red Bento Gonçalves Merlot 0.598 ± 0.002
24 Dry white Bento Gonçalves Chardonnay 0.307 ± 0.001
25 Dry red Bento Gonçalves Cabernet Sauvignon, Merlot and Pinot Noir 0.146 ± 0.001
26 Dry white Campanha Riesling 0.338 ± 0.001
27 Dry red Caxias do Sul Cabernet Sauvignon 0.209 ± 0.002
28 Dry red São Bernardo do Campo Cabernet Franc 0.221 ± 0.001
29 Sweet red Bento Gonçalves Cabernet Franc 0.507 ± 0.001
30 Dry red Santana do Livramento Merlot 0.289 ± 0.002
not related to the alcohol content and it was very similar for all wines investigated in this study. Hence it was possible to correct for this effect using the addition calibration technique, i.e., using the average slope of the analyte addition curves of a few selected wine samples for calibration.
The cadmium content found in Brazilian wines was always lower than the maximum permissible level stipulated by the International Organization of Vine and Wine (OIV) and also by Brazilian legislation.
Acknowledgments
The authors are grateful to the Fundação de Amparo à Pesquisa do Estado da Bahia (FAPESB), the Conselho Nacional de Desenvolvimento Científico e Tecnológico
(CNPq) and the Coordenação de Aperfeiçoamento de Pessoal de Nível Superior (CAPES) for providing grants and fellowships and for financial support.
References
1. Pohl, P; TrAC,Trends Anal. Chem.2007, 26, 941.
2. Dessuy, M. B.; Vale, M. G. R.; Souza, A. S.; Ferreira, S. L. C.; Welz, B.; Katskov, D. A.; Talanta2008, 74, 1321.
3. Moreno, I. M.; González-Weller, D.; Gutierrez, V.; Marino, M.; Cameán, A. M.; González, A. G.; Hardisson, A.; Microchem. J. 2008, 88, 56.
4. Ferreira, S. L. C.; Souza, A. S.; Brandão, G. C.; Ferreira, H. S.; dos Santos, W. N. L.; Pimentel, M. F.; Vale, M. G. R.; Talanta
2008, 74, 699.
6. Cesarino, I.; Marino, G.; Matos, J. D. R.; Cavalheiro, E. T. G.;
J. Braz. Chem. Soc.2007, 18, 810.
7. Friberg, L.; Kjellstrom, T.; Nordberg, G.; Piscator, M. In
Handbook on the Toxicology of Metals; Friberg, L., ed.;
Elsevier: Amsterdam, 1979, p. 355.
8. OIV-International Organisation of Vine and Wine; Code Sheet, 1st ed., 2008.
9. Ministry of Agriculture; Federal Decree N. 99,066, Brazil, 1990.
10. Krystyna, P.; Crit. Rev. Anal. Chem. 2004, 34, 69.
11. Ajtony, Z.; Szoboszlai, N.; Suskó, E. K.; Mezei, P.; György, K.; Bencs, L.; Talanta 2008, 76, 627.
12. Buldini, P. L.; Cavalli, S.; Sharma, J. L.; J. Agric. Food Chem.
1999,47, 1993.
13. Kim, M.; Food Addit. Contam. 2004, 21, 154.
14. Farinas, M. V.; Garcia, J. B.; Martin, S. G.; Crecente, R. P.; Latorre, C. H.; Anal. Chim. Acta 2007, 591, 231.
15. Oliveira, A. M.; Silva, G. A.; Poppi, R. J.; Augusto, F.; J. Braz. Chem. Soc. 2008,19, 1041.
16. Uliana, C. V.; Riccardi, C. S.; Tognolli, J. O.; Yamanaka, H.;
J. Braz. Chem. Soc. 2008, 19, 782.
17. Amorim, V. R.; Polito, W. L.; Gomes Neto, J. A.; J. Braz. Chem. Soc. 2007, 18, 47.
18. dos Santos, J. S.; dos Santos, N. S.; dos Santos, M. L. P.; dos Santos, S. N.; Lacerda, J. J. D. J.; J. Braz. Chem. Soc. 2008,
19, 502.
19. Araújo, R. G. O.; Macedo, S. M.; Kom, M. D. G. A.; Pimentel, M. F.; Bruns, R. E.; Ferreira, S. L. C.; J. Braz. Chem. Soc. 2008,
19, 935.
20. Panero, F. S.; da Silva, H. E. B.; Microchem. J. 2008,88, 194.
21. Massart, D. L.; Vandeginste, B. G. M.; Buydens, L. M. C.; de Jong, S.; Lewi, P. J.; Smeyers-Verbeke, J. In Handbook of
Chemometrics and Qualimetrics: Part A; Elsevier: Amsterdam,
1977.
22. Barros Neto, B.; Scarmínio, I. S.; Bruns, R. E.; Planejamento
e Otimização de Experimentos; Editora da UNICAMP:
Campinas, 1995.
23. Ferreira, S. L. C.; dos Santos, W. N. L.; Quintella, C. M.; Barros Neto, B.; Bosque-Sendra, J. A.; Talanta2004, 63, 1061. 24. Ferreira, S. L. C.; Bruns, R. E.; Ferreira, H. S.; Matos, G. D.;
David, J. M.; Brandão, G. C.; da Silva, E. G. P.; Portugal, L. A.; dos Reis, P. S.; Souza, A. S.;dos Santos, W. N. L.; Anal.
Chim. Acta2007, 597, 179.
25. Benzo, Z.; Monteiro, T.; Quintal, M.; Sierraalta, A.; Ruette, F.;
J. Anal. At. Spectrom. 1996, 11, 445.
26. Grinberg, P.; Campos, R. C.; Spectrochim. Acta, Part B2001,
56, 1831.
27. Pereira-Filho, E. R.; Poppi, R. J.; Arruda, M. A. Z.; Quim. Nova
2002, 25, 246.
28. dos Santos, L. M. G.; Quim. Nova2008, 31, 975.
29. Ferreira, S. L. C.; Korn, M. D. G. A.; Ferreira, H. S.; da Silva, E. G. P.; Araújo, R. G. O.; Souza, A. S.; Macedo, S. M.; Lima, D. C.; de Jesus, R. M.; Amorim, F. A. C.; Bosque-Sendra, J. M.; Appl. Spectrosc. Rev. 2007, 42, 475.
30. Silva-Filho, E. V.; Sella, S. M.; Spinola, E. C.; Santos, I. R.; Machado, W.; Lacerda, L. D.; Microchem. J.2006, 82, 196. 31. Fernandes, K. G.; de Moraes, M.; Gomes Neto, J. A.; Nóbrega,
J. A.; Oliveira, P.V.; Analyst2002, 127, 157.
32. Statistica for Windows;StatSoft, Inc.: Tulsa, USA, 1999. 33. IUPAC Analytical Chemistry Division; Spectrochim. Acta B
1978, 33, 242.
34. Jaganathan, J.; Reisig, A. L.; Dugar, S. M.; Microchem. J.1997,
56, 221.
35. Freschi, G. P. G.; Dakuzaku, C. S.; de Moraes, M.; Nóbrega. J. A.; Gomes Neto, J. A.; Spectrochim. Acta, Part B2001, 56, 1987.
Received: November 17, 2008
Web Release Date: May 6, 2009