The focus of the paper is the analysis of accidental loads used for garage loors considering the recommendations of national and international norms on the load values to be applied on those loors. The Brazilian norm NBR 6120/1980 [1], on the subject, does not specify concentrated loads while Euro Code [2] and IBC international [3] norms recommend that distributed and concentrated loads shall be considered. Currently, wafle slabs are widely used in garage loors. In this context, considering the standards of the most used vehicles in the country, we ask: are the values of the distributed loads from the norms suitable for slab design? Or is it necessary to correct these loads to account for concentrated loads on the order of 8.5 kN per share corresponding to a utility vehicle tire? The objective of the present study is to ind answers for those two ques -tions through parametric analysis involving the main parameters of a wafle slab, which are: side ratio λ (lambda), spacing between the main ribs and scheme of slab support (one-way or two-way) The set of simulations shows that the loads recommended by the mentioned norms need to be corrected when used in garage loors to reproduce the effect of the loads concentrated in the tires of utility vehicles.
Keywords: accidental load, garage loor, one-way wafle slab and two-way ribbed slam, inite element method.
O trabalho tem como foco a análise das cargas acidentais utilizadas para pavimentos de garagem, considerando as recomendações de normas nacionais e internacionais para a deinição do valor das cargas a serem aplicadas nas lajes nervuradas. A norma brasileira NBR 6120/1980 [1], que trata do assunto, não especiica nada em relação a cargas concentradas, enquanto normas internacionais como Euro Code [2] e IBC [3], recomendam considerar cargas distribuídas e concentradas. Atualmente, as lajes nervuradas são utilizadas amplamente em pavimentos de garagem. Neste contexto, considerando os padrões de veículos mais utilizados no país, será que os valores de cargas distribuídas das normas são adequados para o dimensionamento das lajes nervuradas? Ou é necessário fazer uma correção destas cargas para levar em consideração as cargas concentradas da ordem de 8,5 kN por pneu correspondente a um veículo utilitário. O objetivo deste trabalho é procurar as respostas para estas duas perguntas através de uma análise paramétrica envolvendo os principais parâmetros de uma laje nervurada, que são: a relação λ (lambda) entre os lados, a distância entre as nervuras principais e o esquema de apoio da laje (uni ou bidirecional). De uma forma geral o conjunto das simulações mostra que as cargas recomendadas pelas normas citadas precisariam de correção quando utilizadas em pavimento de garagem para reproduzir o efeito das cargas concentradas das rodas de veículos tipo utilitário.
Palavras-chave: carga acidental, pavimento garagem, laje nervurada unidirecional e laje nervurada bidirecional, método dos elementos initos.
Análise de cargas acidentais em pavimentos de garagem
D. A. Tenório a [email protected]
P. C. C. Gomes b [email protected]
J. m. Désir c [email protected] e. L. m. UChôA a [email protected]
a E.M.UCHÔA Engenharia, Maceió, AL, Brasil; b Instituto PPGEC/UFAL, Maceió, AL, Brasil; c Instituto PPGEC/UFRGS, Porto Alegre, RS, Brasil.
Received: 6 Nov 2013 • Accepted: 14 Apr 2014 • Available Online: 05 Aug 2014
Abstract
1. introduction
Currently many reinforced concrete building designs include rela-tively large clear spans for auditoriums, showrooms, garage loors and recreational areas. In those cases, the spans need to have a greater thickness to increase the stiffness and reduce delection. In this manner, massive slabs considerably increase their own weight. In this scenario, wafle slabs appear as a suitable solution because, while increasing the stiffness, they ensure weight reduction. Indeed, cast-in-situ wafle slabs (CISWS) have been widely used in such situations because they are more economically advanta-geous than lat slabs with a lower consumption of concrete and steel, which provides a lighter structure ((Figure 1).
The concept of wafle slab can be described in a relatively easy way. When the spans have 4 m or more (Dantas and Nascimento 2009) [5], lat slabs have a small region of compressed concrete, and therefore, there is excess concrete below the neutral axis of the region under tension, the contribution of which to bending is not taken into consideration in the design. This ends up not helping the lexural strength but signiicantly increases the slab own-weight. Consequently, nothing more reasonable than substituting it with an inert material or simply leave voids, generating a more economical and eficient slab model, the wafle slab.
In this context of economy and eficiency, we seek to reduce concrete and steel consumption and, increase bending strength through the solution of a wafle slab. In addition, the shuttering techniques applied to wafle slabs aim at reducing the casing cost, avoiding constructing casings for all the ribs. In wafle slabs, this drawback is overcome, for instance, with reusable casings of rein -forced plastic, which support not only the weight of the fresh con-crete, but also the weight of the reinforcement, the equipment and the workers.
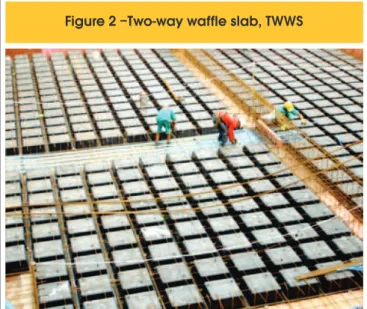
According to item 14.7.7 of NBR 6118:2007 [6], the CISWS pres -ent a tension area composed by ribs among which inert material can be placed. The CISWS can be one-way (OWWS) or two-way (TWWS) wafle slabs. TWWS (Figure 2) are used when the side ratio is not higher than two, a situation when there is an effort reduction and distribution of actions in the entire outline. The ribs (stringers) are parallel to the directions of the outline edges, mu-tually orthogonal and have the same distance between axes in both directions.
OWWS (Figure 3) has a different rib system than TWWS, because it
has main and secondary ribs: main ribs on the direction of the small -est span and secondary ribs follow the direction of the larg-est span. The distances between the rib axes differ between the two direc -tions; they are larger for the secondary ribs and smaller for the main ribs. When the distance between the rib axes are equal in both direc -tions, the wafle slab is no longer one-way and becomes two-way. Regarding the consumption of steel and concrete, Tenório et al. (2009) [7] published a study showing that OWWS are more eco -nomic that TWWS, in situations when the relation between the lon -gest side and the shortest is equal or greater than 1.4. To analyze wafle slabs, it is important to deine the acting loads, whether con -centrated or distributed.
Live loads in garage loors from different types of vehicles are usu -ally higher than the permanent loads, mainly because currently the new vehicles in the market have loads higher than 30kN, distrib -uted between the tires in contact with the slab. The values and applications of those loads follow speciic recommendations of the regulations of each country.
The international regulations, such as the EuroCode 1:2002 [2] and the International Building Code 2009 (IBC (2009) [3] present load values, related to the vehicle weight, that should be applied to the loor, through
Figure 1 – Cast-in-situ waffle slab structure (Silva, 2005) [4]
four small areas that represent the contact of the tires with the slab. Those loads distributed in square areas with side sizes ranging from 0.10 to 0.12 m are considered concentrated. On the other hand, the Brazilian regulation NBR 6120:1980 [1] adopts a minimum value of dis -tributed load per square meter of area that should be applied to the slab and does not take into consideration the analysis of the concentrated loads representing the contact of the tire with the slab. Besides, the Brazilian regulation, which is from the 80s,adopts a value of up to 25 kN as the maximum load for passenger vehicles, when nowadays it is common to ind vehicles with maximum loads up to 40 kN.
2. objectives
When making a preliminary design or a simpliied analysis, using distributed loads provides greater speed in the calculations. How-ever, it is important that the distributed load used represents the actual situation under analysis. In this sense, the main objective of the present paper is to deine an equivalent load that represents the vehicle load applied to the slab through tire contact, for dif-ferent conigurations of wafle slabs whether one-way or two-way. The results obtained applying the vehicle load as concentrated load (CL) and distributed load (DL) according to NBR 6120:1980 [1] are compared for garage loor OWWS and TWWS.
3. methodology
Considering the basic coniguration in Figure 4 of a single wafle slab, launched as OWWS and TWWS, various numerical simula -tions were performed for different λ (lambda) values, distance be -tween main ribs (MRS), and amount of secondary ribs (ASR) using the inite element method through a speciic analysis program. The analysis of the delection trend revealed two interesting as -pects: the possibility of comparing the delection generated by the distributed load (DL), recommended by the NBR 6120:1980 [1], with the delection generated by the concentrated load (CL) and the possible setting of DL values that provide equal delections to those generated by the CL. In this manner, it might be possible to
conduct an analysis using DL and obtain values close to those of an analysis performed with CL, to calculate rib delections and bend -ing moments, which would be a signiicant contribution to improve the development of structural designs, once an analysis using CL is much more complex and time consuming than an analysis using DL. The height of the slab is deined by a preliminary design the algo -rithm of which is based on the recommendations of NBR 6118:2007 [6] for the calculus of beams at service loads (Tenório, 2011) [8]. This preliminary design is performed through the previous knowl -edge of the other slab dimensions and the requested load. The ABAQUS program, which is widely known in the academic sphere and has a wide range of elements and analysis models was used in the simulations. A sensitivity analysis was performed to deine the level of mesh reinement needed to ensure consistent results.
3.1 Model description
After deining the height of the slab on the preliminary design, a set of models combining different values of MRS, ASR and
ac-Figure 3 – One-way waffle slab, OWWS
cidental loads was deined. They were treated as modeling ex -amples of one-way and two-way (OTE) wafle slabs, with the fol -lowing considerations:
1) MRS values are constant and can be taken as equal to 0.50; 0.60; 0.65; 0.70; 0.80; 0.90 and 1.00 m;
2) one-way wafle slabs (OWWS) have main rib spacing (MRS) different from secondary rib spacing (SRS), models with 1, 2 or 3 secondary ribs were considered;
3) for the two-way wafle slabs (TWWS), for each MRS, the neces -sary ASR is deined so that the spacing between the main ribs (MRS) is equal to the secondary rib spacing (SRS);
4) the applied loads are the self-weight and the regulation live load;
thus, for each model, on the one hand, the value of the distrib-uted load recommended by NBR 6120:1980 [1] was considered while, on the other hand, the concentrated loads corresponding to three vehicle classes currently in use in the Brazilian market were also considered.
Figures 5 and 6 illustrate the details of the coniguration under consideration and the positioning of the tires (small 0.10 x 0.10 m areas) where the concentrated loads are applied.
In this manner it is possible to combine 7 different MRS with 4 ASR for two types of load and three types of vehicles totalizing 54 differ -ent analysis situations. Table 1 lists the geometric data of the differ-ent models obtained by combining the parameters deined above,
-2
Figure 5 – Geometric illustration of OTE and arrangement of the concentrated loads (measured in 10 m)
with: h the height of the slab; hn the height of the rib; ec the thick -ness of the table; bw the width of the rib; MRS the spacing between the axis of the main ribs; SRS the spacing between the axis of the secondary ribs, LX the shorter side of the slab; LY the longest side of the slab; C’ the distance from the center of the reinforcement to the rib lower base; ds the diameter of the reinforcement in the
secondary rib, dp the diameter of the reinforcement in the main rib The distributed load applied in the models corresponds to the val-ue currently in force in the NBR6120:1980 [1], i.e., 3 kN/m2. For
the concentrated loads, the weights of three different vehicles are considered, which represent current models in the Brazilian Mar -ket: compact, sedan and wagon (utility). Table 2 lists the geometry and load information of the vehicles used.
This data was used to position the vehicle on the slab and to de-termine the load transmitted by the vehicle to the slab through the contact of the tire with the loor. In the modeling, for each type, the loads in each tire correspond to half the total weight of the “front axle”, as indicated in Table 3.
These values deine the load values and position used in the anal -ysis. The vehicles are positioned to cover the most unfavorable situation. Considering the adopted control parameter, the position should generate the largest delections.
Table 1 – Geometric data of idealized slabs, in m
MRS LY A B C D bw h hn ec C ' ds dp
0.50 0.60 0.65 0.70 0.80 0.90 1.00 6.00 6.00 6.00 6.00 6.00 6.00 6.00 2.95 2.95 2.95 2.95 2.95 2.95 2.95 1.35 1.35 1.35 1.35 1.35 1.35 1.35 0.90 0.85 1.95 0.80 1.15 0.70 0.65 0.40 0.45 1.15 0.50 0.15 0.60 0.65 0.09 0.09 0.09 0.09 0.09 0.09 0.09 0.28 0.28 0.28 0.28 0.28 0.28 0.28 0.23 0.23 0.23 0.23 0.23 0.23 0.21 0.05 0.05 0.05 0.05 0.06 0.06 0.07 0.04 0.04 0.04 0.04 0.04 0.04 0.04 0.008 0.008 0.008 0.008 0.008 0.008 0.008 0.0176 0.0176 0.0176 0.0176 0.0176 0.0176 0.0176
Table 2 – Geometric measures and loads of the vehicle types
Vehicle model Compact Sedan Wagon Vehicle types Total weight of the front axle (kN)
Total weight ofrear axle (kN) Weight of operating vehicle (kN)
Total gross weight (kN) a (m) b (m) c (m) d (m) e (m) f (m) 9.00 8.60 13.00 17.60 0.08 0.80 0.70 0.08 1.80 4.25 12.80 9.10 17.10 21.90 0.09 0.80 0.90 0.09 1.85 4.80 16.75 13.35 20.10 30.10 0.09 0.80 1.20 0.09 1.80 5.26
Table 3 – Values of the loads transmitted
by the tires and used in the simulations
Vehicle model
compact
sedan
wagon
Load in the tire (kN)
4.50
6.50
8.50
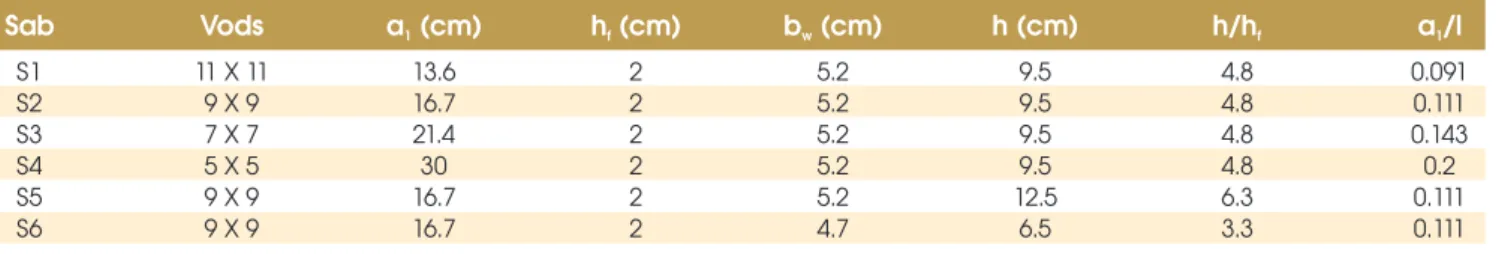
Table 4 – Geometric characteristics of the slabs tested by Abdul-Wahab and Khalil (2000) [9]
Sab Vods a (cm)1 h (cm)f b (cm)w h (cm) h/hf a /l1
S1 S2 S3 S4 S5 S6
11 X 11 9 X 9 7 X 7 5 X 5 9 X 9 9 X 9
3.2 Type of element and reinement
The selection of the type of element and reinement focused on inding good responses with the smallest analysis time. To this end, numerical models were performed of an experimental mod -el of one of the wafle slabs tested by Abdul-Wahab and Khalil (2000) [9]. Tables 4 and 5 and Figure 7 present the geometric
characteristics and mechanical properties of the experimental models.
The model numerically simulated was experimental model S1, because it presented the largest delections. The delection val -ues of the experimental model were compared with the val-ues of the numerical model. In the numerical simulations, the values of 10 kN and 20kN were used, which still correspond to a linear
Table 5 – Characteristics of slabs tested by Abdul-Wahab and Khalil (2000) [9]
Slab f (MPa)ck E (kN/cm²)cs G (kN/cm²)c Pcracking (kN) P (kN)last
S1 S2 S3 S4 S5 S6
31.3 32.0 31.4 28.9 29.9 29.1
2663.05 2692.66 2667.30 2558.92 2602.81 2567.75
30 20 20 20 40 20
105 81 65 48 120
48 399.46
403.90 400.10 383.84 390.42 385.16
-2
Figure 7 – Basic geometry (measures in cm, 10 m) of the slabs tested by Abdul-Wahab and Khalil (2000) [9]
Table 6 – Deflection of experimental and numerical analyses
Load Numerical analysis
-2
S4R (10 m) C3D20 (10 m)-2
Experimental analysis
– 10kN 20kN
-2
(10 m) -0.01 -0.03
10% -0.0255 -0.0473
20% -0.0257 -0.0475
30% -0.0258 -0.0477
40% -0.0279 -0.0516
10% -0.0145 -0.0277
20% -0.0143 -0.0273
30% -0.0141 -0.0269
behavior, according to the experimental results presented by the authors where a cracking load of 30 kN was observed as shown in
Table 5. These loads were applied in a centered area of the slab, as illustrated in Figure 7.
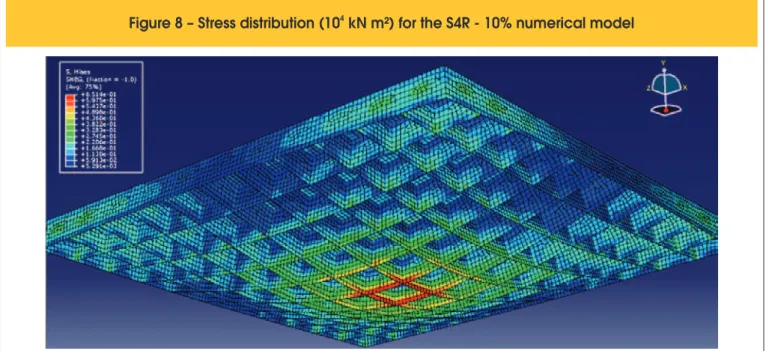
Table 6 presents the delection values for the numerical and ex -perimental models (ex-perimental model S1). The simulations were performed with surface elements (S4R shell model) and 3D (C3D20 volume model) following the usual ABAQUS nomencla -ture. For each case, meshes with four element sizes were adopt -ed: 1.36 cm (10% of the span), 2.72 cm (20% of the span), 4.08 cm (30% of the span) and 5.44 cm (40% of the span), with the span deined as the spacing between the rib axes.
In Table 6, it can be observed that the model of 3D element with a size equal to 10% span is the model that presents values closer to the experimental model. However, the delections that correspond to a 10% size are not very different from those obtained with a 20% size (less than 2%). Therefore, it can be assumed that the delec -tion values obtained with the 20% size provide suficient accuracy, because the gain obtained with the 10% size is negligible. Figure 8 shows the stress distribution without concentration, con-sistent with the applied load indicating that the mesh reinement is adequate.
This preliminary analysis where the experimental results of Ab -dul-Wahab and Khalil (2000) [9] were reproduced, allowed dein -ing the types of inite elements that can be used as well as the acceptable level of reinement for consistent results. It is clearly noted that considering shell elements shows a more lexible struc -ture. Then, the same parameters are used to create the models that correspond to the different combinations mentioned in section 3.1.
4. results
Considering the objectives of the analysis, the results are explored through the comparison of the delections obtained with the distrib -uted loads from the regulations and those obtained with the con-centrated loads. The distributed loads equivalent to the weights of different types of vehicles are also deduced. Due to the large 4
Figure 8 – Stress distribution (10 kN m²) for the S4R - 10% numerical model
Figure 9 – Ratio between the deflection generated
by the vehicles and the distributed
number of combinations, a XX-YY-MRS coding is deined where XX refers to one delection or vehicle load, YY represents the type of vehicle and MRS the spacing between the main ribs for the com-bination under study. In general, it is worth highlighting the inlu -ence of each parameter on slab behavior.
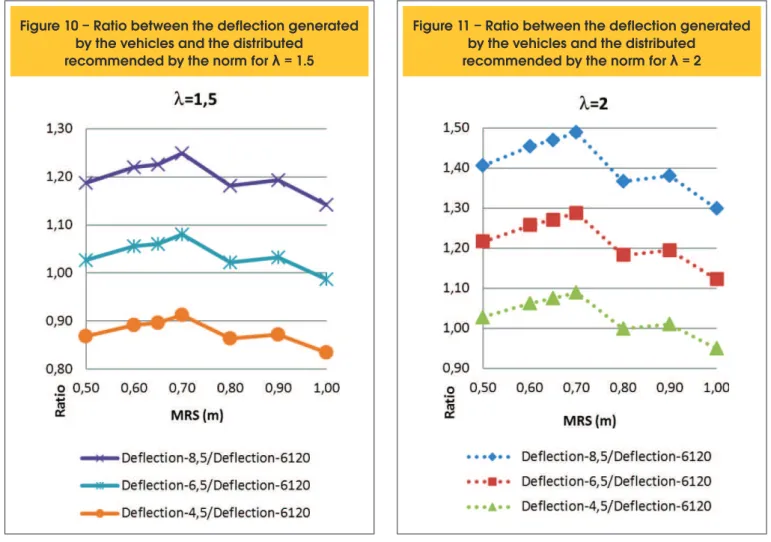
The results of this parametric analysis can be presented as curves that show the relationship among delections generated by the concentrated loads and those generated by the distributed loads for different values of the other parameters. In this manner, it is possible to have for each λ value (1; 1.5; 2) curves relating the de -lections obtained for each category of vehicle and those obtained for the distributed load recommended by the regulation (Figures 9, 10,11). Those curves correspond to a SRS value = 1.30 m. It can be noticed that the curves present an equal trend.
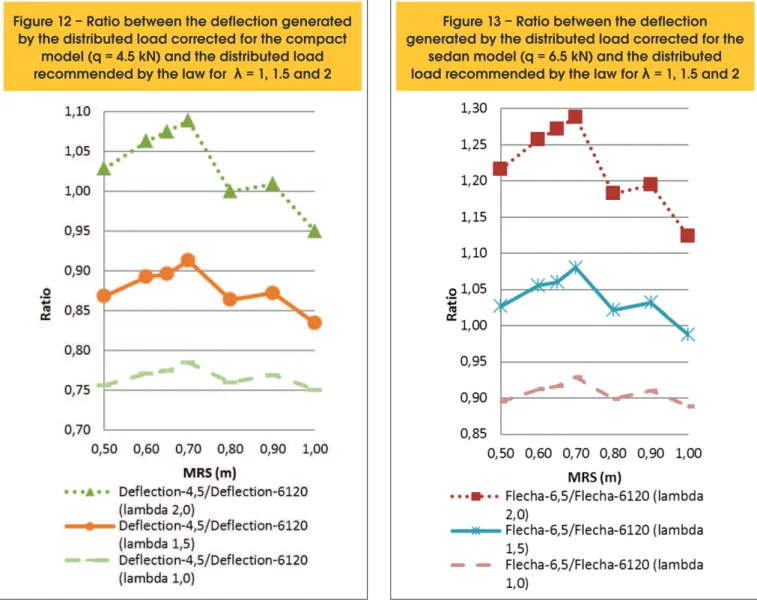
These curves illustrate the inluence of the slab geometry on the value of the necessary equivalent distributed load. On the other hand, the inluence of the type of vehicle can also be considered comparing, for each category, the curves obtained for the different λ values (Figures 12, 13, 14).
The delection ratio increases in all the cases for MRS values be -tween 0.50 and 0.70 m. For higher MRS values the ratio decreas-es. The analysis of the data of the curves shows for λ = 2 values higher than 1, indicating that for this λ value, the distributed load of 3.0 kN/m² is low. It should be higher to be representative. However, for λ = 1.5 the distributed load is consistent with the concentrated
loads of 6.5 kN and 4.5 kN, but the ratio is higher than one for an 8.5 kN load. Thus, the 3.0 kN/m2 load cannot be used to represent
the live load in this situation. When λ is equal to 1, all the delection ratios become smaller than 1, indicating that the load of the regula-tion is representative.
The analysis above shows that for higher loads (CL equal to 6.5 kN or 8.5 kN) the distributed load recommended by the regulation is not representative of the actual slab situation, for any λ value or any spacing between main ribs (MRS).
Therefore, it was considered appropriate to correct the DL values so that it had the same delection observed with the application of a CL, Table 7. In this table q NUM (kN/m2) is the DL that causes the same delection than the CL with NUM (kN) value.
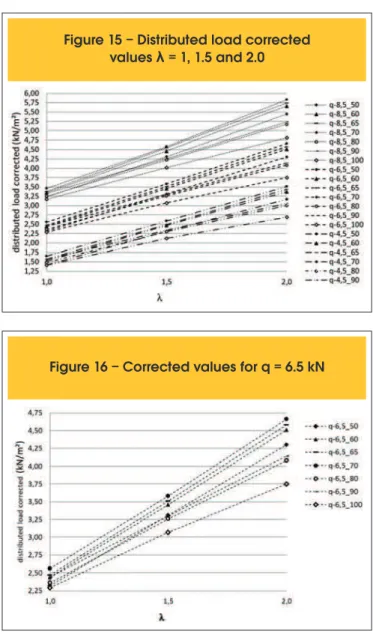
Table 7 shows the DL corrected values for each MRS, λ varying from 1.0 to 2.0. The DL corrected values show some linearity in relation to λ variation as shown in Figure 15 where q-NUM1_NUM2 (kN/m2) is the DL that causes the same delection that a CL of
NUM1 (kN) value in the model with MRS of NUM2 (m) value. However, there are two important observations for this range of λ values. First, analyzing the variation for a particular type of vehicle and the different MRS values (Figure 16), it can be observed that, for the same slab geometry, that is, the same λ, the rate of correc -tion depends on the MRS value.
On the other hand, extracting the curves that correspond to the same MRS, of 0.70 m, for example, it can be observed that the
Figure 10 – Ratio between the deflection generated
by the vehicles and the distributed
recommended by the norm for
λ
= 1.5
Figure 11 – Ratio between the deflection generated
by the vehicles and the distributed
dicating that, for the same MRS value, the correction rate is inde-pendent of the load (Figure 17).
All the results presented so far come from simulations performed with a single slab main span value (LY = 6m). To complete the analysis of the distributed load corrected values, additional mod-els were created to check a possible dependence on span length, i.e., models with different sizes although maintaining the same side ratio λ.
Initially, the situations in which the length of the main span LY is varied from 4 to 12 m maintaining the same λ = 2 were analyzed. The analysis took into consideration an MRS of 0.80 m and a CL of 8.5 kN (wagon type vehicle).The DL corrected values correspond -ing to these models are represented in Figure 18 where the varia-tion trend as a funcvaria-tion of LY can be observed. This trend can be easily itted by a polynomial function.
In a second step, the DL corrected value variation trend was checked considering different λ values for each LY analyzed. Figure19 presents the results obtained. As observed in the analy-sis with constant LY, the DL correction rate increases with λ value, showing almost the same trend for all the LY values considered. It
is important to note that for λ values higher than 2, the correction rate cannot be considered linear.
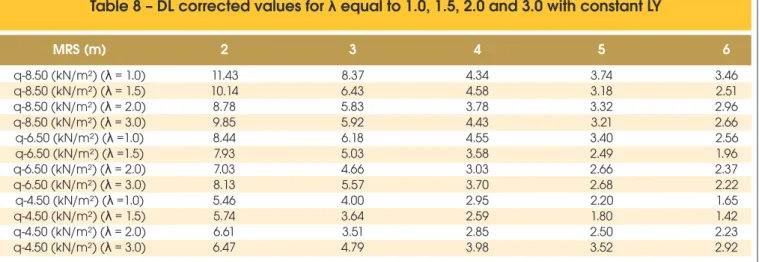
The values of this analysis for the three vehicle categories in Table 8 show the inluence of the slab geometry, deined here by λ value. The distributed load corrected values tend to decrease with the increase of λ.
5. Final considerations
The corrected DL (distributed load) values were deined in the delection analyses, considering that the vehicle load acting on the loor was of a single type, i.e., only vehicles with maximum loads per tire limited to 4.5 kN, or 6.5 kN, or 8.5 kN, but the performance of them acting together was not taken into consid -eration, which is usual in garage loors, where all types of ve -hicles are parked, without distinguishing speciic parking places for each model.
According to the National Trafic Department, DENATRAN, the Brazilian leet of compact, sedan and wagon vehicles is approxi -mately 42 million with 10% wagon and 90% vehicles that with -stand up to nine passengers including the driver, which are the
Figure 12 – Ratio between the deflection generated
by the distributed load corrected for the compact
model (q = 4.5 kN) and the distributed load
recommended by the law for
λ
= 1, 1.5 and 2
Figure 13 – Ratio between the deflection
generated by the distributed load corrected for the
vehicles mentioned in the present paper as sedan and compact. Taking this as a premise, it can be stated that the probability of, on a garage loor, a particular slab having only wagon type vehicles parked, generating the most unfavorable situation for the structure, is very low.
Thus, this study suggests, for general use of garage loors, a value of corrected accidental distributed load associated to ve-hicles with maximum load equal to 6.5 kN per tire, i.e., q-6.5. This load of 6.5 kN per tire also represents wagons, when they
Figure 14 – Ratio between the deflection
generated by the distributed load corrected for the
wagon model (q = 8.5 kN) and the distributed
load recommended by the law for
λ
= 1, 1.5 and 2
Table 7 – Distributed load corrected values for
λ
equal to 1.0, 1.5 and 2.0
MRS (m) 0.50 0.60 0.65 0.70 0.80 0.90 1.00
q-8.5 (kN/m²) for λ = 1.0 q-8.5 (kN /m²) for λ = 1.5 q-8.5 (kN /m²) for λ = 2.0 q-6.5 kN /m²) for λ = 1.0 q-6.5 (kN /m²) for λ = 1.5 q-6.5 (kN /m²) for λ = 2.0 q-4.5 (kN /m²) for λ = 1.0 q-4.5 (kN /m²) for λ = 1.5 q-4.5 (kN /m²) for λ = 2.0
3.23 4.31 5.44 2.32 3.31 4.30 1.42 2.31 3.17
3.35 4.46 5.66 2.44 3.46 4.51 1.52 2.47 3.37
3.38 4.55 5.74 2.47 3.51 4.58 1.57 2.49 3.44
3.46 4.58 5.83 2.56 3.58 4.66 1.65 2.59 3.51
3.25 4.22 5.17 2.36 3.26 4.08 1.48 2.30 3.00
3.33 4.26 5.23 2.44 3.30 4.14 1.56 2.34 3.06
3.17 4.02 4.81 2.29 3.07 3.75 1.41 2.12 2.69
Figure 15 – Distributed load corrected
values
λ
= 1, 1.5 and 2.0
are not fully loaded, that is, without passengers. Table 9 presents the corrected DL values (q-c), associated only to a concentrated
load (CL) of 6.5 kN. The values show two variation trends: one inversely proportional to LX variation and the other in the same direction than λ, indicating that using the values in Table 10, in structural design is conditioned to the slab geometry according to λ and LX values.
A reasonable distributed load value to be used in garage loors, currently, would be 4.0 kN/m². For slabs with LX smaller than 4m, the values should be raised with a ∅=1,15* (LX/l0),where l0=4.
6. references
[01] Associação Brasileira de Normas Técnicas (1980). Cargas
para o cálculo de estruturas de ediicações: NBR 6120:1980.
Rio de Janeiro.
[02] European Standard (2002).Eurocode 1: Actions on struc-tures — Part 1-1: General actions — Densities, self-weight,
imposed loads for buildings. Eurocode 1.
[03] International Building Code. IBC (2009). 2009
[04] Silva, M. A. (2005). Projeto e construção de lajes nervuradas
de concreto armado. Dissertação de Mestrado em Construção
Figure 17 – Corrected values for MRS = 0.70 m
Figure 1
ce4 m to 12 m spans and
8 – Distributed load (q-8.5) for the
λ
= 2.0
Figure 19 – Distributed load (q-8.5) for the
spans from 4m to 12m and
λ
from 1.0 to 3.0
Table 8 – DL corrected values for
λ
equal to 1.0, 1.5, 2.0 and 3.0 with constant LY
MRS (m) 2 3 4 5 6
q-8.50 (kN/m²) (λ = 1.0) q-8.50 (kN/m²) (λ = 1.5) q-8.50 (kN/m²) (λ = 2.0) q-8.50 (kN/m²) (λ = 3.0) q-6.50 (kN/m²) (λ =1.0) q-6.50 (kN/m²) (λ =1.5) q-6.50 (kN/m²) (λ = 2.0) q-6.50 (kN/m²) (λ = 3.0) q-4.50 (kN/m²) (λ =1.0) q-4.50 (kN/m²) (λ = 1.5) q-4.50 (kN/m²) (λ = 2.0) q-4.50 (kN/m²) (λ = 3.0)
11.43 10.14 8.78 9.85 8.44 7.93 7.03 8.13 5.46 5.74 6.61 6.47
8.37 6.43 5.83 5.92 6.18 5.03 4.66 5.57 4.00 3.64 3.51 4.79
4.34 4.58 3.78 4.43 4.55 3.58 3.03 3.70 2.95 2.59 2.85 3.98
3.74 3.18 3.32 3.21 3.40 2.49 2.66 2.68 2.20 1.80 2.50 3.52
Civil, Universidade Federal de São Carlos, São Carlos. [05] Dantas, M. F. C. and Nascimento, S. C. S. (2009). Análise
Comparativa entre Sistemas Estruturais Convencionais e
Estruturas de Lajes Nervuradas em Edifícios. Salvador.
Uni-versidade Católica do Salvador.
[06] Associação Brasileira de Normas Técnicas (2007).Projeto
de estruturas de concreto: NBR 6118:2007. Rio de Janeiro.
[07] Tenório, D. A.; Gomes, P. C. C.; Barboza, A. S. R.; Uchôa, E. L. M. (2009). Aspectos Técnicos Econômicos de Lajes
Nervuradas Unidirecionais e Bidirecionais. Congresso
Brasileiro do Concreto 51,Curitiba, Outubro.
[08] Tenório, D. A. Contribuição à análise de lajes nervuradas em pavimentos de garagem. Dissertação de Mestrado em Engenharia Civil - Estruturas, Universidade Federal de Ala-goas, 2011. Pg 117.
[09] Abdul-Wahab, H. M. and Khalil, M. H. (2000). Rigidity and Strength of Orthotropic Reinforced Concrete Wafle Slabs. Journal of Structural Engineering.
Table 9 – Corrected CACD (q-c)values for
λ
equal to 1.0, 1.5, 2.0 and 3.0
MRS (m) 2 3 4 5 6
q-8.50 (kN/m²) (λ = 1.0) q-8.50 (kN/m²) (λ = 1.5) q-8.50 (kN/m²) (λ = 2.0) q-8.50 (kN/m²) (λ = 3.0) q-6.50 (kN/m²) (λ =1.0) q-6.50 (kN/m²) (λ =1.5) q-6.50 (kN/m²) (λ = 2.0) q-6.50 (kN/m²) (λ = 3.0) q-4.50 (kN/m²) (λ =1.0) q-4.50 (kN/m²) (λ = 1.5) q-4.50 (kN/m²) (λ = 2.0) q-4.50 (kN/m²) (λ = 3.0)
11.43 10.14 8.78 9.85 8.44 7.93 7.03 8.13 5.46 5.74 6.61 6.47
8.37 6.43 5.83 5.92 6.18 5.03 4.66 5.57 4.00 3.64 3.51 4.79
4.34 4.58 3.78 4.43 4.55 3.58 3.03 3.70 2.95 2.59 2.85 3.98
3.74 3.18 3.32 3.21 3.40 2.49 2.66 2.68 2.20 1.80 2.50 3.52


![Table 5 – Characteristics of slabs tested by Abdul-Wahab and Khalil (2000) [9]](https://thumb-eu.123doks.com/thumbv2/123dok_br/18860505.417845/6.892.73.831.229.360/table-characteristics-slabs-tested-abdul-wahab-khalil.webp)