Authors Hussen Machado1 Helady Sanders Pinheiro1 Marcella Martins Terra1 Martha de Oliveira Guerra1 Rogerio Baumgratz de Paula1 Vera Maria Peters1
1 Federal University of Juiz de Fora.
Submitted on: 29/03/2012. Approved on: 11/08/2012.
Correspondence to: Hussen Machado.
Centro de Biologia da ReproduçãoC-BR, Universidade Federal de Juiz de Fora.
Rua José Lourenço Kelmer, s/n, Campus Universitário, São Pedro, Juiz de Fora, MG, Brasil. CEP: 36036-900.
E-mail: [email protected]
Introduction: The treatment of arterial hy-pertension (AH) in patients with metabolic syndrome (MS) is a challenge, since non drug therapies are difficult to implement and optimal pharmacological treatment is not fully established. Objective: To assess the blockade of the rennin angiotensin al-dosterone system (RAAS) in blood pressure (BP) in renal function and morphology in an experimental model of MS induced by high fat diet. Methods: Wistar rats were fed on high fat diet from the fourth week of life, for 20 weeks. The groups received Losartan or Spironolactone from the eighth week of life. We weekly evaluated the body weight and BP by tail plethysmography. At the end of the experiment oral glucose tol-erance, lipid profile, creatinine clearance tests, and the direct measurement of BP were performed. A morphometric kidney analysis was performed. Results: The ad-ministration of high-fat diet was associated with the development of MS, characterized by central fat accumulation, hypertension, hyperglycemia and hypertriglyceridemia. In this model there were no changes in renal histomorphometry. The blockade of angiotensin II (Ang II) receptor AT1 pre-vented the development of hypertension. The mineralocorticoid blockage did not have antihypertensive efficacy but was as-sociated with reduction of abdominal fat. Conclusion: The dissociation of the an-tihypertensive response to the blockades of Ang II receptors and mineralocorticoid indicates the involvement of Ang II in the pathogenesis of hypertension associated with obesity. Reduction of central obesity with Spironolactone suggests the presence of mineralocorticoid adipogenic effect.
Dissociation of antihypertensive and metabolic response
to losartan and spironolactone in experimental rats with
metabolic sindrome
A
BSTRACTKeywords: animals, hypertension, meta-bolic syndrome x, obesity, renin-angioten-sin system.
I
NTRODUCTIONObesity is a worldwide epidemic that oc-curs due to economic, social, and demo-graphic changes in different populations. The World Health Organization estimates that there are, at present, approximately 400 million obese individuals in the world and that the prevalence of obesity has in-creased substantially in recent decades.1,2
Obesity is a multifactorial disease, re-lated to hereditary factors and primarily to poor eating habits. This changing pro-file of nutritional patterns culminates in a positive energy balance, compounded by an association with a sedentary lifestyle, which together contribute to the devel-opment of metabolic syndrome (MS).3
To date, there is no specific treatment for MS; however, it is believed that the treatment of its com-ponents could reduce cardiovascular risk. Ideally, this treatment should be based on weight loss, since this is the most effective measure for preventing dia-betes, lowering cholesterol and triglyceride levels, and reducing IR and blood pressure.10 However, the success rate of this therapeutic measure is low, which leads to the need for specific treatment of dyslipid-emia, insulin resistance, and HTN.11
One of the biggest challenges for the clinician re-lates to the treatment of HTN in individuals with MS. As previously mentioned, nonpharmacological measures are often difficult to implement and drug-based treatment is not yet fully established.11
Some authors recommend the use of diuretics, which can interfere with metabolic parameters, while others suggest the importance of drugs that do not interfere with those parameters, such as calcium channel blockers and renin-angiotensin-aldosterone system (RAAS) inhibitors.
In recent years, the involvement of aldosterone in the genesis of HTN-associated obesity has been sug-gested. Studies in dogs15 and Sprague-Dawley rats16 demonstrated that blocking this system prevented increases in blood pressure as well as aldosterone-induced vascular injury. However, in both studies, the animals showed a positive sodium balance, a fac-tor that has been described recently as a mediafac-tor of the vasculotoxic action of aldosterone.17
Blockade of the RAAS seems effective in the con-trol of HA as well as hypertriglyceridemia and IR. However, the available studies are scarce and involve only a small number of patients, and therefore do not allow the generalization of this strategy for the treatment of HTN associated with MS.11,20
The use of experimental models of MS is an al-ternative to the study of causal mechanisms and the evaluation of treatment with antihypertensive medi-cation. Among these models, those that are induced by dietary modifications best reproduce the meta-bolic changes of human obesity, including dyslipid-emia, glucose intolerance, and hyperinsulinemia.21-23 In the present study, the effects of angioten-sin and aldosterone blockade on renal blood pres-sure, function, and morphology were assessed in an experimental model of MS induced by a hyper-lipidic diet.
M
ETHODSEXPERIMENTALMODEL
Male Wistar rats aged 4 weeks were provided by the Center for Reproductive Biology Federal University of Juiz de Fora and were randomly divided into 4 groups of 12 animals. In the control group (C), animals were fed a commercial Nuvital® (Nuvilab, Colombo, PR, Brazil) normocaloric diet (68% car-bohydrates, 19% protein, 3.5% lipids, 4.5% fiber, 5% vitamins and minerals, and 370 kcal/100 g) for 20 weeks. In the hyperlipidic group (H), the rats were fed a prefab high-fat diet (PragSoluções Comércio e Serviços Ltda., Jaú, SP, Brazil) containing: 35% car-bohydrates, 19% protein, 36.5% lipids, 4.5% fiber, 5% vitamins and minerals, and 524 kcal/100 g for 20 weeks (Table 1).
The hyperlipidic/losartan (H+L) and hyperlipidic/ spironolactone (H+E) groups received the same diet as group (H). From the age of 8 weeks, group H+L received losartan at 10 mg/kg/day (Merck SA, Rio de Janeiro, RJ, Brazil) and group H+E received spironolactone at
* Mineral Mix (g/kg of mix) contains: 30.5 g MgSO4.7H2O, 65.2 g NaCl, 105.7 g KCl, 200.2 g KH2PO4, 38.8 g MgCO3. Mg(OH)2.3H2O, 40 g FeC6H5O7.5H2O, 516.4 g CaCO3, 0.8 g KI, 0.9 g NaF, 1.4 g CuSO4.5H2O, 0.4 g MnSO4, and 0.05 g CoNO3.
# Vitamin Mix (g/kg of mix) contains: 3 g thiamine mononitrate, 3
g riboflavin, 3.5 g pyridoxine HCl, 15 g nicotinamide, 8 g calcium pantothenate, 1 g folic acid, 0.1 g biotin, 0.005 g cyanocobalamin, 0.013 g acetomenaphtone, 0.6 g vitamin A acetate, 25 g RRR-D-tocopherol acetate and 10 g choline chloride.
Ingredients Grams/Kg
Corn starch 200
Soybean meal 300
Fat 190
Saturated fatty acids 158.5
Unsaturated fatty acids 70
Fiber 30
L cystine 3.88
Choline chloride 2.58
BHT (antioxidant) 0.014
Mineral Mix* 35
Vitamin Mix# 10
Total 999.974
Total Kcal 5240
Lipidic Kcal 65%
TABLE 1 NUTRITIONALCOMPOSITIONOFTHEHYPERLIPIDIC
40 mg/kg/day (Pfizer SRL, Buenos Aires, Argentina) by
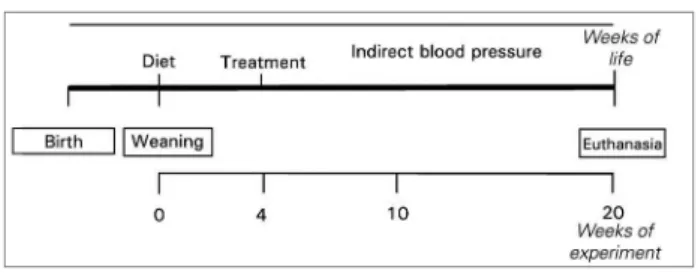
once-daily gavage for 16 weeks (Figure 1).
± 2°C for 5 minutes and 10 consecutive readings were obtained. The individual blood pressure measurement was calculated by averaging the readings obtained.26
DIRECTMETHOD
Direct measurements of SBP and diastolic blood pres-sure (DBP) were obtained in mmHg, at 20 weeks af-ter the start of the experiment, by cannulation of the right femoral artery under anesthesia with ketamine (90 mg/kg i.p.) and xylazine (10 mg/kg i.p.) (König SA®). Twenty-four hours after surgery, blood pressure
measurement was performed using the pulsatile blood pressure method with the ML865-25T pressure trans-ducer (ADInstruments®, Sydney, Australia).27
LIPIDS
Serum triglyceride and total cholesterol levels were evaluated 20 weeks after starting the di-ets, at the time of euthanasia, and after 8 hours of fasting, using commercially available kits (Labtest®, Lagoa Santa, Brazil).
ORAL GLUCOSE TOLERANCE TEST (OGTT)
Nineteen weeks after starting the diet, blood samples were collected from the cannula used to measure blood pressure (after an 8-hour fast) to evaluate the glucose level at time zero (T0) in all groups. A solu-tion of 50% glucose was administered by gavage at a dose of 2 g/kg of body weight. Subsequently, blood samples were collected at time T1 (15 min), T2 (30 min), T3 (60 min), and T4 (120 min) and all samples were analyzed in a glucometer (MediSense, Abbott®, Chicago, IL, USA). The area under the curve was cal-culated using Origin 3.5 software (Microcal Software, Northampton, MA, USA).28
Serum glucose levels were also measured at the time of euthanasia using a commercially available testing kit (Labtest®, Lagoa Santa, Brazil).
RENALFUNCTION
At the end of the experiment, blood samples were collected from all groups at the time of euthanasia (after an 8-hour fast) to measure serum creatinine (Cr) levels. Urinary Cr was measured in 24-hour urine samples harvested in the metabolic cage at this same point. The assays were performed using commercially All animals were monitored for 20 weeks.
Twenty-four hours prior to euthanasia, urine was collected in metabolic cages and the animals were implanted with catheters to measure direct blood pressure and evalu-ate oral glucose tolerance. Euthanasia was performed by exsanguination under anesthesia with ketamine (90 mg/kg ip.) and xylazine (10 mg/kg ip.) (König SA®, Avellaneda, Argentina). Kidney and blood samples were collected at the time of euthanasia (Figure 1).
All experimental procedures were approved by the Ethics Committee on Animal Experimentation of the Federal University of Juiz de Fora (No. 001/2009).
OBESITY
We considered animals obese when the weight differ-ence between the groups with hyperlipidic diets (H, H+L, and H+A) was significant compared to that of group C.24,25 Bilateral abdominal lipectomy was per-formed at 20 weeks of the experiment after euthana-sia with ketamine and xylazine and exsanguination. Subsequently, retroperitoneal (RET) and right and left epididymal (EP) adipose tissue weight (g) was obtained. These parameters were used as criteria for visceral obesity.24
For the calculation of food (g) and energy (kcal/ day) consumption, the animals were weighed and individually assigned to metabolic cages, with fixed quantities of dietary consumption measured once a week for a period of 24 hours.
BLOODPRESSURE
INDIRECTMETHOD
Systolic blood pressure (SBP) was measured in mmHg, weekly, using the noninvasive tail
plethysmogra-phy method (plethysmograph LE5001; Panlab®,
available kits (Labtest®, Lagoa Santa, Brazil) in a Labmax progress automatic analyzer (Labtest®, Lagoa Santa, Brazil).
After collection of individual urine (24-hour) samples, creatinine clearance (Ccr) was calculat-ed from the urinary Cr, serum Cr, 24-hour urine volume, and body weight, using the following equation: Ccr (mL/min/kg) = [Urine Cr (mg/dL) × urine volume (mL)/serum Cr (mg/dL)] [1000/ body weight (g)] [1/1440 (min)].29
RENALMORPHOLOGY
The right kidney was sectioned transversely and fixed in Baker’s formaldehyde-calcium, subsequent-ly embedded in paraffin and sectioned at 5-µm thickness, and stained with hematoxylin and eosin to assess glomerular morphology. Glomerular area and volume were assessed by morphometry. The glomerular area was quantified at 400× magnifica-tion. Only glomeruli in which the vascular pole was identified in the plane under study were selected for measurements in the cutting area, to ensure that the measured glomeruli were sectioned in similar planes. The glomerular images were scanned using an HBO50 Zeiss Axiophot microscope equipped with an Axicam ICc3 camera (Carl Zeiss®, Jena, Germany). After scanning, the glomerulus was iden-tified and the area was calculated in µm2 using anal-ysis software (Optimas 5.1; Optimas Corporation, Seattle, WA, USA). Twenty cortical glomeruli were measured in each animal, with 6 animals from each group. The glomerular volume (GV) was calculat-ed from the cross-sectional area of the glomerulus (CG), using the formula: GV = β/κ (CG)3/2, where
β = 1.38 is the shape coefficient for a sphere and
κ = 1.1 is the size distribution coefficient.30
STATISTICALANALYSIS
Results are presented as the mean and stan-dard deviation. The distribution of the sample was evaluated by the Kolmogorov-Smirnoff test. The control and hyperlipidemic groups were compared by Student’s t-tests. The hyperlipidic groups were compared by two-tailed analysis of variance (ANOVA) and post hoc Dunnett’s tests. The level of significance was set at p < 0.05. The Statistical Package for the Social Sciences (SPSS) 15.0 software was used for all analyses (SPSS Inc., Chicago, IL, USA).
R
ESULTSOBESITYANDMETABOLICSYNDROME
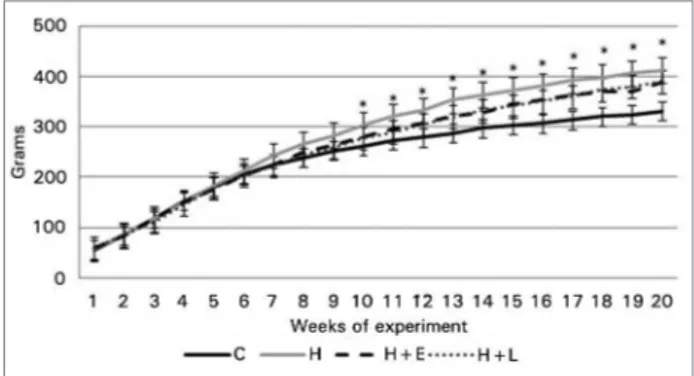
Despite the difference in dietary composition charac-terized by a higher percentage of lipids in group H, energy intake was similar between groups (Table 1). Over the 20-week study period, all animals gained weight. In the 10th week of the experiment, group H showed a 17.5% higher weight gain than group C (p < 0.001). From this point, groups H, H+E, and H+L maintained a higher weight than group C, with no difference between these hyperlipidic groups. At the end of the experiment, the weight gain of the 3 experimental groups was 22.8% higher than group C (p < 0.001, Figure 2).
Figure 2. Body weight measurements of the study groups.
Data are presented as mean ± standard error. Body weight measurements were performed weekly at different time points. The control and hyperlipidic groups were compared by Student's t-tests and the hyperlipidic groups were compared with each other by ANOVA and Dunnett’s tests. * p ≤ 0.05, control group vs. group H (Student’s t-test).
Besides the increase in body weight, groups H, H+E, and H+L developed visceral and EP fat accu-mulation at the end of the experiment (Table 2). On comparison, only the H+E group had lower RET fat accumulation than group H (11.0 ± 2.3 vs. 14.8 ± 3.1 g, p < 0.01).
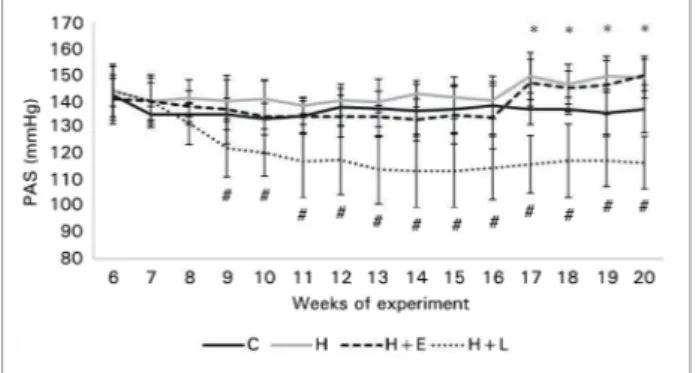
From the 17th experimental week, group H showed elevated SBP (Figure 3). This increase was confirmed at week 20 after direct measurement of blood pres-sure, in which group H showed a significant increase compared to group C (159.0 ± 10.1 vs. 118.7 ± 8.4 mmHg, p < 0.001). The same behavior was observed for DBP (94.3 ± 8.5 vs. 83.2 ± 6.2 mmHg, p < 0.001) (Figure 4).
the glucose curve in group H was significantly greater than that of group C in the OGTT (15.885 ± 1.837 vs. 21.449 ± 3.692).
TREATMENTS
BLOODPRESSURE
SBP remained high throughout the experiment in groups H and H+E. However, in the losartan-treated group (group H+L), a significant reduction occurred from the beginning of treatment (Figure 3).
METABOLIC PROFILE
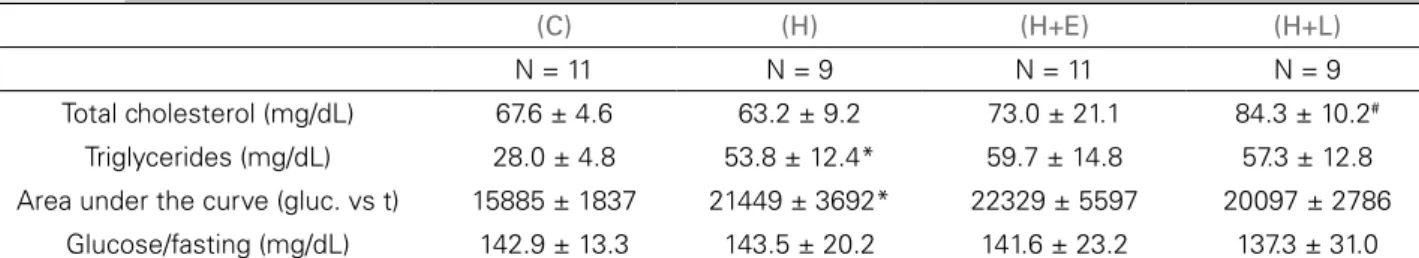
Triglyceride levels were not altered by the treatments, although increased cholesterol levels were observed in group H+L compared to group H (p < 0.001), as shown in Table 3.
There was also no change in the glycemic pro-file (fasting glucose level and area under the glucose curve) of animals undergoing antihypertensive treat-ments (Table 3 and Figure 5).
RENALFUNCTIONANDMORPHOLOGY
At the end of the study, the glomerular filtration sta-tus as assessed by Ccr did not change significantly be-tween the groups. The same finding was observed in relation to GV and glomerular area (Table 4).
D
ISCUSSIONThe obesity epidemic observed in the past decades has reached alarming proportions. It is estimated that 48% of the Brazilian population is overweight and about 15% is classified as obese.31 Obesity progresses with several metabolic, inflammatory, and humoral changes that are associated with the development of malignant neoplasms, DM, dyslipidemia, and HTN. Most HTN patients are overweight or obese, and the results of epidemiological studies suggest that
Figure 3. Blood pressure levels evaluated by indirect measurement in the study groups. Data are presented as mean ± standard deviation. Systolic blood pressure measurements presented as the mean, with an average of 10 individual readings. The control and hyperlipidic groups were compared by Student's t-tests and the hyperlipidic groups were compared with each other by ANOVA and Dunnett’s tests. * p ≤ 0.05, group H vs. control group (Student’s t-test). #p ≤ 0.05, group H+L vs. hyperlipidic group (Dunnett’s test).
Figure 4. Blood pressure levels evaluated by direct measurements in the study groups at week 20. Data are presented as mean ± standard deviation. The control and hyperlipidic groups were compared by Student's t-tests and the hyperlipidic groups were compared by ANOVA and Dunnett’s tests. * p ≤ 0.05, group H vs. control group (Student’s t-test). #p ≤ 0.05, group H+L vs.
hyperlipidic group (Dunnett’s test).
groups H and C (p≤ 0.001). Cholesterol levels did not change (67.6 ± 4.69 vs. 63.2 ± 9.2 mg/dL) (Table 2). Fasting glucose levels were not different in groups C and H; however, a significant increase in blood cose was observed in group H 120 minutes after glu-cose overdose (Table 2). Furthermore, the area under
(C) (H) (H+E) (H+L)
N = 12 N = 12 N = 12 N = 12
Daily intake (g/day) 17.0 ± 2.4 13.1 ± 2.3* 13.0 ± 2.2 13.4 ± 2.2
Energy intake (kcal/day) 63.1 ± 8.9 68.3 ± 12.1 67.6 ± 11.3 69.8 ± 11.6
Retroperitoneal fat (g) 5.4 ± 1.8 14.9 ± 3.8* 11.0 ± 2.3# 14.4 ± 4.2
Epididymal fat (g) 2.5 ± 0.6 6.6 ± 1.4* 5.4 ± 1.0 6.9 ± 1.9
Data are presented as mean ± standard deviation. Daily and energy intake are presented as average weekly evaluations from the first week of the experiment. Epididymal and retroperitoneal fat were weighed at the time of euthanasia by the end of the study. The control and hyperlipidic groups were compared by Student's t-tests and the hyperlipidic groups were compared with each other using ANOVA and Dunnett’s tests. * p ≤ 0.05 vs. control group (Student’s t-test). #p ≤ 0.05 vs. hyperlipidic group (Dunnett’s test).
65−75% of the risk of developing essential HTN can
be directly attributed to excess body weight.32 In this population, drug treatment of HTN is in-tended to reduce cardiovascular and renal morbidity and mortality and prevent metabolic worsening.11 Some clinical and experimental evidence following RAAS blockade suggests the effective participation of this system in the pathogenesis of HTN and kidney lesions.12,15 This strategy appears promising, as stud-ies have shown attenuation of other components of MS, such as hypertriglyceridemia, after RAAS block-ade.12,18 However, the available studies do not provide
sufficient clinical evidence for the generalization of this strategy for the treatment of HTN associated with MS through the administration of RAAS block-ers. Thus, the use of experimental models constitutes an alternative approach for gaining knowledge of the efficacy of various antihypertensive treatment protocols in MS.11,20
Numerous experimental models of obesity have been described. These range from genetic models such as Zucker rats and knockout mice, to hypothalamic lesion-induced models related to growth and high-fat diet-induced models in dogs, rabbits, mice, and Sprague-Dawley rats.33
On the other hand, there are few reports of obesity induction in Wistar rats in order to study MS.23,34 In the present study, administration of a lipid-rich diet for a period of 20 weeks induced obesity, hypertri-glyceridemia, glycemic disorders, and HTN in rats; these findings are consistent with a diagnosis of MS. Despite the similar energy consumption, the differ-ence in composition of the lipid-rich diet was respon-sible for the emergence of MS.25
The importance of using experimental models that resemble the profile of MS observed in humans is unquestionable, given the scarcity of recommenda-tions for the treatment of this syndrome in humans. Currently, the therapeutic approach is based on the goal of reducing body weight and/or pharmacological
Figure 5. Glycemic profiles of both groups after glucose load. Data are presented as mean ± standard deviation. The control and hyperlipidic groups were compared by Student's t-tests
and the hyperlipidic groups were compared with each other by ANOVA and Dunnett’s tests. * p ≤ 0.05, group H vs control group (Student’s t-test).
(C) (H) (H+E) (H+L)
N = 11 N = 9 N = 11 N = 9
Total cholesterol (mg/dL) 67.6 ± 4.6 63.2 ± 9.2 73.0 ± 21.1 84.3 ± 10.2#
Triglycerides (mg/dL) 28.0 ± 4.8 53.8 ± 12.4* 59.7 ± 14.8 57.3 ± 12.8
Area under the curve (gluc. vs t) 15885 ± 1837 21449 ± 3692* 22329 ± 5597 20097 ± 2786
Glucose/fasting (mg/dL) 142.9 ± 13.3 143.5 ± 20.2 141.6 ± 23.2 137.3 ± 31.0
Gluc: glucose; t: time. Data are presented as mean ± standard deviation. The control and hyperlipidic groups were compared by Student's t-tests and the hyperlipidic groups were compared with each other by ANOVA and Dunnett’s tests. * p ≤ 0.05 vs. control group (Student’s t-test). #p ≤ 0.05 vs. hyperlipidic group (Dunnett’s test).
TABLE 3 TOTALCHOLESTEROL, TRIGLYCERIDES, AREAUNDERTHECURVE, GLUCOSE/FASTING, ANDGLUCOSE/120 MININTHE
STUDYGROUPSATWEEK 20
(C) (H) (H+E) (H+L)
N = 11 N = 9 N = 11 N = 9
Creatinine clearance (mL/min/kg) 3.2 ± 0.5 3.0 ± 0.3 3.5 ± 1.0 3.2 ± 1.2
N = 6 N = 6 N = 6 N = 6
Area of glomerulus (×102 µm2) 63 ± 9 59 ± 5 63 ± 11 66 ± 5
Glomerular volume (×104 µm3) 64 ± 13 58 ± 13 64 ± 16 68 ± 8
Data are presented as mean ± standard deviation. The control and hyperlipidic groups were compared by Student's t-tests and the hyperlipidic groups were compared with each other by ANOVA and Dunnett’s tests.
treatment of comorbidities comprising the syndrome. Specifically with regard to obesity-related HTN, de-spite the relative knowledge of its causal mechanisms, the optimal treatment is not yet established and there are no specific guidelines for the HTN treatment in this population. In general, drugs that do not interfere with the metabolic profile and encompass pathophys-iological mechanisms such as sympathetic overactiv-ity, sodium retention, and RAAS blockade have been recommended.11,35
In the present study, administration of a high-fat and normosodic diet to Wistar rats was associated with the development of HTN (Figure 3). In these animals, treatment with losartan prevented HTN de-velopment, a finding indicative of the importance of the RAAS in the pathogenesis of HTN in obese rats. These data are consistent with the literature and con-firm the importance of this system in the pathogenesis and progression of HTN.36
On the other hand, mineralocorticoid antagonist treatment did not prevent the increase of blood pres-sure associated with MS in this study. This finding is in disagreement with a previous study by our group in obese dogs, in which we demonstrated the impor-tance of aldosterone in the pathogenesis of obesity-related HTN.15 In humans with MS, administration of spironolactone monotherapy significantly reduced blood pressure, suggesting the clinical importance of this hormone system in HTN in this context. Besides a reduction in blood pressure, this treatment led to improvement in glucose and lipid profiles, which is a clinically relevant finding given the characteristics of the subjects assessed.18
The discrepancy between the present study and data from previous studies by our group could be at-tributed to differences between species, diets, or the period of obesity exposure of the animals. Another aspect that could have interfered with this disso-ciation is the dose of spironolactone used, which eventually could have been low. However, this pos-sibility does not seem likely, since in a previous study we observed a significant reduction in blood pressure in MS subjects treated with only 25-50 mg of spironolactone. In this study, the hypotensive action has been attributed to possible non-genetic effects.18 This finding is similar to that observed in the RALES study, which showed that treatment with spironolactone at a low dose (25 mg/day) was associated with a decrease in hospitalization and
mortality and improvement in symptoms of serious heart failure patients.37
Furthermore, recent studies suggest that aldoste-rone induces vascular injury and HTN only in the presence of increased sodium intake. Sodium acts synergistically in the activation of the mineralocor-ticoid receptor (MR) by aldosterone by increasing the expression of cytokines and proinflammatory mediators, with cyclooxygenase-2, monocyte che-moattractant protein-1, and osteopontin being re-sponsible for the development of microalbuminuria, vasculopathy, and HTN.17 Rocha et al. showed that MR activation by coadministration of aldosterone and sodium exacerbated the severity of coronary le-sions and HTN in Sprague-Dawley rats; however, in the absence of one of the agonists or presence of a mineralocorticoid antagonist, lower vasculotoxic and hypertensive actions were observed.16 Since the diet used in this study was normosodic, this fact could explain the lack of a spironolactone-mediated hypotensive effect, and thus the discrepancy between our data and those from other studies in which MR blockade with eplerenone dramatically improved HTN and proteinuria and reversed podocyte dam-age in SHR rats fed with high-sodium diets.17 The clinical offset to this observation is demonstrated in Yanomami Indian populations, where high plasma concentrations of aldosterone are unable to raise the blood pressure of these individuals due to a low di-etary sodium intake.38
In the present study, administration of losar-tan or spironolactone did not significantly alter the metabolic and glycidic profiles of the animals. Moreover, the spironolactone-treated group showed a significant 25% reduction in RET fat. Similar ef-fects have been described in C57BL/6 mice with MS.39 In that study, obese mice treated with spirono-lactone showed a significant reduction of EP fat. This finding has been attributed to the inhibition of clonal expansion, differentiation, and accumulation of triglycerides in the adipocytes and by decreased expression of the peroxisome proliferator-activated receptor- due to MR blockade.20,39
increased GV.15,40 Although it has been evaluated pre-viously, proteinuria was not included in the present study due to technical and interpretation difficulties, which made it impossible to use the results. However, it is worth speculating that no observable glomerular histological changes might have been secondary to the short period of obesity exposure of the animals and only slightly elevated blood pressure levels. This pos-sibility seems likely considering that the renal dam-age from obesity in Wistar rats occurs only in senile animals.40 Another important consideration is that we cannot dismiss entirely a more incipient nephropathy, since we did not evaluate indicators of injury at an earlier stage, such as the expression of inflammatory mediators, growth factors, and protein markers of epithelial-mesenchymal transition.
In conclusion, RAAS blockade in Wistar rats with MS was shown to be an effective measure for reduc-ing blood pressure when inhibition of the angiotensin II receptor occurs. However, the same hypotensive ef-fect was not observed following MR blockade, which inhibited adipogenic activity and prevented the accu-mulation of abdominal fat.
R
EFERENCES1. Ogden CL, Carroll MD, Curtin LR, McDowell MA, Tabak CJ, Flegal KM. Prevalence of overweight and obesity in the United States, 1999-2004. JAMA 2006;295:1549-55.
2. World Health Organization. Obesity and overweight: what are overweight and obesity? Report of a WHO Consultation. Ge-neva; 2006. WHO Technical Report.
3. Klimcakova E, Kovacikova M, Stich V, Langin D. Adipoki-nes and dietary interventions in human obesity. Obes Rev 2010;11:446-56.
4. Hall JE. Pathophysiology of obesity hypertension. Curr Hyper-tens Rep 2000;2:139-47.
5. Vlasova M, Purhonen AK, Jarvelin MR, Rodilla E, Pascual J, Herzig KH. Role of adipokines in obesity-associated hyperten-sion. Acta Physiol (Oxf) 2010;200:107-27.
6. Simmons RK, Alberti KG, GaleEA, Colagiuri S, Tuomilehto J, Qiao Q, et al. The metabolic syndrome: useful concept or clini-cal tool? Report of a WHO Expert Consultation. Diabetologia 2010;53:600-5.
7. Alexander CM, Landsman PB, Teutsch SM, Haffner SM; Third National Health and Nutrition Examination Survey (NHANES III); National Cholesterol EducationProgram (NCEP). NCEP-defined metabolic syndrome, diabetes, and the prevalence of coronary heart disease among NHANES III participants age 50 years and older. Diabetes Care 2003;52:1210-4.
8. Isomaa B, Almgren P, Tuomi T, Forsén B, Lahti K, Nissén M, et al. Cardiovascular morbidity and mortality associated with the metabolic syndrome. Diabetes Care 2001;24:683-9.
9. Grundy M, Brewer Jr. HB, Cleeman JI, Smith SC Jr, Lenfant C; AmericanHeart Association; NationalHeart, Lung, and Blood Institute. Definition of metabolic syndrome: Report of the National Heart, Lung, and Blood Institute/American Heart Association conference on scientific issues related to definition. Circulation 2004;109:433-8.
10. Ezequiel DGA, Costa MB, Chaoubah A, de Paula RB. Efeito da perda de peso sobre a hemodinâmica renal em portadores da síndrome metabólica. J Bras Nefrol 2012;34:36-42.
11. I Diretriz Brasileira de Diagnóstico e Tratamento da Síndrome Metabólica. Arq Bras Cardiol 2005;84:1-28.
12. The ALLHAT Officers and Coordinators for the ALLHAT Collaborative Research Group. The Antihypertensive and Li-pid-Lowering Treatment to Prevent Heart Attack Trial. Major outcomes in high-risk hypertensive patients to angiotensin-con-verting enzyme inhibitor or calcium channel blocker vs. diure-tic. The Antihypertensive and Lipid-Lowering Treatment to Pre-vent Heart Attack Trial (ALLHAT). JAMA 2002;228:2981-97. 13. Williams SA, Michelson EL, Cain VA, Yang M, Nesbitt SD,
Egan BM, et al; Trophy Study Investigators. An evaluation of the effects of an angiotensin receptor blocker on health-rela-ted quality of life in patients with high-normal blood pressu-re (ppressu-rehypertension) in the Trial of Ppressu-reventing Hypertension (TROPHY). J Clin Hypertens (Greenwich) 2008;10:436-42. 14. Lubsen J, Wagener G, Kirwan BA, de Brouwer S, Poole-Wilson
PA; ACTION (A Coronary disease Trial Investigating Outco-me with Nifedipine GITS) investigators. Effect of long-acting nifedipine on mortality and cardiovascular morbidity in pa-tients with symptomatic stable angina and hypertension: the ACTION trial. J Hypertens 2005;23:641-8.
15. De Paula RB, da Silva AA, Hall JE. Aldosterone antagonism attenuates obesity-induced hypertension and glomerular hyper-filtration. Hypertension 2004;43:41-7.
16. Rocha R, Martin-Berger CL, Yang P, Scherrer R, Delyani J, Mc-Mahon E. Selective aldosterone blockade prevents angiotensin II/salt-induced vascular inflammation in the rat heart. Endocri-nology 2002;143:4828-36.
17. Fujita T. Mineralocorticoid receptors, salt-sensitive hyperten-sion, and metabolic syndrome. Hypertension 2010;55:813-8. 18. Costa MB, Andrade Ezequiel DG, Morais Lovis JC, Oliveira
MM, Baumgratz de Paula R. Aldosterone antagonist decrea-ses blood pressure and improves metabolic parameters in obese patients with the metabolic syndrome. J Clin Hypertens (Greenwich) 2010;12:753-5.
19. de Kloet AD, Krause EG, Woods SC. The renin angiotensin system and the metabolic syndrome. Physiol Behav 2010;100:525-34. 20. Caprio M, Antelmi A, Chetrite G, Muscat A, Mammi C,
Marzolla V, et al. Antiadipogenic effects of the mineralocor-ticoid receptor antagonist drospirenone: potential implica-tions for the treatment of metabolic syndrome. Endocrinology 2011;152:113-25.
21. Dobrian AD, Davies MJ, Prewitt RL, Lauterio TJ. Develop-ment of hypertension in a rat model of diet-induced obesity. Hypertension 2000;35:1009-15.
22. Akiyama T, Tachibana I, Shirohara H, Watanabe N, Otsuki M. High-fat hypercaloric diet induces obesity, glucose intolerance and hyperlipidemia in normal adult male Wistar rat. Diabetes Res Clin Pract 1996;31:27-35.
23. Shen C, Zhu Z, Yan Z, Ni Y. P-513: High fat plus high salt diet induced metabolic syndrome in wistar rat. Am J Hypertens 2004;17:220A.
24. Nascimento AF, Sugizaki MM, Leopoldo AS, Lima-Leopoldo AP, Nogueira CR, Novelli EL, et al. Misclassification probabi-lity as obese or lean in hypercaloric and normocaloric diet. Biol Res 2008;41:253-9.
25. Dourmashkin JT, Chang GQ, Gayles EC, Hill JO, Fried SK, Julien C, et al. Different forms of obesity as a function of diet composition. Int J Obes (Lond) 2005;29:1368-78.
26. Machado H, Guerra MO, Peters V. Implantação e padroniza-ção da técnica de aferipadroniza-ção indireta da pressão arterial em ratos Wistar da colônia do biotério do Centro de Biologia da Repro-dução (CBR). RIEE 2010;2:60-1.
28. Marchionne EM, Diamond-Stanic MK, Prasonnarong M, Hen-riksen EJ. Chronic renin inhibition with aliskiren improves glu-cose tolerance, insulin sensitivity, and skeletal muscle gluglu-cose transport activity in obese Zucker rats. Am J Physiol Regul In-tegr Comp Physiol 2012;302:R137-42.
29. Yamabe N, Kang KS, Goto E, Tanaka T, Yokozawa T. Be-neficial effect of Corni Fructus, a constituent of Hachimi-jio--gan, on advanced glycation end-product-mediated renal in-jury in Streptozotocin-treated diabetic rats. Biol Pharm Bull 2007;30:520-6.
30. Zheng S, Noonan WT, Metreveli NS, Coventry S, Kralik PM, Carlson EC, et al. Development of late-stage diabetic nephro-pathy in OVE26 diabetic mice. Diabetes 2004;53:3248-57. 31. Brasil. Vigitel Brasil 2010: vigilância de fatores de risco e
pro-teção para doenças crônicas por inquérito telefônico/Ministério da Saúde, Secretaria de Vigilância em Saúde, Secretaria de Ges-tão Estratégica e Participativa. - Brasília: Ministério da Saúde, 2011.152p.
32. Garrison RJ, Kannel WB, Stokes J 3rd, Castelli WP. Incidence and precursors of hypertension in young adults: the Framin-gham Offspring Study. Prev Med 1987;16:235-51.
33. Panchal SK, Brown L. Rodent models for metabolic syndrome research. J Biomed Biotechnol 2011;2011:351982.
34. Ferreira LBD, Cesaretti MLR, Voltera AF, Ginoza M, Kohl-mann Junior O. Effects of the overlapping between an expe-rimental model of neuroendocrine obesity with arterial hyper-tension under blood pressure, body weight and metabolic and renal parameters in rats. J Bras Nefrol 2011;33:338-44. 35. Sociedade Brasileira de Cardiologia. VI Diretrizes Brasileiras de
Hipertensão. Arq Bras Cardiol 2010;95:1-51.
36. Hall JE. The kidney, hypertension, and obesity. Hypertension 2003;41:625-33.
37. Pitt B, Zannad F, Remme JW, Cody R, Castaigne A, Perez A, et al. The effect of spironolactone on morbidity and mortality in patients with severe heart failure. Randomized Aldactone Eva-luation Study Investigators. N Engl J Med 1999;341:709-17. 38. Mancilha-Carvalho JJ, Souza e Silva NA. The Yanomami Indians
in the INTERSALT Study. Arq Bras Cardiol 2003;80:295-300. 39. Marzolla V, Armani A, Zennaro MC, Cinti F, Mammi C,
Fabbri A, et al. The role of the mineralocorticoid receptor in adipocyte biology and fat metabolism. Mol Cel Endocrinol 2012;350:281-8.