ABSTRACT: Seed vigor has traditionally been evaluated by physiological, biochemical and stress tolerance tests. More recently, with the use of computerized image analysis, objective informa-tion has become accessible in a relatively short period of time, with less human interference. The aim of this study was to verify the efficiency of computerized seedling image analysis by Seed Vigor Imaging System (SVIS®) to detect differences in vigor between carrot (Daucus carota L.) seed lots as compared to those provided by traditional vigor tests. Seeds from seven lots from the Brasilia cultivar were subjected to a germination test, first count of germination, speed of germination, accelerated aging with saline solution and seedling emergence; furthermore, a vig-or index, growth index and unifvig-ormity index were determined by the Seed Vigvig-or Imaging System (SVIS®) during four evaluation periods. The results obtained by the computerized seedling analy-sis (vigor index and growth index) show that SVIS® is efficient in assessing carrot seed vigor. Keywords: Daucus carota L., Daucus carota subsp. Sativus, quality control, physiological poten-tial, seed analysis
Use of the software
Seed Vigor Imaging System
(SVIS
®) for assessing vigor of carrot
José Luís de Marchi1*, Silvio Moure Cicero1
1University of São Paulo/ESALQ − Crop Production Dept., Av. Pádua Dias, 11 − 13419-900 − Piracicaba, SP − Brazil. *Corresponding author <[email protected]>
Edited by: Paulo Cesar Sentelhas
Received June 02, 2016 Accepted November 28, 2016
Introduction
Carrot seed quality depends on the growth stage and the general condition of the plant. The vegetative and flowering periods for carrot plants are usually very long. This leads to the formation of seeds with different levels of quality, leading to difficulties in standard estab-lishment and growth, contributing to excessive use of seeds, which raises production costs. Therefore, fast and accurate procedures for the assessment of seed quality are needed.
Seed vigor can be evaluated by the physiological, biochemical and stress tolerance tests which are com-monly used for carrot and other species (Pereira et al., 2008; Chiquito et al., 2012; Kikuti and Marcos Filho, 2013). Computerized image analysis of seedlings has been used for seed vigor evaluation in several species; these are non-destructive methods and can provide ob-jective information in a short period of time with less human interference (McCormac et al., 1990; Marcos Filho et al., 2006).
The feasibility of using computerized image anal-ysis was first demonstrated by McCormac et al. (1990) who determined the average length of the primary roots of tomato, lettuce and cauliflower seedlings. Simi-larly, in researches conducted by Geneve and Kester (2001) on cauliflower, tomato and impatiens seeds, and Tohidloo and Kruse (2009) on radish seeds using seed-lings imaging analysis systems, were able to determine correlations between seedling growth and seedling emergence.
In this context, Sako et al. (2001) developed an au-tomated system for assessing the vigor of lettuce seeds called the Seed Vigor Imaging Sistem (SVIS®). The pro-cess involves scanning the seedlings and then generating vigor, growth and uniformity indexes. Further studies
were conducted using this technique and successfully evaluated seed vigor, for crops such as soybean seeds (Hoffmaster et al., 2003), corn (Hoffmaster et al., 2005), melon (Marcos-Filho et al., 2006), peanut (Marchi et al., 2011), cucumber (Chiquito et al., 2012) and okra (Kikuti and Marcos Filho, 2013).
The aim of this study was to verify the possibility of using the computerized system of seedling analysis (SVIS®) to detect differences in vigor between lots of
car-rot seeds when compared to the information provided by traditionally used vigor tests.
Materials and Methods
The study was carried out in Piracicaba, in the state of São Paulo, Brazil (22°46’24” S, 47°36’33” W, 582 m above sea level). The experiment was conducted on carrot seeds (Daucus carota L. ‘Brasilia’) provided by a seed company, produced and harvested under the same environmental conditions in the region of Bage, in the state of Rio Grande do Sul. During processing, the seed company separated the seeds into 7 lots presenting dif-ferences in physical purity and germination (Table 1). They were examined over 4 evaluation periods, with 3 months separating the 1st, 2nd, and 3rd periods, and
6 months between the 3rd and 4th periods. Seeds were
packed into polyethylene bags and stored under con-trolled ambient conditions (30 % U.R. and 10 °C). The seeds were subjected to the following tests.
Seed moisture content
Determined at 105 ± 3 °C for 24 h in duplicate samples of intact seeds as recommended by the Rules for Seed Analysis (MAPA, 2009). The results were expressed in terms of percentage water content (fresh weight ba-sis).
Germination test
Four replications of 50 seeds for each lot were dis-tributed in plastic boxes on filter paper moistened with distilled water at a ratio of 2.5 times the paper’s dry mass, and maintained at a constant temperature of 20 °C.Evaluations were made at 7 and 14 days after sow-ing, according to the criteria established by the Rules for Seed Analysis for this species (MAPA, 2009). The results were expressed in terms of percent ofnormal seedlings for each lot.
Germination first count
The counts were performed simultaneously with the germination test and the percent of normal seedlings were evaluated 7 days after sowing.
Germination speed
The germination speed index was determined alongside the standard germination test (MAPA, 2009); evaluations of normal seedlings were performed daily until 14 days after sowing. Only seeds that produced a normal seedling were counted as germinated. The ger-mination speed index was calculated according to the formula proposed by Maguire (1962).
Accelerated aging
Following the methodology described by Marcos Filho (2006), a single layer of seeds was distributed on wire mesh attached to plastic boxes (11 × 11 × 3 cm) filled with 40 mL saturated NaCl solution and kept at 41 °C in a chamber. After treatment, 4 replicates of 50 seeds were used to test for germination as described.
Seedling emergence in the greenhouse
Four replicates of 50 seeds per lot were distributed in multi-cell styrofoam trays containing Plantmax HT substrate. The trays were kept in a greenhouse equipped with an intermittent fogging system. The number of normal seedlings was evaluated daily, at the same hour (10h00), between the 1st and 14th day after sowing to
es-tablish the emergence speed index, which, in addition to the germination speed index, was calculated according to the formula proposed by Maguire (1962).
Seedling vigor imaging system (SVIS®)
Four replicates of 50 seeds per lot were processed as follows: two rows of 25 seeds each were distributed in plastic boxes (15 × 23 × 4 cm) on two blue blotter papers moistened with distilled water at a ratio of 2.8 times the paper’s dry mass (this ratio was specifically ad-justed for this research by previous tests) and inserted in a germination chamber at 20 ± 1 °C at an inclination of 25 degrees in relation to the base of the chamber, in the absence of light, in order that the seedlings grew parallel to the blotter. Seedlings were scanned 6 days after sow-ing. The images were captured by a scanner operated by Photosmart software with a resolution of 100 dpi. The captured images were analyzed by SVIS® software. The
program generates vigor, growth of seedlings and uni-formity of development indexes, as described by Sako et al. (2001).
The vigor index values (0 to 1000) are based on the speed and uniformity of seedling development in rela-tion to the maximum possible values for 6 day old car-rot seedlings. The growth index (0 to 1000) is calculated by the software based on the length of the hypocotyl - radicle axis. The uniformity index values (0 to 1000) are based on deviations from the standard seedling develop-ment set in software.
The experimental design was completely random-ized, and the means compared by the Scott-Knott test at 5 % probability. Subsequently Pearson correlation coeffi-cients (r) between the results from the SVIS® test and the
results from the other vigor tests were calculated. The significance of the r values was verified by the t test at 5 % and 1 % probability.
Results
The moisture content of the seeds varied between lots and times of analysis, from 6.1 % to 7.0 % (Table 2). This small variation in moisture content is an important fact to be taken into consideration in the evaluation of physiological potential, since variations greater than 1 % between samples may affect the vigor test results (Mar-cos Filho, 2006; Tekrony, 2003).
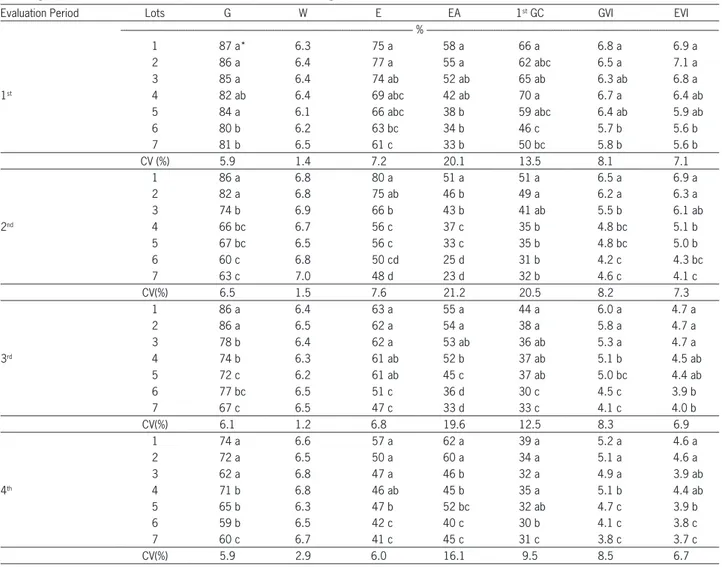
Table 2 presents results obtained from traditional vigor tests. The germination test showed differences be-tween lots in all the evaluation periods, wherein lots 1 and 2 showed the highest percentage germination as op-posed to lots 6 and 7 showing the lowest. Furthermore, the vigor tests done in the 1st period indicated lots 1 and
2 as having higher vigor than lots 6 and 7. The other lots were rated as intermediate in physiological quality. This classification could not be verified in the 2nd
pe-riod of evaluation, except for the accelerated aging test which classified only the first lot as having the best per-formance.
In the 3rd evaluation period, the vigor tests showed
that lots 1, 2 and 3 returned a higher performance than the others, and that lots 6 and 7 again showed a lower performance.
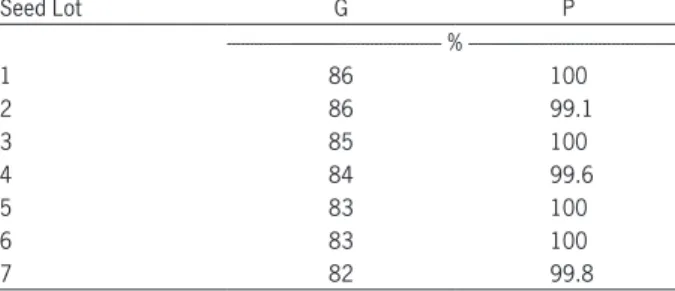
Table 1 − Lots from carrot seeds (Daucus carota L. ‘Brasilia’) used in the study and their differences in terms of germination (G) and physical purity (P) as informed by the seed company who supplied the seeds for this research.
Seed Lot G P
--- % ---
1 86 100
2 86 99.1
3 85 100
4 84 99.6
5 83 100
6 83 100
Similarly, analysis of the 4th period showed lots
1, 2 and 3 as having the highest vigor except for the accelerated aging test which indicated only lots 1 and 2 had the best performance. Moreover, lots 6 and 7 had the lowest level of vigor except for the first count of germination which found only lot 7 with the lowest vigor. The results reinforce the higher vigor of lots 1 and 2 over that of 6 and 7. Thus, lots 1 and 2 stood out from the rest and lots 6 and 7 showed an all-round lower performance. It is notable that although the germination test indicated high levels of physiologi-cal potential in the lots, the vigor tests identified lots with significant differences in performance, thereby providing important additional information regarding seed quality (Marcos Filho, 2005).
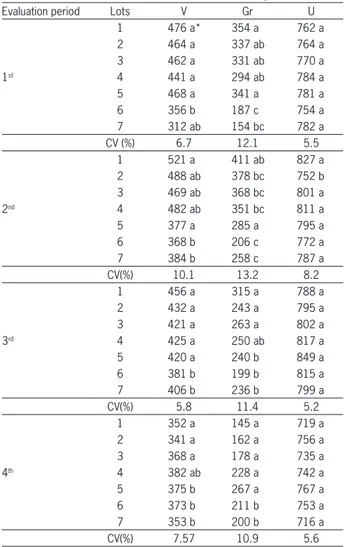
Statistical analyses for vigor index, growth and uniformity index generated by SVIS® in all evaluation
periods are summarized in Table 3. The data show that lots 6 and 7 could be classified as having lower levels of vigor and growth as compared to the others. Lots 1 and 2 ranked among those with higher levels of vigor and growth across all 4 evaluation periods. Statistical analysis of the uniformity index data did not depict any significant results in any of the four evaluation periods.
Table 4 presents correlation analysis between the traditionally used tests (Table 2) against the re-sults from the imaging analysis test (Table 3). The data shows that the vigor tests presented positive correla-tion coefficients (p < 0.01 and 0.01 ≤ p < 0.05) with the variables’ vigor index and growth index and non-significant correlation coefficients (p ≥ 0.05) with the variable uniformity index across all 4 evaluation pe-riods.
Table 2 − Total germination (G), seed water content (W), seedling emergence (E), accelerated ageing with saturated salt solution (EA), first count of germination (1st GC), germination velocity index (GVI), emergence velocity index (EVI) of seven lots of carrot seeds, cv. Brasília, obtained in the first evaluation period (before storage), in the 2nd evaluation period (after 3 months storage), in the 3rd evaluation period (after 6 months storage) and in the 4th evaluation period (after 12 months storage).
Evaluation Period Lots G W E EA 1st GC GVI EVI
%
---1 87 a* 6.3 75 a 58 a 66 a 6.8 a 6.9 a
2 86 a 6.4 77 a 55 a 62 abc 6.5 a 7.1 a
3 85 a 6.4 74 ab 52 ab 65 ab 6.3 ab 6.8 a
1st 4 82 ab 6.4 69 abc 42 ab 70 a 6.7 a 6.4 ab
5 84 a 6.1 66 abc 38 b 59 abc 6.4 ab 5.9 ab
6 80 b 6.2 63 bc 34 b 46 c 5.7 b 5.6 b
7 81 b 6.5 61 c 33 b 50 bc 5.8 b 5.6 b
CV (%) 5.9 1.4 7.2 20.1 13.5 8.1 7.1
1 86 a 6.8 80 a 51 a 51 a 6.5 a 6.9 a
2 82 a 6.8 75 ab 46 b 49 a 6.2 a 6.3 a
3 74 b 6.9 66 b 43 b 41 ab 5.5 b 6.1 ab
2nd 4 66 bc 6.7 56 c 37 c 35 b 4.8 bc 5.1 b
5 67 bc 6.5 56 c 33 c 35 b 4.8 bc 5.0 b
6 60 c 6.8 50 cd 25 d 31 b 4.2 c 4.3 bc
7 63 c 7.0 48 d 23 d 32 b 4.6 c 4.1 c
CV(%) 6.5 1.5 7.6 21.2 20.5 8.2 7.3
1 86 a 6.4 63 a 55 a 44 a 6.0 a 4.7 a
2 86 a 6.5 62 a 54 a 38 a 5.8 a 4.7 a
3 78 b 6.4 62 a 53 ab 36 ab 5.3 a 4.7 a
3rd 4 74 b 6.3 61 ab 52 b 37 ab 5.1 b 4.5 ab
5 72 c 6.2 61 ab 45 c 37 ab 5.0 bc 4.4 ab
6 77 bc 6.5 51 c 36 d 30 c 4.5 c 3.9 b
7 67 c 6.5 47 c 33 d 33 c 4.1 c 4.0 b
CV(%) 6.1 1.2 6.8 19.6 12.5 8.3 6.9
1 74 a 6.6 57 a 62 a 39 a 5.2 a 4.6 a
2 72 a 6.5 50 a 60 a 34 a 5.1 a 4.6 a
3 62 a 6.8 47 a 46 b 32 a 4.9 a 3.9 ab
4th 4 71 b 6.8 46 ab 45 b 35 a 5.1 b 4.4 ab
5 65 b 6.3 47 b 52 bc 32 ab 4.7 c 3.9 b
6 59 b 6.5 42 c 40 c 30 b 4.1 c 3.8 c
7 60 c 6.7 41 c 45 c 31 c 3.8 c 3.7 c
CV(%) 5.9 2.9 6.0 16.1 9.5 8.5 6.7
Discussion
Seedling image analysis permitted the identifica-tion of physiological differences between seed lots in all evaluation periods. However, the vigor index and seedling growth index enabled the separation of lots at 3 levels of vigor, as did the traditional vigor tests, identifying lots 1 and 2 as having the highest performance, lots 6 and 7 with the lowest, and the remaining lots as having intermedi-ate vigor between these levels. Using SVIS®, similar results
were obtained with seeds of other species, which present-ed an association between lots showing different vigor lev-els and the traditional vigor tests such as lettuce (Sako et al., 2001), corn (Otoni and McDonald, 2005), melon (Mar-cos Filho et al., 2006) and bean (Gomes Júnior et al., 2014).
In addition, the data from the correlation analysis (Table 4) shows that the vigor index and the growth in-dex can be successfully used to access carrot seed vigor. Germination, germination velocity index, first count of germination, seedling emergence, emergence velocity index and accelerated ageing with saturated salt solu-tion (EA) presented significant coefficients (p < 0.01 and 0.01 ≤ p < 0.05) with the variables vigor index and the growth index, generated by the SVIS® software, across all
4 evaluation periods, with few exceptions.
However, uniformity of seedling development did not differ between seed lots for all evaluation periods (Table 3). Similar behavior was observed by Kikuti and Marcos Filho (2013) and Marcos Filho et al., 2006 study-ing okra seeds and soybean seeds, respectively.
Accord-Table 3 − Vigor index (V), growth (Gr) and uniformity (U) of carrot seedlings obtained by software SVIS® analysis of seven lots of carrot seeds, cv. Brasília, obtained in the 1st evaluation period (before storage), in the 2nd evaluation period (after 3 months storage), in the 3rd evaluation period (after 6 months storage) and in the 4th evaluation period (after 12 months storage).
Evaluation period Lots V Gr U
1 476 a* 354 a 762 a
2 464 a 337 ab 764 a
3 462 a 331 ab 770 a
1st 4 441 a 294 ab 784 a
5 468 a 341 a 781 a
6 356 b 187 c 754 a
7 312 ab 154 bc 782 a
CV (%) 6.7 12.1 5.5
1 521 a 411 ab 827 a
2 488 ab 378 bc 752 b
3 469 ab 368 bc 801 a
2nd 4 482 ab 351 bc 811 a
5 377 a 285 a 795 a
6 368 b 206 c 772 a
7 384 b 258 c 787 a
CV(%) 10.1 13.2 8.2
1 456 a 315 a 788 a
2 432 a 243 a 795 a
3 421 a 263 a 802 a
3rd 4 425 a 250 ab 817 a
5 420 a 240 b 849 a
6 381 b 199 b 815 a
7 406 b 236 b 799 a
CV(%) 5.8 11.4 5.2
1 352 a 145 a 719 a
2 341 a 162 a 756 a
3 368 a 178 a 735 a
4th 4 382 ab 228 a 742 a
5 375 b 267 a 767 a
6 373 b 211 b 753 a
7 353 b 200 b 716 a
CV(%) 7.57 10.9 5.6
*Different letters indicate a statistically significant difference (p < 0.05) by Tukey’s test.
Table 4 − Correlation coefficients (r) between the averages of the results from total germination (G), seedling emergence (E), accelerated ageing with saturated salt solution (EA), 1st count of germination (1st GC), germination velocity index (GVI), emergence velocity index (EVI) and vigor index (V), growth (Gr) and uniformity (U) of carrot seedlings obtained by software SVIS® analysis of seven lots of carrot seeds, cv. Brasília, obtained in the 1st evaluation period (before storage), on the 2nd evaluation period (after 3 months storage), in the 3rd evaluation period (after 6 months storage) and in the 4th evaluation period (after 12 months storage).
Evaluation period Variables V Gr U
G 0.9583* 0.8681* 0.4827 NS E 0.8652* 0.8725* -0.5209 NS
1st EA 0.7824 0.9899** -0.6932 NS
1st GC 0.9053* 0.9490** -0.7627 NS GVI -0.8314NS 0.9323* -0.6015 NS EVI -0.7981 NS 0.9009* -0.7194 NS
V G U
G 0.9645* 0.9490* 0.4618 NS E 0.8665* 0.8798* 0.7948 NS
2nd EA 0.9040* 0.9770 * 0.7287 NS
1st GC 0.8665* 0.8948 * 0.8184 NS GVI 0.8532* 0.9289* -0.6006 NS EVI 0.9333* 0.9218* 0.7407 NS
V G U
G 0.8850* 0.9048* 0.6555 NS E 0.8108 NS 0.9827* 0.8280 NS
3rd EA 0.8658* 0.9899* -0.7702 NS
1st GC 0.8667* 0.8575* -0.6555 NS GVI 0.6610 NS 0.9141* 0.7774 NS EVI 0.7756 NS 0.9284* 0.7152 NS
V G U
G 1,0000** 0.9999** -0.8289 NS E 0.9562* 0.9497* 0.7756 NS
4th EA 0.9880** 0.8101 NS 0.6146 NS
Gomes Júnior, F.G.; Chamma, H.M.C.P.; Cicero, S.M. 2014. Automated image analysis of seedlings for vigor evaluation of common bean seeds. Acta Scientiarum 36: 195-200.
Hoffmaster, A.L.; Fujimura, K.; McDonald, M.B.; Bennett, M.A. 2003. An automated system for vigour testing three-day-old soybean seedlings. Seed Science and Technology 31: 701-713. Hoffmaster, A.L.; Fujimura, K.; McDonald, M.B.; Bennett,
M.A.; Evans, A.F. 2005. The Ohio State University Seed Vigor Imaging System (SVIS) for soybean and corn seedlings. Seed Technology 27: 7-24.
Kikuti, A.L.P.; Marcos Filho, J. 2013. Seedling imaging analysis and traditional tests to assess okra seed vigor. Journal of Seed Science 35: 443-448.
Maguire, J.D. 1962. Speed of germination-aid in selection and evaluation for seedling emergence and vigor. Crop Science 2: 176-177.
Marchi, J.L.; Cicero, S.M.; Gomes Junior, F.G. 2011. Using computerized analysis of seedlings to evaluate the physiological potential of peanut seeds treated with fungicide and insecticide. Revista Brasileira de Sementes 33: 652-662 (in Portuguese, with abstract in English).
Marcos Filho, J.; Bennett, M.A.; McDonald, M.B.; Evans, A.F.; Grassbaugh, E.M. 2006. Assessment of melon seed vigour by an automated computer imaging system compared to traditional procedures. Seed Science and Technology 34: 485-497. Marcos Filho, J. 2005. Cultivated Plants Seed Physiology =
Fisiologia de Sementes de Plantas Cultivadas. FEALQ, Piracicaba, SP, Brazil (in Portuguese).
McCormac, A.C.; Keefe, P.D.; Draper, S.R. 1990. Automated vigor testing of field vegetables using image analysis. Seed Science and Technology 18: 103-112.
Ministério da Agricultura, Pecuária e Abastecimento [MAPA]. 2009. Rules for Seed Analysis = Regras para Análise de Sementes. Secretaria de Defesa Agropecuária, Brasília, DF, Brazil (in Portuguese).
Pereira, R.S.; Nascimento, W.N.; Vieira, J.V. 2008. Carrot seed germination and vigor in response to temperature and umbel orders. Scientia Agricola 65: 145-150.
Sako, Y.; McDonald, M.B.; Fujimura, K.; Evans, A.F.; Bennett, M.A. 2001. A system for automated seed vigour assessment. Seed Science and Technology 29: 625-636.
Tohidloo, G.; Kruse, M. 2009. Development of an image analysis aided seedling growth test for winter oilseed rape and verification as a vigour test. Seed Science and Technology 37: 98-109.
ing to the authors, this behavior was due to uniform germination of the seeds which is related to the high vigor of the same. The variable uniformity index (Table 4) shows non-significant coefficients with the other vigor tests (p≥ 0.05) throughout all 4 evaluation periods. This can be attributed to similarity in physiological potential of seed lots assessed in the present research work.
Other authors have successfully verified signifi-cant coefficients between computerized image analysis results and those obtained by traditional vigor tests for various species such as melon (Marcos Filho et al., 2006) soybean (Marcos Filho et al., 2006), peanut (Marchi et al., 2011) and bean (Gomes Júnior et al., 2009). How-ever, significant correlation values were not observed for rapeseed (Tohildloo and Kruse, 2009) nor sunflower seeds (Caldeira et al., 2014).
Thus, with the results obtained in this research, it was possible to conclude that data obtained with the SVIS® software (vigor index and growth index), provided
similar results to the recommended vigor tests, provid-ing sensitivity in the evaluation of carrot seed vigor in a shorter period of time and with less human interference.
Conclusions
Computerized image analysis of seedlings using the software SVIS® was effective in determining the vigor
of carrot seeds and has a level of sensitivity comparable to traditional vigor tests.
Acknowledgments
To São Paulo State Foundation for Research Sup-port (FAPESP) for the founding and resources to conduct the research.
References
Caldeira, C.M.; Carvalho, M.L.M.; Oliveira, J.A.; Coelho, S.V.B.; Kataoka, V.Y. 2014. Sunflower seed vigor determined by computerized seedling analysis. Científica 42: 346-353 (in Portuguese, with abstract in English).
Chiquito, A.A.; Gomes Júnior, F.G.; Marcos Filho, J. 2012. Assessment of physiological potential of cucumber seeds using the software seedling vigor imaging system (SVIS). Revista Brasileira de Sementes34: 255-263.