Spatial and temporal heterogeneity in a subtropical reservoir and
their effects over the benthic macroinvertebrate community
Heterogeneidade espacial e temporal de reservatório subtropical e seus efeitos sobre a
comunidade de macroinvertebrados bentônicos
Frederico Guilherme de Souza Beghelli1,2, André Cordeiro Alves dos Santos1, Maria Virgínia Urso-Guimarães1 and Maria do Carmo Calijuri3
1Departamento de Biologia, Universidade Federal de São Carlos – UFSCar, Campus Sorocaba, Rod. João Leme dos Santos, Km 110, CEP 18052-780, Sorocaba, SP, Brazil
e-mail: [email protected]; [email protected]; [email protected]
2Laboratório de Limnologia, Universidade Estadual Paulista “Júlio de Mesquita Filho” – UNESP, Campus Sorocaba, Av. Três de Março, 511, Alto da Boa Vista, CEP 18087-180, Sorocaba, SP, Brazil
3Departamento de Hidráulica e Saneamento, Escola de Engenharia de São Carlos, Universidade de São Paulo – USP, Av. Trabalhador São Carlense, 400, CEP 13566-590, São Carlos, SP, Brazil
e-mail: [email protected]
Abstract:Aim: The objective of the present study was to demonstrate the influences
of the environment spatial heterogeneity on benthic macroinvertebrates considering transverse and longitudinal gradients as also seasonality. Methods: Four samplings were performed: two in the wet and two in the dry season in the riverine, transitional and lacustrine zones in the littoral and profundal regions of Itupararanga reservoir, SP, Brazil. Abiotic characterization of the water and of the sediment was performed. The biotic characterization was based on richness, dominance, diversity, and density of organisms, as well as on the relative abundance of predominant taxa. Two-way ANOSIM analyses were performed for both biotic and abiotic components, in order to test the significance of the differences in the longitudinal and transverse directions as well as of the differences between seasons. Results: Compartmentalization was present in both directions, longitudinal and transverse. In a general way, the littoral region presented higher diversity values when compared with the profundal region, and the riverine zone presented high densities and high percentage of taxons, which usually indicate organic pollution. The differentiation between the transitional and lacustrine zones was determined mainly by taxonomic composition. Seasonality was also observed and the transportation of small particles, the entrance of nutrients, and the presence of macrophytes were considered as determinants for differentiation. Conclusions: Together, these results demonstrate the responses of benthic macroinvertebrate communities considering distinct sources of variation: longitudinal heterogeneity, determined by the increasing distance from the forming rivers that leads to a gradient of physical and chemical conditions; transverse heterogeneity, determined by the proximity with the land environment and depth differences. Seasonal heterogeneity was recorded during the period of this research and it was determined by variations in water flow, in temperature, and in the carrying of matter, nutrients and organisms.
Keywords: reservoir, diversity, neotropics, compartmentalization.
Resumo: Objetivo: O objetivo do presente estudo foi demonstrar a influência da heterogeneidade espacial sobre os macroinvertebrados bentônicos considerando-se gradientes ambientais longitudinais e transversais bem como a sazonalidade.
região litorânea apresentou valores de diversidade mais elevados quando comparados com a região profunda. Além disso, foram registrados, na zona de rio, maiores valores para densidade geral bem como proporção de táxons associados às condições de poluição orgânica. A distinção entre as zonas de transição e de lago foi determinada principalmente pela composição taxonômica. Também foram observados efeitos da sazonalidade sobre os organismos e o transporte de pequenas partículas, a entrada de nutrientes e a presença de macrófitas foram considerados determinantes. Conclusões:Em conjunto, estes resultados demonstraram respostas das comunidades de macroinvertebrados bentônicos em relação a fontes distintas de variação: heterogeneidade longitudinal, determinada pelo aumento da distância dos rios que formam, que leva a um gradiente de condições físicas e químicas; heterogeneidade transversal, determinada pela proximidade com o ambiente terrestre e as diferenças de profundidade. Além destas, foi verificada ainda a heterogeneidade sazonal no período desta pesquisa, determinada por variações no fluxo de água, na temperatura e no transporte de matéria, nutrientes e organismos.
Palavras-chave: reservatório, diversidade, região neotropical, compartimentalização.
1. Introduction
Reservoirs are artificial ecosystems that have intermediate conditions between rivers and lakes. Therefore, when a dam is built, a horizontal gradient of physical, chemical and biological conditions is created (Karmakar et al., 2011).
Since the main influxes in reservoirs come from one principal tributary located far from the dam, the longitudinal zonation can be understood as consequence of nutrient dilution, of the displacement of matter and small organisms, differential rates of sedimentation and decomposition, and turbulence. This gradient leads to the distribution of the communities into environmental compartments (Thornton et al., 1982).
Another source of variation in aquatic environments is the transversal heterogeneity. Several authors reported the importance of the interaction between the water body and the ground (Beltrão et al., 2009; Kobayashi et al., 2010; Salemi et al., 2012). This interaction is considered relevant to the aquatic environment because provide nutrients, organic matter, minerals and pollutants and as can modulate other variables as light and temperature (Falkenmark, 2011; Tsatsaros et al., 2013).
All of these factors can affect the abundance, composition, and the structure of benthic macroinvertebrates communities and differences are expected in communities from littoral and profundal environments (Silva et al., 2009; Kobayashi et al., 2010; Rui et al., 2011).
Descriptors like diversity, richness and dominance are very practice and useful because they allow the comparison between communities with different compositions (Yozzo and Osgood, 2013). In a general way, diversity and richness tend to decrease in response to stressing conditions (Carvalho et al., 2011), reduced energy input (Kreft and Jetz, 2007) or in homogeneous environments (Pacheco and Vasconcelos, 2012). The dominance tends to varies in the opposite direction.
One of the main questions in Conservation Biology is to know better the structure, composition, and which factors affects changes over time in the communities. This study aims to know the benthic community of invertebrates from Itupararanga Reservoir – an important dam in São Paulo State, because provides water supply to population and power generation to industry – to answer the following questions: a) What is the pattern of distribution of the benthic community in the longitudinal and transversal gradients in the Itupararanga reservoir? b) What are the main factors that create the biological gradient? These answers will improve the understanding about the benthic macroinvertebrates for future biomonitoring plans in Itupararanga reservoir. Once that the comprehension of its heterogeneity pattern is of major relevance to improving the knowledge about where or when the samplings must be done to achieve the biomonitoring objectives and how – considering the sources of variation – the heterogeneity of the reservoir must be considered to interpret the data obtained by the benthic community analysis.
1.1. Study area
The Itupararanga reservoir is located in the Sorocaba River Basin, in southeastern Brazil, in the state of São Paulo, one of the most populous and economically developed states of the country (Figure 1). The waters from Itupararanga are used for many purposes. The preponderant uses are water supply for the population and power generation for an aluminum plant.
The Itupararanga Reservoir is a dendritic reservoir of moderate size (surface area: 29.49 km2) and storing capability of 355 × 106 L (FF, 2011). Its waters are responsible for supplying around a million people that live in the region of the Sorocaba River basin.
region is better preserved, as there is less anthropic activity in the surrounding areas (Salles et al., 2008; Beghelli et al., 2012).
2. Material and Methods
Three distinct zones were defined a priori: riverine, near the forming rivers; transitional, in the middle of the reservoir; and lacustrine, close to
the dam. In each zone, two samples were collected: one in the central region and another in the littoral region, adding up to six samples per collection.
Samplings were carried out during two seasons: the wet season, in December 2009 and February 2010, and the dry season, in June and August 2010, totaling 24 samplings. The sampling stations were georeferenced and their geographic coordinates are listed in Table 1. Figure 2 shows the spatial localization of the stations.
Data of pH, dissolved oxygen, temperature and electric conductivity were obtained in situ, near the surface to 15m deep, using a multiprobe YSI 556. A Secchi disk was used to determine the water transparency and the photic zone region by multiplying the reading by 2.27, according to Padial and Tomaz (2008).
The following sediment analyses were performed: granulometric composition (Camargo et al., 2009), total concentrations of phosphorus (Andersen, 1976) and nitrogen (Kjedhal) (APHA, 2005), and the organic matter proportion (Wetzel and Likens, 2000). The sampling points were characterized by averages per season (wet and dry seasons); by zone (riverine, transition and lacustrine) and by region (central and littoral).
Benthic macroinvertebrates were collected using a Van Veen grab. Cumulative samples were taken in triplicate. The samplings were washed over a sieve with a 212µm pore opening. Specimens were separated from the sediment and identified using stereomicroscope
Table 1. Geographic coordinates.
Riverine Central 23° 37’ 3.8’’ S / 47° 13’ 41.4’’ W Littoral 23° 37’ 07.8’’ S / 47°13’ 39.8’’ W Transitional Central 23° 37’ 16.6’’ S / 47°21’ 30.5’’ W Littoral 23°37’ 16.6’’ S / 47° 21’ 46’’ W Lacustrine Central 23° 36’ 44.6’’ S / 47°23’ 40.9’’ W
Littoral 23° 36’ 35.9’’ S / 47° 23’ 16.9’’ W
Figure 2. The Itupararanga Reservoir, SP, Brazil. Figure showing the reservoir batimetry; the riverine, transitional and lacustrine zones designed a priori, based on Thornton et al., 1982; the dam’s position (detached in the map) and the circles are the sample points.
and an optic microscope, following these identification manuals: Saether (1980); Brinkhurst and Gelder (2001); Trivinho-Strixino (2011).
In general, identification was carried out to the genera or species level and, for the cases where this was not possible, the morphospecies concept was used for differentiation. Benthic macroinvertebrate communities were analyzed by using the measurements and indices listed in Table 2. The density of organisms was calculated by counting the total specimens of each sampling and then dividing the result by the sampled area.
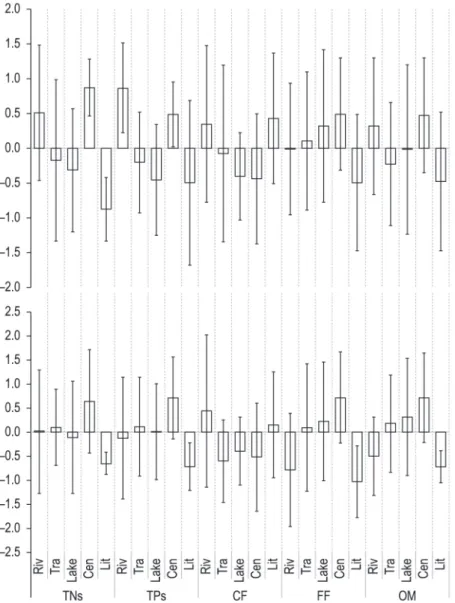
With the purpose of comparing the results from the different zones (riverine, transitional and lacustrine) and the different regions (central and littoral) bar graphs were produced to show the averages z scores by zone or region considering the range of each season. The z score is a measure of the deviation that a variable has in relation to the considered mean. The z score is calculated by the following equation: z = (x - µ) / σ, where the x is the variable value; µ is the mean of the x variable in the considered population; and σ is the standard deviation (Triola, 2008). Thus, for the graphs, the main bars are measures of how much any variable is far away from the general mean of the reservoir during the considered season. The errors bars represent the standard deviations from each variable mean.
A two-way analysis of similarities of the spatial heterogeneity significance was performed to verify the
similarity of environmental conditions observed between the sampling points, considering the abiotic data and grouping them into riverine, transitional and lacustrine zones and also into littoral and central regions (ANOSIM, n=24, 4 replicates by zone; 12 by region – central and littoral). The analyses were performed by Euclidian distance grouping and a standardized data matrix.
A second two-way ANOSIM was performed with the data of abundance per taxon considering the spatial division (4 replicates for each sampling point) and to test if there is differences between samplings performed during the dry (June and August. 2010) or wet seasons (December, 2009 and February, 2010). The data were standardized by logarithm of density values and the Bray-Curtis grouping method was used. With the objective of verifying if the differences between diversity, richness and dominance means (considering the longitudinal zones as well as the transverse regions and between seasons) were significant, a bootstrap analysis for hypothesis testing (t test) was carried out.
3. Results
The ANOSIM indicated that there really was zonation in both directions: longitudinal (p = 0.001) and transverse (p = 0.002) in the environment. This heterogeneity was determined by variables measured either in the sediment and in water (Tables 3 and 4, Figures 2-6). Furthermore, the riverine zone was
Table 2. Metrics and indexes used to analyze the benthic macroinvertebrates communities. Indices / Metrics References
Simpson richness Mandaville (2002)
Pielou uniformity J Begon et al. (2006)
Shannon-Wiener diversity index Begon et al. (2006); Lampert and Sommer (2007)
Simpson dominance index Odum (2012)
Figure 4. Proportions of organic (OM) and inorganic coarse and fine fractions of the sediments from Itupararanga reservoir, SP, Brazil considering central and littoral regions along riverine (Riv), transitional (Trans) and lacustrine (Lake) zones.
characterized with the presence of macrophytes during the wet season and the riparian vegetation was more preserved in the lacustrine zone, near the dam.
A total of 2087 specimens were sampled. The highest density values were recorded in the riverine zone (Figure 7). A total of 28 taxa were identified. The complete list of taxons can be read at Beghelli et al. (2012).
The ANOSIM that considered the biotic data matrix indicated not only the spatial heterogeneity (p = 0.0002) but also differences between samplings collected during the wet and dry seasons (p = 0.0225).
The riverine zone was specially characterized by the presence of two dominant taxa in every sampling: Limnodrilus hoffmeisteri (Claparede, 1862), and Chironomus sp. Tanytarsini and Chaoborus sp were predominant in transitional and lacustrine zones during the dry with no characteristic dominant groups during wet season (Table 5).
The richness per sampling varied from zero to 10 recorded taxa. The lower values were observed in the sampling stations of the central regions from the transitional and lacustrine zones. Moreover, the equitability varied from zero to 0.96 which gave the diversity index variations between 0.20 to 1.86 nats.
ind–1 (disconsidering samplings with only one or no specimens; Table 6).
The t tests indicated that the dominance values were significantly different when comparing the riverine with the transitional and lacustrine zones (p = 0.022 and p = 0.0043). The diversity indices could be considered distinct only when comparing the riverine to the transitional zone (p = 0.0044) but no when compared to the lacustrine. Richness did not varied differently along the considered zones and no differences were recorded between the transitional and lacustrine zones regarding diversity, dominance and richness.
4. Discussion
Longitudinal heterogeneity could be observed for biotic and abiotic components. The riverine zone exhibits major differences when compared to the others. The z score graphs indicate that the riverine zone had some characteristics that could be related to human impact, such as low dissolved oxygen and photic zone. In agreement with that, Cunha and Calijuri (2011) and Beghelli et al. (2012) classified the headwaters of Itupararanga as the more eutrophicated. Once the environment is more productive, it can support more individuals
Table 3. Summary of water variables values recorded in situ - mean, range and standard deviation (SD) - in the Itupararanga Reservoir, High Sorocaba Basin, SP, Brazil: during wet season (December, 2009 and February, 2010) measure for riverine, transitional and lacustrine zones as well for littoral and central regions. Temp.= temperature (°C), Cond = electric condutance (µS.cm–1), DO = dissolved oxygen (mg.L–1), Depth, Zeu = euphotic zone (m).
Temp pH Cond DO Depth Zeu
Riverine Mean 21.87 6.10 53.25 1.61 7.56 2.85
SD 0.55 1.50 6.40 0.41 2.76 0.90
Range 1.13 3.46 13.00 0.97 6.25 1.80
Transitional Mean 24.14 5.39 47.75 5.21 11.06 5.63
SD 0.54 2.37 3.10 3.32 8.61 1.13
Range 1.14 4.69 7.00 7.42 16.00 2.40
Lacustrine Mean 24.36 6.04 53.00 5.47 9.06 5.93
SD 1.71 2.46 13.34 3.52 8.35 2.01
Range 3.63 5.30 25.00 7.17 18.25 4.65
Littoral Mean 23.84 6.39 50.33 5.46 5.00 4.38
SD 1.89 2.00 8.43 2.80 3.06 1.76
Range 5.29 4.23 24.00 5.99 8.25 4.95
Central Mean 23.08 5.29 52.33 2.73 13.46 5.23
SD 1.10 1.97 8.89 3.05 6.60 2.18
Range 2.86 4.51 22.00 6.77 16.25 5.85
Table 4. Summary of water variables values recorded in situ - mean, range and standard deviation (SD) - in the Itupararanga Reservoir, High Sorocaba Basin, SP, Brazil: during dry season (June and August, 2010) measure for river-ine, transitional and lacustrine zones as well for littoral and central regions. Temp.= temperature (°C), Cond = electric condutance (µS.cm–1), DO = dissolved oxygen (mg.L–1), Depth, Zeu = euphotic zone (m).
Temp pH Cond DO Depth Zeu
Riverine Mean 15.35 6.17 52.75 4.86 5.28 2.85
SD 0.65 0.52 2.36 1.41 1.55 0.37
Range 1.38 1.10 5.00 2.89 3.60 0.90
Transitional Mean 17.09 5.95 53.75 5.39 8.65 4.50
SD 0.30 0.63 18.71 1.59 5.95 1.07
Range 0.72 1.50 40.00 3.59 11.5 2.40
Lacustrine Mean 17.19 6.71 56.50 6.60 12.11 4.43
SD 0.48 0.84 27.33 2.02 8.06 0.38
Range 1.01 1.89 57.00 4.51 17.3 0.90
Littoral Mean 16.71 6.48 55.50 6.26 4.44 3.75
SD 0.97 0.72 21.07 1.74 2.08 1.05
Range 2.50 1.89 57.00 5.32 5.75 2.55
Central Mean 16.38 6.07 53.17 4.97 12.92 4.10
SD 1.08 0.67 14.85 1.55 5.74 1.03
dam direction during both seasons. Once that high temperatures and depths as also low turbulence are factors that diminish instead of to increasing the dissolved oxygen concentrations in the bottom, the observed pattern must be understood as a consequence of the eutrophication process (Rixen et al., 2010; Wildsmith et al., 2011).
These data could be related to higher densities and the community composition dominated by tolerant taxa as L. hoffmeisteri and Chironomus calligraphus (Goeldi) in the riverine zone (Martins et al., 2008; Simião-Ferreira et al., 2009), resulting in high dominance values that were significantly different from that recorded in the other two zones. These results indicate that the dominance values could represent better the longitudinal pattern observed in the environment than diversity or richness. Differences between the transitional and riverine zones observed for diversity are a consequence but the nutrient excess can lead to unfavorable
conditions such as reduction of oxygenation leading to high dominance values favored by high abundances of resistant taxa as it could be noticed there (Odume et al., 2012).
Furthermore, physical characteristics as lower temperatures and depths were also relevant for the characterization of this compartment. About the sediment, high concentrations of phosphorus and nitrogen were observed in the riverine zone during the wet season, probably indicating the influence of the nutrients carried from the land and from the forming rivers due to precipitation as well the influence of the macrophytes in retaining them by increasing of the deposition of particulate organic matter (Schulz et al., 2003).
Despite of the lower depths and high turbulence in the riverine zone, the recorded values for dissolved oxygen concentrations have increased in the
river-Figure 7. Density values (ind.m–2) referring to the benthic macroinvertebrates sampled at Itupararanga Reservoir, High Sorocaba Basin, SP, Brazil, during the wet season (December, 2009 and February, 2010) and during the dry season (June and August, 2010) in the riverine, transitional and lacustrine zones as also in central and littoral regions. *Res represents the average value considering the complete reservoir during the season.
Table 5. Predominant taxons (>20%) from each sampling considering riverine (Riv), transitional (Trans) and lacus-trine (Lac) zones; central and littoral regions and month when them were sampled (December, 2009; Frebruary, June or August, 2010). The taxons are L. hoffmeisteri (Lim); Chironomus sp (Chr); Goeldichironomus sp (Goe); Procladius
sp (Pro); Chaoborus sp (Cha); Tanitarsini (Tnt); Polypedilum sp (Pol); B. sowerbyi (Bra) and Fissimentum sp (Fis).
Dec Feb Jun Aug
Riv Central Lim (72); Chr (21) Chr (50); Lim (41) Lim (85) Chr (49); Lim (40)
Litoral Lim (95.1) Chr (24); Lim (66) Chr (21); Lim (45) Lim (74)
Trans Central Goe (40); Pro (40) --- Cha (96) Cha (95)
Litoral Goe (31); Lim (31) Cha (41); Goe (37) Tnt (75) Pol (22); Tnt (31)
Lac Central --- Bra (79) Cha (73) Cha (92)
of dominance variation rather than of richness. Although no significant differences were observed between the transitional and the lacustrine zone, it must be notice that the taxonomic composition was not the same and that richness, dominance and diversity are quantitative indices that can mask qualitative differences.
About the transversal heterogeneity, the littoral region could be characterized as the one with highest temperature and dissolved oxygen in the water but with lower values for the nitrogen and phosphorus concentrations in the sediment, as well as for organic matter percentage. The granulometric composition was distinctive, probably as consequence of water flow and the reservoir bathymetry.
Higher values for richness, equitability and diversity were related to the samplings from the littoral regions. As a rule, the littoral regions have higher resource variability, more diversified luminosity and temperature conditions, high water column mixture, more diversified sediment composition, higher variability of food, refuges against predators and bottom oxygenation as consequences of the exchanges that occur with the ground (Tundisi and Matsumura-Tundisi, 2008).
Divergences when comparing these regions were highly significant (p < 0.0001 for richness, dominance and diversity) indicating that the
transversal heterogeneity is an important factor to consider to access the regional diversity and to the comprehension of the community responses to changes along time for monitoring purposes (Suurkuukka et al., 2012).
It must be noted that the environment presented distinct characteristics in the wet and dry seasons during the period of this study (2009 – 2010). As predicted, the communities showed differential composition and abundance between the wet and dry season enhancing to the global diversity in the Itupararanga reservoir. The presence of aquatic macrophytes, especially the floating species, during the wet season, as well as the inundation of adjacent areas due to the rising water level, are factors that must be considered in order to interpret the seasonality (Porst et al., 2012; Schultz and Dibble, 2012). It should be observed that the lower range values recorded during the dry season indicate more stable conditions in the environment, once that fewer fluctuations of the variables have occurred for this period. The main alterations in the community could be observed in the richness, composition (for more details read Beghelli et al., 2012) and abundance but with no clear pattern for the entire reservoir, probably due to the differences between the compartments.
Table 6. Calculated values for Simpson’s dominance index (D), Shannon diversity index (H’), nats.ind–1.; Pielou’s equability index (J) and Simpson’s richness index (d) to the benthic macroinvertebrates community from Itupararanga Reservoir, High Sorocaba Basin, SP, Brazil. Range; Mean and Standard Deviation = SD. Samples collected twice per season (wet and dry seasons) comprising the riverine (Riv), transitional (Tra) and lacustrine (Lac) zones. One sample from the center and another in the littoral for each sampling are considered. Were also calculated the means by samplings from the center (Cen) and from the littoral (Lit) as well as calculated for the reservoir (Res) as a whole.
Wet Dry
D H’ J d D H’ J d
Riv Mean 0.60 0.73 0.47 4.07 0.49 1.07 0.55 6.49
SD 0.22 0.37 0.20 1.27 0.19 0.39 0.18 1.40
Range 0.49 0.82 0.45 2.97 0.43 0.95 0.42 2.96
Tra Mean 0.25 0.90 0.67 2.25 0.64 0.82 0.44 5.48
SD 0.17 0.62 0.45 1.84 0.34 0.78 0.27 3.65
Range 0.36 1.39 0.96 4.13 0.71 1.66 0.62 8.03
Lac Mean 0.57 0.87 0.55 3.16 0.64 0.79 0.47 5.15
SD 0.34 0.72 0.38 2.69 0.18 0.43 0.11 2.65
Range 0.77 1.67 0.86 6.20 0.41 0.94 0.24 6.10
Res Mean 0.47 0.83 0.56 3.16 0.59 0.89 0.48 5.70
SD 0.28 0.54 0.33 1.98 0.24 0.52 0.19 2.54
Range 1.00 1.67 0.96 6.20 0.71 1.66 0.62 8.14
Cen Mean 0.50 0.58 0.45 1.98 0.72 0.58 0.38 4.12
SD 0.33 0.47 0.38 1.87 0.21 0.40 0.13 2.51
Range 1.00 1.06 0.96 4.57 0.49 0.88 0.35 6.16
Lit Mean 0.44 1.09 0.67 4.34 0.46 1.21 0.58 7.28
SD 0.25 0.50 0.27 1.36 0.20 0.44 0.19 1.37
Despite of that, the conclusions about seasonality here may not be understood as a general condition once the sampling design adopted did not include true replicates of each season in distinct years but distinct samplings in the same year.
It must be considered that the three sources of variation considered here do not act independently. The pattern observed can be resumed as follows: The oxygen and nutrients fluctuations as the general stability are the main forces that direct this pattern. The densities varied according the three sources of variations: nutrients and organic matter availability, as also the bathymetry seems to be the driving forces acting over density.
The littoral region maintains the richest communities but with lower densities due to the higher heterogeneity of the environment and oxygenation as well the lower organic matter accumulation. Finally, dominance is the biotic variable that is more affected due to eutrophication and pollution. In the Itupararanga Reservoir it is associated to those taxa that are resistant to pollution.
5. Conclusions
Together, these results demonstrate the responses of benthic macroinvertebrate communities considering three distinct sources of variation: longitudinal heterogeneity, determined by the increasing distance from the forming rivers that leads to a gradient of physical and chemical conditions; transverse heterogeneity, determined by the proximity with the land environment and depth differences. Seasonal heterogeneity was recorded during the period of this research and it was determined by variations in water flow, in temperature, and in the carrying of matter, nutrients and organisms.
Acknowledgements
The authors thank CAPES (Federal Agency of Support and Evaluation of Postgraduate Education) and FAPESP (São Paulo Research Foundation) for funding this research (process number 08/55636-9).
References
American Public Health Association - APHA. 2005.
Standardmethods for examination of water and
wastewater. Washington.
ANDERSEN, JM. 1976. An ignition method for determination of total phosphorus in lake sediments.
Water Research, vol. 10, no. 4, p. 329-331. http://
dx.doi.org/10.1016/0043-1354(76)90175-5
BEGHELLI, FGS., SANTOS, ACA., URSO-GUIMARÃES MV. and CALIJURI, MC. 2012. Relationship between space distribution of the benthic macroinvertebrates community and trophic state in a Neotropical reservoir (Itupararanga, Brazil).
Biota Neotropica, vol. 12, no. 4, p. 114-124. http://
dx.doi.org/10.1590/S1676-06032012000400012 BEGON, M., TOWNSEND, CR. and HARPER, JR.
2006. Ecology, from individuals to ecosystems. Oxford: Blackwell Publishing. 754 p.
BELTRÃO, GBM., MEDEIROS, ESF. and RAMOS, RTC. 2009. Effects of riparian vegetation on the structure of the marginal aquatic habitat and the associated fish assemblage in a tropical Brazilian reservoir. Biota Neotropica, vol. 9, no. 4, p. 37-43. http://dx.doi.org/10.1590/S1676-06032009000400003
BRINKHURST, RO. and GELDER, SR. 2001.
Annelida: Oligochaeta including Branchiobidellidae.
In THORP, JH. and COVICH, AP., ed. Ecology and classification of North American freshwater
invertebrates. Orlando: Academic Press. p. 431-463.
CAMARGO, OA., MONIZ, AC., JORGE, JA. and VALADARES, JMAS. 2009. Métodos de análise química, mineralógica e física de solos do Instituto
Agronômico de Campinas. Campinas: Instituto
Agronômico. 77 p. (Nota Técnica).
CARVALHO, S., PEREIRA, P., PEREIRA, F., PABLO, H., VALE, C. and GASPAR, MB. 2011. Factors structuring temporal and spatial dynamics of macrobenthic communities in a eutrophic coastal lagoon (Óbidos lagoon, Portugal). Marine
Environmental Research, vol. 71, no. 2, p. 97-110.
PMid:21236484. http://dx.doi.org/10.1016/j. marenvres.2010.11.005
CUNHA, DGF. and CALIJURI, MC. 2011. Limiting factors for phytoplankton growth in subtropical reservoirs: the effect of light and nutrient availability in different longitudinal compartments. Lake and
Reservoir Management, vol. 27, no. 2, p. 162-172.
http://dx.doi.org/10.1080/07438141.2011.574974 FALKENMARK, M. 2011. Water: a reflection of land
use. Understanding of water pathways and quality genesis. International Journal of Water Resources
Development, vol. 27, no. 1, p. 13-32. http://dx.doi.
org/10.1080/07900627.2010.536943
Fundação Florestal - FF, Secretaria do Meio Ambiente - SEMA. 2011. Plano de manejo da Área de
Proteção Ambiental (APA) Itupararanga. Ibiúna. 16 p.
KARMAKAR, S., HAQUE, SMS., HOSSAIN, MM. and SHAFIQ, M. 2011. Water quality of Kaptai reservoir in Chittagong Hill Tracts of Bangladesh.
Journal of Forestry Research, vol. 22, no. 1, p. 87-92.
http://dx.doi.org/10.1007/s11676-011-0131-6 KOBAYASHI, S., GOMI, T., SIDLE, RC. and
macroinvertebrate communities in steep headwater streams: relative importance of forest clearcutting and debris flow occurrence. Canadian Journal of Fishery
and Aquatic Sciences, vol. 67, no. 2, p. 427-444.
http://dx.doi.org/10.1139/F09-186
KREFT, H. and JETZ, W. 2007. Global patterns and determinants of vascular plant diversity. Proceedings of
National Academy Sciences, vol. 104, no. 14, p.
5925-5930. PMid:17379667 PMCid:PMC1851593. http://dx.doi.org/10.1073/pnas.0608361104 LAMPERT, W. and SOMMER, U. 2007. Communities.
In LAMPERT, W. and SOMMER, U. Limnoecology: the ecology of lakes and streams. Oxford: Oxford University Press. p. 201-234.
MANDAVILLE, SM. 2002. Benthic macroinvertebrates
in freshwaters: taxa tolerance values, metrics and
protocols. Soil & Water Conservation Society of Metro Halifax. 125 p.
MARTINS, RT., STEPHAN, NNC. and ALVES, RG. 2008. Tubificidae (Annelida:Oligochaeta) as indicator of water quality in an urban stream in southeast Brazil. Acta Limnologica Braziliensia, vol. 20, no. 3, p. 221-226.
ODUM, EP. 2012. Ecologia. Rio de Janeiro: Guanabara Koogan. 434 p.
ODUME, ON., MULLER, WJ., ARIMORO, FO. and PALMER, CG. 2012. The impact of water quality deterioration on macroinvertebrate communities in the Swartkops River, South Africa: a multimetric approach. African Journal of Aquatic Science, vol. 37, no. 2, p. 191-200. http://dx.doi.org/10.2989/1608 5914.2012.670613
PACHECO, R. and VASCONCELOS, HL. 2012. Habitat diversity enhances ant diversity in a naturally heterogeneous Brazilian landscape. Biodiversity and
Conservation, vol. 21, no. 3, p. 797-809. http://
dx.doi.org/10.1007/s10531-011-0221-y
PADIAL, AA. and THOMAZ, SM. 2008. Prediction of the light attenuation coefficient through the Secchi disk depth: empirical modeling in two large Neotropical ecosystems. Limnology, vol. 9, no. 2, p. 143-151. http://dx.doi.org/10.1007/s10201-008-0246-4
PORST, G., NAUGHTON, O., GILL, L., JOHNSTON, P. and IRVINE, K. 2012. Adaptation, phenology and disturbance of macroinvertebrates in temporary water bodies. Hydrobiologia, vol. 696, no. 1, p. 47-62. http://dx.doi.org/10.1007/s10750-012-1181-2 RIXEN, T., BAUM, A., SEPRYANI, H., POHLMANN,
T., JOSE, C. and SAMIAJI, J. 2010. Dissolved oxygen and its response to eutrophication in a tropical black water river. Journal of environmental management, vol. 91, no. 8, p. 1730-1737. PMid:20435403. http://dx.doi.org/10.1016/j.jenvman.2010.03.009 RUI, MC., VARANDAS, S., TEIXEIRA, A., HUGHES,
SJ., MAGALHÃES, M., BARQUÍN, J.,
ÁLVAREZ-CABRIA, M. and FERNÁNDEZ, D. 2011. Effects of landscape metrics and land-use variables on macroinvertebrate communities and habitat characteristics. Limnetica, vol. 30, no. 2, p. 347-362. SAETHER, OA. 1980. Glossary of chironomid morphology
terminology (Diptera, Chironomidae). Entomologica
Scandinavica. Sweden: Borgströms Tryckeri AB. 51 p. SALEMI, LF., GROPPO, JD., TREVISAN, R.,
MORAES , JM., LIMA, WP. and MARTINELLI, LA. 2012. Riparian vegetation and water yield: a synthesis, Journal of Hydrology, vol. 454, p. 195-202. SALLES, MHD., CONCEIÇÃO, FT., ANGELUCCI,
VA., SIA, R., PEDRAZZI, FJM., CARRA, TA., MONTEIRO, G., SARDINHA, DS. and NAVARRO, GRB. 2008. Avaliação simplificada de impactos ambientais na Bacia do Alto Sorocaba (SP).
Revista de Estudos Ambientais, vol. 10, no. 1, p. 6-20.
SCHULTZ, R. and DIBBLE, E. 2012. Effects of invasive macrophytes on freshwater fish and macroinvertebrate communities: the role of invasive plant traits. Hydrobiologia, vol. 684, no. 1, p. 1-14. http://dx.doi.org/10.1007/s10750-011-0978-8 SCHULZ, M., KOZERSKI, HP., PLUNTKE, T. and
RINKE, K. 2003. The influence of macrophytes on sedimentation and nutrient retention in the lower River Spree (Germany). Water Research, vol. 37, no. 3, p. 569-578. http://dx.doi.org/10.1016/S0043-1354(02)00276-2
SILVA, FL., PAULETO, GM., TALAMONI, JLB. and RUIZ, SS. 2009. Categorização funcional trófica das comunidades de macroinvertebrados de dois reservatórios na região Centro-Oeste do Estado de São Paulo, Brasil. Acta Scientiarum. Biological Sciences, vol. 31, no. 1, p. 73-78.
SIMIÃO-FERREIRA, J., DEMARCO JUNIOR, P., MAZÃO, GR. and CARVALHO, AR. 2009. Chironomidae assemblage structure in relation to organic enrichment of an aquatic environment.
Neotropical Entomology, vol. 38, no. 4, p. 464-471.
PMid:19768263. http://dx.doi.org/10.1590/S1519-566X2009000400004
SUURKUUKKA, H., MEISSNER, KK. and MUOTKA, T. 2012. Species turnover in lake littorals: spatial and temporal variation of benthic macroinvertebrate diversity and community composition. Diversity
and Distributions, vol. 18, no. 9, p. 931-941. http://
dx.doi.org/10.1111/j.1472-4642.2012.00889.x THORNTON, KW., KENNEDY, RH., MAGOUN,
AD. and SAUL, GE. 1982. Reservoir water quality sampling design. Journal of the American Water
Resources Association, vol. 18, no. 3, p. 471-480.
http://dx.doi.org/10.1111/j.1752-1688.1982. tb00014.x
WILDSMITH, MD., ROSE, TH., POTTER, IC., WARWICK, RM. and CLARKE, KR. 2011. Benthic macroinvertebrates as indicators of environmental deterioration in a large microtidal estuary. Marine
Pollution Bulletin, vol. 62, no. 3, p. 525-538.
PMid:21195437. http://dx.doi.org/10.1016/j. marpolbul.2010.11.031
YOZZO, DJ. and OSGOOD, DT. 2013. Invertebrate Communities of Low-Salinity Wetlands: overview and comparison between Phragmites and Typha Marshes Within the Hudson River Estuary. Estuaries
and Coasts, vol. 36, no. 3, p. 575-584. http://dx.doi.
org/10.1007/s12237-012-9543-6
Received: 12 August 2013 Accepted: 25 August 2014
TRIVINHO-STRIXINO, S. 2011. Larvas de
Chironomidae: guia de identificação. São Carlos:
Universidade Federal de São Carlos.
TSATSAROS, JH., BRODIE, JE., BOHNET, IC. and VALENTINE, P. 2013. Water quality degradation of coastal waterways in the wet tropics, Australia. Water
Air and Soil Pollution, vol. 224, p. 1443-1465. http://
dx.doi.org/10.1007/s11270-013-1443-2
TUNDISI, JG. and MATSUMURA-TUNDISI, T. 2008. Limnologia. São Paulo: Oficina de Textos. 632 p.
WETZEL, RG. and LIKENS, GE. 2000. Limnological