Recebido para publicação em 22/10/2009 Aceito para publicação em 31/03/2010
Seasonal variation in the phenol content of
Eugenia uniflora
L. leaves.
SANTOS, R.M.1; OLIVEIRA, M.S.2; FERRI, P.H.2; SANTOS, S.C.2*
1Faculdade de Farmácia, Universidade Federal de Goiás, C.P. 131, CEP: 74001-970, Goiânia-Brazil 2Instituto de
Química, Universidade Federal de Goiás, C.P. 131, CEP: 74001-970, Goiânia-Brazil *[email protected]
ABSTRACT: Hydrolysable tannins, total phenols and flavonoids in Eugenia uniflora leaves were
monthly analysed for one year. The results were correlated with climate conditions (rainfall, humidity, cloudiness and mean temperature) through chemometric methods. Principal component analysis revealed high levels of hydrolysable tannins in the rainy season, whereas flavonoids were mainly produced in the dry season. These facts suggest that climatic changes may be one of the factors affecting phenol levels in Eugenia uniflora.
Key words:Eugenia uniflora, pitanga, hydrolysable tannins, flavonoids, seasonal variation
RESUMO:Variação sazonal nos teores de fenóis de folhas de Eugenia uniflora L. Taninos
hidrolisáveis, fenóis totais e flavonóides presentes em folhas de Eugenia uniflora foram quantificados
mensalmente durante um ano. Os resultados foram correlacionados com as condições climáticas (pluviosidade, umidade, nebulosidade e temperatura média) através de métodos quimiométricos. Análise de componentes principais revelou a ocorrência de altos teores de taninos hidrolisáveis durante a estação de chuvas, enquanto os flavonóides foram produzidos principalmente na estação seca. Estes fatos sugerem que mudanças climáticas podem ser um dos fatores que afetam os níveis de fenóis em Eugenia uniflora.
Palavras-chave:Eugenia uniflora, pitangueira, taninos hidrolisáveis, flavonoides, variação sazonal
INTRODUCTION
Eugenia uniflora L. (Myrtaceae) is a
semi-deciduous shrubby tree native to Brazil with edible cherrylike edible fruits. Locally known as pitanga (Lorenzi, 1998), it has been widely distributed in Brazil, as well as in other countries of South America, which indicates its considerable ability to adapt to different climate and soil types. E. uniflora leaves have been used in folk medicine
for the treatment of diarrhea (Almeida et al., 1995), inflammation (Schapoval et al., 1994) and hypertension (Consolini & Sarubbio, 2002). The phenolic compounds in its leaves are responsible for some of these pharmacological activities (Lee etal., 2000).
Several factors such as soil composition, water stress, temperature and light may affect the levels of phenolic compounds in plants (Kouki & Manetas, 2002; Turtola et al., 2005). Tannin levels are altered during plant development as a response to environmental changes (Glyphis & Puttick, 1988; Salminen et al., 2001, 2004; Scogings et al., 2004; Santos et al., 2006). In the present study, we investigated the influence of climatic factors such as temperature, rainfall, cloudiness and humidity on the levels of tannins and flavonoids in E. uniflora leaves.
MATERIAL AND METHOD
Plant material and climatic data
Fully expanded leaves of E. uniflora were
monthly collected from five trees in Anápolis Municipality (16º20’12.8"S, 48º56’19.3"W), Goiás State, Brazil, between May 1999 and April 2000. Samples were certified by Professor Heleno D. Ferreira of the Department of General Biology, Federal University of Goiás. Vouchers were deposited in the Herbarium of the same institution (UFG25477 to UFG25481). Climate conditions over the study period were provided by the National Institute of Meteorology (INMET, 2009).
Sample preparation
Air-dried and powdered leaves (20 g) were extracted by stirring in an Erlenmeyer flask at room temperature with acetone:water 7:3 (4 x 100 mL). Each extract was evaporated under vacuum to 30% volume, filtered to remove fats and chlorophylls, and freeze-dried.
Colorimetric assays
by Mole & Waterman (1987) of the Hagerman & Butler method (1978). Hydrolysable tannins were quantified using KIO3 (Willis & Allen, 1998) and measured by the protein precipitation assay involving bovine serum albumin (Hagerman & Butler, 1978). The total flavonoid content was determined by a modification of the Pharmacopoeia Helvetica method (Petry et al., 1998). In the four methods, all samples were analyzed in triplicate and standard curves were constructed with tannic acid (Merck) for total phenolics, hydrolysable tannins and protein precipitation assay. Rutin (Sigma-Aldrich) was used to prepare the standard curve for total flavonoid quantification.
Except for tannins, phenol levels (P) were measured by subtracting protein precipitation (mean) from total phenolic results. Tannin/phenol ratio was obtained by dividing protein precipitation by phenol (P) results.
Statistical analysis
Principal component analysis (PCA) and Cluster analysis (CA) were done by using SPAD.N software package (Lebart et al., 1994) to study the interaction between climatic data and polyphenol content. The nearest neighbour complete linkage technique by Benzécri algorithm (Benzécri, 1980) was used as a similarity index. Hierarchical clustering was performed according to Ward’s variance minimization method (Ward Junior, 1963). Polyphenol variability and climatic relationships were obtained through canonical
Month TP
mg g-1
T mg g-1
P mg g-1
T/P HT mg g-1
Flav mg g-1
Rain (mm)
Hum (%)
Mean temp (oC)
Evap (%)
Cloud (point) may/99 96.500.79 51.771.25 44.73 1.16 92.301.42 18.900.26 66.7 60.0 22.4 183.3 3.6
jun 85.732.31 50.600.20 35.13 1.44 99.572.40 17.470.40 0.0 56.0 22.7 188.9 3.6 jul 75.801.31 43.200.69 32.60 1.33 85.173.93 16.030.40 0.0 47.8 23.8 211.1 2.5 aug 88.771.20 49.230.25 39,54 1.25 90.772.84 21.730.40 0.0 41.0 23.7 255.6 2.4 sep 90.172.76 52.400.75 37.77 1.39 95.530.78 19.770.75 66.7 50.0 26.0 233.3 3.9 oct 79.600.61 45.930.30 33.67 1.36 101.71.17 15.030.68 177.8 58.9 26.1 188.9 5.9 nov 86.371.04 54.800.89 31.57 1.74 120.91.88 15.170.75 222.2 72.8 24.0 105.6 7.0 dec 75.270.15 48.531.09 26.74 1.81 114.12.95 15.530.05 255.5 76.1 23.5 94.4 7.7 jan/00 82.931.16 51.470.78 31.46 1.64 105.92.48 16.070.42 388.9 77.8 24.1 88.9 7.9 feb 76.230.78 50.730.47 25.50 1.99 94.472.11 12.530.32 316.7 76.1 24.3 88.9 7.8 mar 75.301.04 49.071.27 26.23 1.87 91.271.36 12.200.53 200.0 76.1 24.3 100.0 7.4 apr 63.600.69 38.800.46 24.80 1.56 74.600.85 11.370.72 44.4 65.0 24.6 133.3 4.0 TABLE 1. Concentration of total phenolics, tannins, phenols, hydrolysable tannins and flavonoids, as mg g-1 dry
matter (± standard deviation), of Eugenia uniflora leaves and climatic data.
TP = total phenols, T = tannins (protein precipitation), P = phenols (TP - T), T/P = tannin/phenol ratio, HT = hydrolysable tannin, Flav = flavonoids, Rain = rainfall, Hum = humidity, Temp = temperature, Evap = evaporation, Cloud = cloudiness
(Statistical Analysis System, SAS Institute Inc., Cary, NC, 1996). The magnitude of structure correlation coefficients (canonical loadings) was used to explain canonical variates. The predictive ability was assessed by canonical redundancy analysis with standardized variation coefficients. Prior to the multivariate analysis, the data were preprocessed by means of auto-scaling and mean centering. P-values lower than 0.05 were
considered significant.
RESULT AND DISCUSSION
E. uniflora phenology is influenced by
climatic conditions typical of the Brazilian Cerrado (Romagnolo & Souza, 2006), which is characterized by two seasons: dry (April to September) and rainy (October to March). Some leaves fall during the dry season and several new leaf sprouts appear at the beginning of the rainy season, rapidly reaching the maximum size. Flowering and fruiting periods range from September to October and from October to December, respectively.
The results from phenol quantification and climatic data (rainfall, humidity, evaporation, cloudiness and mean temperature) are shown in Table 1.
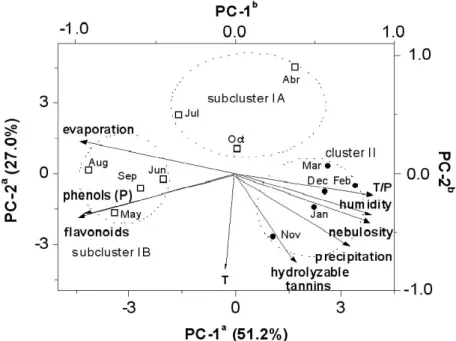
originated in the PCA. The first PC accounted for 51.2% of total variance and discriminated well above 99% confidence level between the samples collected in the dry (May to October/99 and April/00) and in the rainy (November/99 to March/00) seasons. In addition, the second PC accounted for27.0% of total variance and showed a tannin concentration gradient from April (38.80 ± 0.46 mg g-1) to November (54.80 ± 0.89 mg g-1).
Therefore, two types of clusters were found (Figure 2), cluster I included samples collected during the dry season (May to October/99 and April/00) and was characterized by high levels of phenols (P) (35.43 ± 6.24 mg g-1), flavonoids (17.19 ± 3.42 mg g-1) and
evaporation (199.2 ± 39.35 mm); cluster II included samples collected during the rainy season (November/ 99 to March/00) and revealed high levels of hydrolysable tannins (105.33 ± 12.6 mg g-1), humidity
(75.78 ± 1.82%), cloudiness (7.56 ± 0.36 score) and rainfall (276.66 ± 76.6 mm). In the present study, the dry season sampling months could be separated into the subcluster IA, which was characterized by a low percentage of tannins (42.64 ± 3.15 mg g-1), and the
subcluster IB, with the highest levels of flavonoids (19.47 ± 1.67 mg g-1) and total phenols (39.29 ± 4.05
mg g-1).
The Pearson correlation showed that the levels of phenols and flavonoids were directly correlated (p<0.01) with evaporation and inversely correlated (p<0.05) with humidity and cloudiness. There was a strong positive correlation (p<0.01)
FIGURE 1. Principal Component scatterplot of sampling months for E. uniflora during the dry (n) and the rainy (l)
seasons to which the subclusters IA/IB and the cluster II belong. aAxes indicate scores from the sampling months. bAxes indicate loadings from chemical constituents and climatic factors, represented as arrows from the origin.
Crosses represent cluster centroids and values in parentheses indicate the explained variance on each Principal Component.
between tannin/phenol ratio and rainfall, humidity and cloudiness; the levels of hydrolysable tannins were only significantly correlated (p<0.05) to cloudiness.
In fact, canonical correlation analysis (Table 2) between chemicals and climatic factors revealed that total phenols and flavonoids from the first set and evaporation, low humidity and low cloudiness from the second set load fairly strong onto the first canonical variate and are related to samples collected during the dry season (cluster I). In addition, there is also a strong positive correlation among tannins and hydrolysable tannins from the first set and precipitation, humidity and cloudiness from the second set, loading onto the second canonical variate, which corresponds to samples from the rainy period (cluster II).
Seasonal variations in leaf tannins have already been reported for deciduous trees from temperate climates, such as Quercus robur (Salminen
et al., 2004) and Betula pubescens (Salminen et al.,
2001). In these studies, phenol variations were related to leaf growth and development, as well as to herbivore pressure. Other studies with Mediterranean non-deciduous plants and subtropical savannah non-deciduous and evergreen species revealed seasonal influence on the leaf levels of nutrients and phenols (Glyphis & Puttick, 1988; Scogings et al., 2004).
For E. uniflora, the canonical correlation
Feb Jan Mar Dec Nov Apr Oct Jul Sep Aug Jun May
M onths
0 2 4 6 8 10 12 14
L
in
k
a
g
e
D
is
ta
n
c
e
Cluster I
IA IB
Cluster II
FIGURE 2. Dendrogram representing the similarity relationships of chemical composition among sampling months for E. uniflora to which clusters belong: I, samples collected during the dry season; II, samples collected during the
rainy season.
TABLE 2. Canonical structure (loadings) of chemical discriminants and climatic factors with their canonical variates. Chemical discriminants (set 1) Canonical variate Climatic factors (set 2) Canonical variate
V1 V2 W1 W2
Total phenols 0.7746 0.1249 Rainfall (mm) 0.2646 0.8857 Tannins (protein precipitation) 0.3132 0.5134 Humidity (%) 0.5871 0.7588 Hydrolysable tannins 0.0667 0.5474 Temperature (oC) 0.0747 0.1831 Flavonoids 0.8377 0.2454 Evaporation (mm) 0.6610 0.6547 Cloudiness (point) 0.4869 0.8418
Eingenvalues 0.9996 0.9751
Canonical correlation 0.9998 0.9875
Chi-square 70.37 32.22
Wilks' lambda 7.7 10-7 0.0016
Degrees of freedom 30 20
P-value 0.0130 0.041
Cumulative variance (%):
chemical discriminants 31.1 43.7
chemical-climatic relation discriminant 31.0 43.3
flavonoids increased, probably as a response to the combination between higher light incidence and drought stress. Similar effects were observed in willow and spring wheat species (Turtola et al., 2005; Feng et al., 2007). On the other hand, there are several new leaf
In conclusion, the chemical variability of E. uniflora determined by the analyses including
chemometric methods and multivariate statistical techniques may reflect an environmental influence and indicate that the observed chemical variations are also caused by selective pressures in different seasons or changes in plant phenology. These results will probably contribute to better understand the metabolism of phenolics in this species.
ACKNOWLEDGMENT
The authors thank the National Council for Scientific and Technological Development (CNPq), Support Program for Scientific and Technological Development (PADCT III) and Goiás State Research Foundation (FUNAPE/UFG) for financial support.
REFERENCE
ALMEIDA, C.E. et al. Analysis of antidiarrhoeic effect of plants used in popular medicine. Revista de Saúde Pública, v.29, n.6, p.428-33, 1995.
BARBEHENN, R.V. et al. Hydrolyzable tannins as ‘‘quantitative defenses’’: Limited impact against Lymantria dispar caterpillars on hybrid poplar. Journal of Insect Physiology, v.55, n.4, p.297-304, 2009. BENZÉCRI, J.P. L´Analyse Des Données: La Taxinomie. Tome 1, 3.ed., Paris: Dunod, 1980, 625p.
CONSOLINI, A.E.; SARUBBIO, M.G. Pharmacological effects of Eugenia uniflora (Myrtaceae) aqueous crude extract on rat’s heart. Journal of Ethnopharmacology, v.81, n.1, p.57-63, 2002.
EYLES, A. et al. Host responses to natural infection by Cytonaema sp. in the aerial bark of Eucalyptus globules.
Forest Pathology, v.33, n.5, p.317-31, 2003.
FENG, H. et al. The interactive effects of enhanced UV-B radiation and soil drought on spring wheat. South African Journal of Botany, v.73, n.3, p.429-34, 2007. GLYPHIS, J.P.; PUTTICK, G.M. Phenolics in some Southern African Mediterranean shrubland plants.
Phytochemistry, v.27, n.3, p.743-51, 1988.
HAGERMAN, A.E.; BUTLER, L.G. Protein precipitation method for the quantitative determination of tannins.
Journal Agriculture of Food Chemistry, v.26, n.4, p.809-12, 1978.
INMET, Climatologia, Gráficos climatológicos. 2009. Disponível em: <http://www.inmet.gov.br/>. Accessed on: 10 may 2000.
KOUKI, M.; MANETAS, Y. Resource availability affects
differentially the levels of gallotannins and condensed tannins in Ceratonia siliqua. Biochemical Systematics
and Ecology, v.30, n.7, p.631-9, 2002.
LEBART, L. et al. SPAD.N, version 2.5, Système Portable d’Analyse des Données Numériques. Saint Mandé, France: Centre International de Statistique et d’Informatique Appliqueés, 1994.
LEE, M.H.; CHIOU, J.F.; YEN, K.Y. EBV DNA polymerase inhibition of tannins from Eugenia uniflora. Cancer Letters, v.154, n.2, p.131-6, 2000.
LORENZI, H. Árvores brasileiras - Manual de Identificação e Cultivo de Plantas Arbóreas Nativas do Brasil. v.1, 2.ed. São Paulo: Instituto Plantarum de Estudos da Flora, 1998, 262p.
MOLE, S.; WATERMAN, P.G. A critical analysis of techniques for measuring tannins in ecological studies.
Oecologia, v.72, n.1, p.137-47, 1987.
PETRY, R.D. et al. Doseamento do teor de flavonóides totais em extratos hidroalcóolicos de Passiflora alata Dryander (maracujá). Revista Brasileira de Farmácia, v.79, n.1/2, p.7-10, 1998.
ROMAGNOLO, M.B.; SOUZA, M.C. O gênero Eugenia L. (Myrtaceae) na planície de alagável do Alto Rio Paraná, Estados de Mato Grosso do Sul e Paraná, Brasil. Acta botânica brasileira, v.20, n.3, p.529-48, 2006.
SALMINEN, J.P. et al. Seasonal variation in the content of hydrolysable tannins in leaves of Betula pubescens.
Phytochemistry, v.57, n.1, p.15-22, 2001.
SALMINEN, J.P. et al. Seasonal variation in the content of hydrolysable tannins, flavonoid glycosides, and proanthocyanidins in oak leaves. Journal of Chemical Ecology, v.30, n.9, p.1693-711, 2004.
SANTOS, S.C. et al. Seasonal variation in the content of tannins in barks of barbatimão species. Brazilian Journal of Pharmacognosy, v.16, n.4, p.552-6, 2006.
SCHAPOVAL, E.E.S. et al. Evaluation of some pharmacological activities of Eugenia uniflora L. Journal
of Ethnopharmacology, v.44, n.3, p.137-42, 1994. SCOGINGS, P.F.; DZIBA, L.E.; GORDON, I.J. Leaf chemistry of woody plants in relation to season, canopy retention and goat browsing in a semiarid subtropical savanna. Austral Ecology, v.29, n.3, p.278-86, 2004. TURTOLA, S. et al. Clone-specific responses in leaf phenolics of willows exposed to enhanced UVB radiation and drought stress. Global Change Biology, v.11, n.10, p.1655-63, 2005.
WARD JUNIOR, J.H. Hierarchical grouping to optimize an objective function. Journal of the American Statistical Association, v.58,n.301,p.236-44, 1963.