NHESSD
2, 2789–2812, 2014Meteorological effects in the lower
ionosphere
A. Rozhnoi et al.
Title Page
Abstract Introduction
Conclusions References
Tables Figures
◭ ◮
◭ ◮
Back Close
Full Screen / Esc
Printer-friendly Version
Interactive Discussion
Discussion
P
a
per
|
D
iscussion
P
a
per
|
Discussion
P
a
per
|
Discuss
ion
P
a
per
|
Nat. Hazards Earth Syst. Sci. Discuss., 2, 2789–2812, 2014 www.nat-hazards-earth-syst-sci-discuss.net/2/2789/2014/ doi:10.5194/nhessd-2-2789-2014
© Author(s) 2014. CC Attribution 3.0 License.
Natural Hazards and Earth System Sciences
Open Access
Discussions
This discussion paper is/has been under review for the journal Natural Hazards and Earth System Sciences (NHESS). Please refer to the corresponding final paper in NHESS if available.
Meteorological e
ff
ects in the lower
ionosphere as based on VLF/LF signal
observations
A. Rozhnoi1, M. Solovieva1, B. Levin2, M. Hayakawa3, and V. Fedun4
1
Institute of Physics of the Earth, Russian Academy of Sciences, Moscow, Russia
2
Institute of Marine Geology and Geophysics, Far East Branch of Russian Academy of Sciences, Yuzhno-Sakhalinsk, Russia
3
University of Electro-Communications, Advanced Wireless Communications Research Center, Chofu Tokyo, Japan
4
Department of Automatic Control and Systems Engineering, University of Sheffield,
Sheffield, UK
Received: 16 February 2014 – Accepted: 2 April 2014 – Published: 24 April 2014
Correspondence to: A. Rozhnoi ([email protected])
NHESSD
2, 2789–2812, 2014Meteorological effects in the lower
ionosphere
A. Rozhnoi et al.
Title Page
Abstract Introduction
Conclusions References
Tables Figures
◭ ◮
◭ ◮
Back Close
Full Screen / Esc
Printer-friendly Version
Interactive Discussion
Discussion
P
a
per
|
D
iscussion
P
a
per
|
Discussion
P
a
per
|
Discuss
ion
P
a
per
|
Abstract
Very low and low frequency (VLF/LF) data recorded in the Far Eastern sta-tions Petropavlovsk-Kamchatsky (158.92◦E, 53.15◦N), Yuzhno-Sakhalinsk (142.75◦E, 46.95◦N) and Yuzhno-Kurilsk (145.861◦E, 44.03◦N) are investigated to study the me-teorological effects in the lower ionosphere. The results demonstrate the sensitivity of 5
the VLF/LF signals to the variations of atmospheric pressure, humidity, wind velocity and temperature, and the VLF/LF record at the station of Yuzhno-Kurilsk is found to be most sensitive to those variations of atmospheric parameters. The region under con-sideration is characterized by high winter cyclonic activity in midlatitudes and strong summer and autumn typhoon activity in low latitudes. VLF/LF signal variations during 10
8 tropical cyclones (TCs) with different intensity are considered. Negative nighttime anomalies in the signal amplitude that are most probably caused by TC activity are found for 6 events. Those anomalies are observed during 1–2 days when TCs move in-side the sensitivity zones of the subionospheric paths. Perturbations of the VLF signal observed during 2 TCs can be caused by both the TC influence and seismic activity, but 15
no correlation between TC intensity and magnitude of the signal anomalies is found. Spectral analysis of the typhoon-induced disturbed signals revealed the fluctuations with time periods in the range of 7–16 and 15–55 min that corresponds to the range of internal gravity waves periods.
1 Introduction 20
NHESSD
2, 2789–2812, 2014Meteorological effects in the lower
ionosphere
A. Rozhnoi et al.
Title Page
Abstract Introduction
Conclusions References
Tables Figures
◭ ◮
◭ ◮
Back Close
Full Screen / Esc
Printer-friendly Version
Interactive Discussion
Discussion
P
a
per
|
D
iscussion
P
a
per
|
Discussion
P
a
per
|
Discuss
ion
P
a
per
|
and X-ray flashes, electron fluxes, zenith angle of the Sun), but also on the meteoro-logical characteristics of the lower atmosphere.
Meteorological effects in the ionosphere have been studied for a long time. The strongest disturbances in the ionosphere can be caused by cyclones and especially by tropical cyclones (TCs), which are termed hurricanes in America and typhoons in 5
the Far East and South-East Asia. Beginning with the work of Bauer (1958), the re-sponse in F region of the ionosphere to the passage of TCs was reported in a great number of papers. The fluctuations in the foF2 were found as a typhoon is approached (Shen, 1982; Liu et al., 2006). Tao et al. (2010) concluded that typhoons caused a short increase in foF2 before the landing and a persistent decrease after landing. The effects 10
of typhoon Matsa on the ionosphere were studied by Mao et al. (2010) using TEC data observed at about 50 GPS stations. They found that the evolution of TEC varia-tions had the same tendency as the typhoon-induced foF2. A change in foF2 parame-ters in connection with TC activity was analysed depending on latitude in Vanina-Dart et al. (2011). It was then shown that the character of ionospheric variations depended 15
on the stage and spatio-temporal state of TC and on the distance between the TC centre and point of the ionosphere measurements. Such a TEC-GPS method of iono-spheric disturbances detection was used recently in many other works relating to TC studies (e.g. Bishop and Straus, 2006; Xu et al., 2008; Jyh-Woei Lin, 2012; Zakharov et al., 2012; Polyakova and Perevalova, 2011). In the last work ionospheric response 20
was estimated on the example of three TCs – Katrina, Rita, and Wilma near the US At-lantic coast. Maps of TEC disturbances in two periods of ranges (2–20 and 20–60 min) were compared with those of meteorological parameters. An increase in TEC varia-tions was revealed when TCs reached their peak intensity. Those authors concluded that the radius of the region of ionospheric plasma irregularities is about 2000 km and 25
disturbances with longer periods covered a larger area.
NHESSD
2, 2789–2812, 2014Meteorological effects in the lower
ionosphere
A. Rozhnoi et al.
Title Page
Abstract Introduction
Conclusions References
Tables Figures
◭ ◮
◭ ◮
Back Close
Full Screen / Esc
Printer-friendly Version
Interactive Discussion
Discussion
P
a
per
|
D
iscussion
P
a
per
|
Discussion
P
a
per
|
Discuss
ion
P
a
per
|
the topside ionosphere from Cosmos-1809 and Intercosmos 24 satellite observations (Mikhailova et al., 2000; Isaev et al., 2002, 2012).
The experimental data may be explained in terms of the upward propagation of a broad spectrum of internal gravity waves (IGWs), tides and planetary waves (see a review by Kazimirovsky, 2002). The possible sources of these waves, problems of 5
their generation, propagation, dissipation and influence on the ionosphere plasma pa-rameters are widely discussed at present. A version of the physical mechanism of rapid interactions between tropospheric disturbances and the ionospheric response based on typhoon-generated acoustic waves and IGWs, which is dependent on the tempera-ture and wind structempera-ture in the atmosphere, was proposed in many publications, includ-10
ing the papers cited above.
Atmosphere acoustic and gravity waves are considered as a key factor in the dy-namics and energy of the atmosphere-ionosphere coupling in Sharkov (2012). IGW activities were investigated in the lower stratosphere during the typhoon passage us-ing the MU radar (Dhaka et al., 2003). Dominant gravity waves showed time periods in 15
the range of 7–8, 15, and 40–60 min. Perevalova et al. (2009) confirmed the hypothesis of IGW as a possible physical mechanism of the interaction between the troposphere and ionosphere on the basis of the analyses of data of the vertical sounding of the upper atmosphere in the Pacific region.
An alternative theory of atmosphere–ionosphere coupling is based on the influence 20
of the electric field induced by TCs (e.g. Pulinets et al., 2000; Bondur and Pulinets, 2012; Sorokin, 2006). Troposphere-ionosphere coupling is explained by the penetration in the ionosphere of the electric field from the electric charge formed at the top of a TC as a result of the convection intensification. This leads to the increase of electron concentration in the F-layer maximum over the TC center. Bondur et al. (2008), using 25
NHESSD
2, 2789–2812, 2014Meteorological effects in the lower
ionosphere
A. Rozhnoi et al.
Title Page
Abstract Introduction
Conclusions References
Tables Figures
◭ ◮
◭ ◮
Back Close
Full Screen / Esc
Printer-friendly Version
Interactive Discussion
Discussion
P
a
per
|
D
iscussion
P
a
per
|
Discussion
P
a
per
|
Discuss
ion
P
a
per
|
longwave radiation flux generated also at the hurricane top. Those authors concluded that such observed effects are due to the penetration into the ionosphere of the vertical electric field generated by the TC.
All of the methods and observations described above relate mostly to the upper iono-spheric response during the passage of TCs. It is possible that the lower D region of 5
the ionosphere can be more influenced by the processes in the troposphere, so that the effects of TCs in the lower ionosphere have been studied by in-situ mode such as rocket sounding of the equatorial D region (e.g. Sharkov, 2012). However, measure-ments with the use of rockets are very transient and spatially limited. Undoubtedly, the most suitable for the study of meteorological effects upon the D region are ground-10
based VLF/LF observations, because they provide data records continuous in time. The VLF/LF signals reflect from the lower ionosphere (∼60 km in the daytime and∼85 km at nigh) and any changes in plasma density in this region influence VLF/LF properties. The only anomaly in VLF/LF signals, which was likely to be associated with a strong TC, was reported by Hayakawa et al. (2008) in analyzing the ionospheric perturbations 15
associated with the 2007 Niigata Chuetsu-oki earthquake.
The aim of this work is to investigate the variations of VLF/LF signals associated with the meteorological factors. The analysis made previously for the LF (40 kHz) sig-nal recorded in Petropavlovsk-Kamchatsky and several Japanese stations has shown a sensitivity of the LF signal to variations of atmospheric pressure (Rozhnoi et al., 20
2006). The recent development of the VLF/LF network in the Far East region with the purpose of searching electromagnetic precursors of earthquakes as well as for the study of the lower ionosphere response to tsunami and volcano eruptions, can be utilized for the further investigations of VLF/LF variations in connection with the tropo-sphere circulation. This problem is very important for this region with extensive cyclonic 25
NHESSD
2, 2789–2812, 2014Meteorological effects in the lower
ionosphere
A. Rozhnoi et al.
Title Page
Abstract Introduction
Conclusions References
Tables Figures
◭ ◮
◭ ◮
Back Close
Full Screen / Esc
Printer-friendly Version
Interactive Discussion
Discussion
P
a
per
|
D
iscussion
P
a
per
|
Discussion
P
a
per
|
Discuss
ion
P
a
per
|
2 Data analysis and results
We have used data from three stations, sited in the Russian Far East – Petropavlovsk-Kamchatsky (PTK, 158.92◦E, 53.15◦N), Yuzhno-Sakhalinsk (YSH, 142.75◦E, 46.95◦N) and Yuzhno-Kurilsk (YUK, 145.861◦E, 44.03◦N) in this work. The position of the receiving stations and four of the VLF/LF transmitters are shown in 5
Fig. 1. All the stations are equipped with the identical receivers that register simulta-neously the amplitude and phase of MSK (Minimum Shift Key) narrowband modulated signals in the frequency range of 10–50 kHz from several transmitters. The receiver can record signals with time resolutions ranging from 50 ms to 60 s. For our purpose we use a sampling frequency of 20 s. Only the amplitudes of VLF/LF signals, for which 10
we do not need any preprocessing, are analysed in this paper. For our analysis we use a residual signal of amplitude calculated as the difference between the real signal and the monthly averaged signal. Since VLF signals are very stable during daytime and unaffected by any forcing except by X-rays emitted during solar flares, the analysis was made only for nighttime.
15
The PTK receiving station was installed in 2000, and the new receivers with on-line access to data have been put into operation in 2009 in YSH and in 2011 in YUK. The PTK station can register signals from only four transmitters: NWC (19.8 kHz) in Aus-tralia (114.16◦E, 21.81◦S), NPM (21.4 kHz) in Hawaiian Islands (158.15◦W, 21.42◦N), JJI (22.2 kHz) in Kyushu, Japan (130.83◦E, 32.08◦N) and JJY (40 kHz) in Honshu, 20
Japan (140.85◦E, 37.37◦N). These signals are analysed at every station in this work. In addition to these signals the new stations register signals from another four trans-mitters: NAA (24.0 kHz) in the USA, state Maine, NLK (24.8 kHz) in the USA, state Washington, NTS (18.6 kHz) in the east coast of Australia and VTX (18.2 kHz) in the south of India.
NHESSD
2, 2789–2812, 2014Meteorological effects in the lower
ionosphere
A. Rozhnoi et al.
Title Page
Abstract Introduction
Conclusions References
Tables Figures
◭ ◮
◭ ◮
Back Close
Full Screen / Esc
Printer-friendly Version
Interactive Discussion
Discussion
P
a
per
|
D
iscussion
P
a
per
|
Discussion
P
a
per
|
Discuss
ion
P
a
per
|
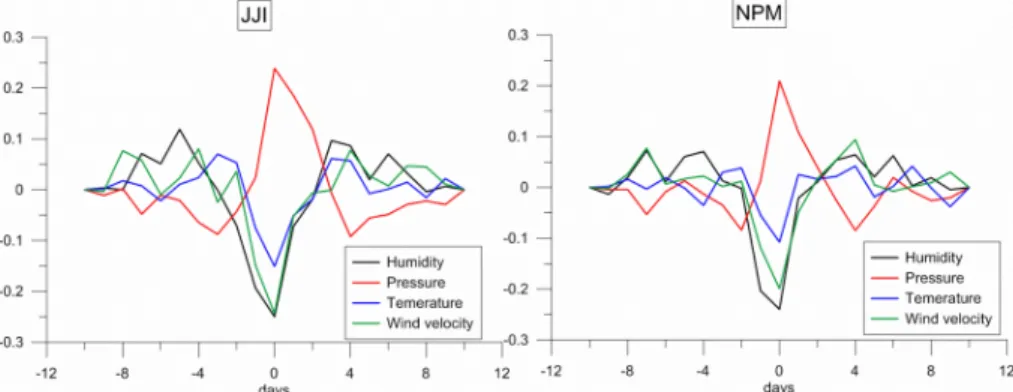
2.1 Correlation with meteorological parameters
We apply a correlation method to examine the sensitivity of the VLF/LF signals to the change of meteorological factors. We correlate the residual amplitude of the signals av-eraged over nighttime and daily average data series on atmospheric pressure, humidity, wind velocity and temperature recorded in the local weather stations (http://rp5.ru/) for 5
2012. At the PTK receiving station a clear correlation with all meteorological factors was found only for the JJY signal that confirms previously obtained results. The corre-lation at YSH station with pressure, wind velocity and temperature was revealed only for the JJI signal. However, at YUK station we have discovered a correlation with all the parameters and for all the signals. Figure 2 shows two examples of cross-covariance 10
functions calculated in an interval plus/minus 10 days for JJI and NPM signals received in Yuzhno-Kurilsk and meteorological parameters from the local weather-station.
The cross-covariance is a function of three variables, the starting element of the first section, the starting element of the second section, and the length of the sections:
CX Y(i,j,T)=E{(XT i−µX T i)(YT j−µY T i)},
15
whereXT i is the sub-sequence ofX with a mean over the section of µX T i,YT j is the sub-sequence ofY with a mean over the section ofµY T i, and E{·} is the expectation value operator.
It is found that the correlation with pressure, wind velocity and humidity is about 20– 20
25 % and is weaker for temperature (12–15 %). The correlation is positive for pressure and negative for other parameters, which demonstrates the dominating influence of winter cyclones on our results. Any external forcing on the ionosphere both from above (except X-rays) and from below cause negative nighttime amplitude anomalies. The winter cyclones bring about a sharp decrease in pressure and an increase in wind, 25
humidity and temperature (thaw) that determines the type of the correlation with the signals.
NHESSD
2, 2789–2812, 2014Meteorological effects in the lower
ionosphere
A. Rozhnoi et al.
Title Page
Abstract Introduction
Conclusions References
Tables Figures
◭ ◮
◭ ◮
Back Close
Full Screen / Esc
Printer-friendly Version
Interactive Discussion
Discussion
P
a
per
|
D
iscussion
P
a
per
|
Discussion
P
a
per
|
Discuss
ion
P
a
per
|
from the Pacific Ocean approached the Kamchatka peninsula on 16 January 2013. It reached its peak intensity on 18 January with winds about 22 m s−1. A thaw of up to 3◦C and heavy snowstorm accompanied the cyclone, and the cyclone affected the peninsula for four days until 20 January. During this period an evident decrease in the amplitude of the VLF/LF signals was observed with minimum on 18 January. The sec-5
ond weaker cyclone came up to Petropavlovsk-Kamchatsky in a week (27–29 January) and a moderate decrease in the signal amplitude was also seen at that time.
The results of analysis show that VLF/LF signals are sensitive to a change in atmo-sphere parameters. The correlation we found is even better than that with magnetic activity for the same wave paths. However, the characteristics of correlation with the 10
weather to some extent depend on the relative position of receiver and transmitter, the frequency of a signal and specifics of weather conditions in the point of registration. The station most sensitive to any variations of atmosphere parameters was found to be situated in Kunashir Island just on the coast of Pacific Ocean. The Kuril Islands are characterized by high cyclonic activity and very variable weather with a sharp change 15
of all parameters.
Of course, VLF/LF signals propagate over thousands of kilometers from a transmitter to the receiver and any change of weather along this path can influence the signal parameters. In our analysis we took into consideration only weather conditions in the registration point. For more thorough analysis we need weather data in different points 20
of paths that are not always feasible because (as it is seen from Fig. 1) the signals for the most part propagate over the ocean. Such information is available for tropical cyclones which are very active in the region under consideration.
2.2 Effects from TCs
To study the influence of TCs on the VLF/LF signal propagation we use the data of 25
NHESSD
2, 2789–2812, 2014Meteorological effects in the lower
ionosphere
A. Rozhnoi et al.
Title Page
Abstract Introduction
Conclusions References
Tables Figures
◭ ◮
◭ ◮
Back Close
Full Screen / Esc
Printer-friendly Version
Interactive Discussion
Discussion
P
a
per
|
D
iscussion
P
a
per
|
Discussion
P
a
per
|
Discuss
ion
P
a
per
|
different intensity, two of them passing over Japan and six passing in low latitudes. The TCs were selected for intervals with quiet geomagnetic conditions in order to be sure of the reliability of results. The problem of the separation of effects between a magnetic storm and a TC is considered in Afraimovich et al. (2008). Another condition in the selection of TCs and intervals of analysis is connected with very strong seismic activity 5
in the Kuril-Kamchatka, Japan and South-East Asia region. This fact was the reason why we have developed the network of VLF/LF stations in this region. So, to avoid the possible influence of other factors, we analyse our data during an interval of about two weeks (except for Fig. 7). It is long enough to find typhoon-induced anomalies in the signals because, as rule, it takes 1–3 days for a TC to cross the sensitivity zones (fifth 10
Fresnel zones) of paths under analysis. Figures 4–7 illustrate only the centres of TCs. But TCs have a radius of several hundred kilometers and they can influence VLF/LF signals approaching the wave path sensitivity zone or leaving it. Below we provide results of case study analysis of TCs effects on the VLF/LF signals.
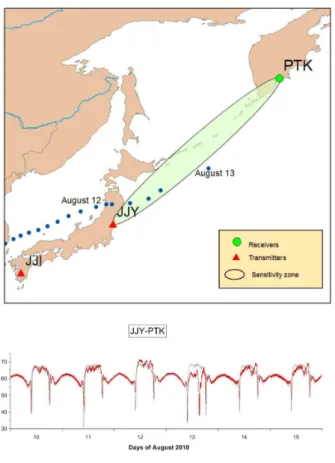
TC Dianmu (1004) formed as a tropical depression (TD) south of the Okinawa Is-15
lands on 7 August 2010. It made landfall in the northern part of Honshu on 12 August with tropical storm (TS) intensity and transformed into an extratropical cyclone south of Hokkaido that day when it began to cross the sensitivity zone of the JJY-PTK path. Di-anmu remained as an extratropical cyclone until 13 August. Figure 4 illustrates the TC movement during 12–13 August, the sensitivity zone of the JJY-PTK path and the am-20
plitude of the JJY signal recorded in the PTK station during the period 10–15 August. Red and black lines in the figure are the observed and averaged signals, respectively. A strong decrease in the amplitude (about 20 dB) is observed in nighttime on 13 Au-gust, but unfortunately, the JJI transmitter had some interruptions in operation during this period so that we cannot compare its data with JJY results.
25
NHESSD
2, 2789–2812, 2014Meteorological effects in the lower
ionosphere
A. Rozhnoi et al.
Title Page
Abstract Introduction
Conclusions References
Tables Figures
◭ ◮
◭ ◮
Back Close
Full Screen / Esc
Printer-friendly Version
Interactive Discussion
Discussion
P
a
per
|
D
iscussion
P
a
per
|
Discussion
P
a
per
|
Discuss
ion
P
a
per
|
maximum sustained winds of 50 kt (25 m s−1) and a central pressure of 992 hPa in the East China Sea on 5 September. Malou crossed Tsushima Island early on 7 September and then made landfall in Japan just before weakening to TD intensity on the next day. It moved across Japan that day and then dissipated east of Japan on 10 September. The decrease in the amplitude of the JJI-YSH and JJI-PTK paths is observed on 7 and 5
8 September, respectively when the TC crossed their sensitivity zones.
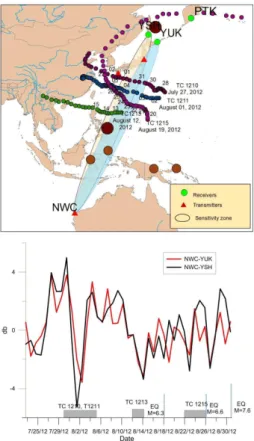
The next two TCs shown in Fig. 6 passed across the three wave paths: NWS-PTK, NWC-YUK and NWS-YSH in July and August 2013. The TC Soulik (1307) was gener-ated as a TD west north of the Northern Mariana Islands on 7 July 2013, and it was upgraded to TS intensity the next day. Soulik was upgraded to severe tropical storm 10
(STS) intensity 12 h later and it was upgraded to typhoon (TY) intensity on 9 July. It reached its peak intensity with maximum sustained winds of 100 kt (51 m s−1) and a central pressure of 925 hPa on 10 July. Soulik remained with this intensity during the next day. The TC moved across sensitivity zones of the three paths from 8 July (NWC-PTK) to 11 July (NWC-YSH). The decrease in the NWC signal recorded in the 15
PTK station is observed on 9 July, when the TC moved across the sensitivity zone of this path. Negative anomalies in the NWC signal recorded at the YUK station were detected on 9 and 10 July during the TC movement to the west and on the next day we could observe a decrease in the NWS signal recorded at the YSH station.
The TC Utor (1311) formed as a TD north west of Caroline Islands on 8 August 2013, 20
was upgraded to TS intensity the next day. Utor was upgraded to TY intensity on 10 August and it reached its peak intensity with maximum sustained winds of 100 kt (51 m s−1) and a central pressure of 925 hPa on 11 August. The TC moved across sen-sitivity zones of the three paths during 9–11 August. The decrease of the signals in YSH and YUK stations is noticeable on 9 and 11 August. A maximum anomaly is ob-25
NHESSD
2, 2789–2812, 2014Meteorological effects in the lower
ionosphere
A. Rozhnoi et al.
Title Page
Abstract Introduction
Conclusions References
Tables Figures
◭ ◮
◭ ◮
Back Close
Full Screen / Esc
Printer-friendly Version
Interactive Discussion
Discussion
P
a
per
|
D
iscussion
P
a
per
|
Discussion
P
a
per
|
Discuss
ion
P
a
per
|
The last period selected for our analysis is August 2012 when four TCs with diff er-ent intensity were formed in the South Asia region and moved across the paths under consideration. The receiver in PTK was temporally out of operation during this period, so that we analyze the signals on two paths. The interval of analysis was from 23 July to 31 August. During this period there occurred three strong earthquakes with the epi-5
centers inside the sensitivity zones of our paths – on 18 August (M=6.3), 26 August (M=6.6) and 31 August (M=7.6). The first TC Damrey (1210) in the interval of analy-sis was formed as a TD west of Minamitorishima Island on 27 July 2012, and it was up-graded to TS intensity the next day. Damrey was upup-graded to STS intensity on 30 July and it was upgraded to TY intensity over the Yellow Sea the next day and reached its 10
peak intensity with maximum sustained winds of 70 kt (36 m s−1) and a central pressure of 965 hPa. This TC entered the sensitivity zone of the path NWC-YUK on 30 July and it moved across the paths under consideration until 1 August. Following Damrey another TC Haikui (1211) was formed on 1 August. It was upgraded to TS intensity on 3 Au-gust and then Haikui was upgraded to STS intensity northwest of Okinawa Island on 15
5 August. It was upgraded to TY intensity and reached its peak intensity with maximum sustained winds of 65 kt (33 m s−1) and a central pressure of 965 hPa on 7 August. Haikui moved across the NWC-YUK and NWC-YSH sensitivity paths during 3–5 Au-gust. The TC 1210 apparently caused a decrease in the signal on the path NWC-YSH observed on 1 August. The decrease in the signal on the path NWC-YUK on 2 August, 20
is most likely to be under the influence of the TC 1211.
The TC Kai-tak (1213) was generated as a TD east of the Philippines, which is inside sensitivity zones of the paths under analysis, on 12 August. It was upgraded to TS intensity on 13 August and it left the sensitivity zones on 14 August before reaching its peak intensity. The decrease of the signals on both paths on 14 August can be 25
NHESSD
2, 2789–2812, 2014Meteorological effects in the lower
ionosphere
A. Rozhnoi et al.
Title Page
Abstract Introduction
Conclusions References
Tables Figures
◭ ◮
◭ ◮
Back Close
Full Screen / Esc
Printer-friendly Version
Interactive Discussion
Discussion
P
a
per
|
D
iscussion
P
a
per
|
Discussion
P
a
per
|
Discuss
ion
P
a
per
|
maximum sustained winds of 100 kt (51 m s−1) and with central pressure of 910 hPa on 25 August. It passed around Okinawa Island with TY intensity the next day. The typhoon moved across the sensitivity zones of our wave paths during 22–26 August in its peak intensity. Nevertheless, it seems that this TC did not have significant influence, if any, on the VLF signal. Some decrease in the signal on both paths can be seen on 5
22 and 26 August, but we are not sure that this decrease is unambiguously related to the TC because of the occurrence of two earthquakes on 26 and 31 August.
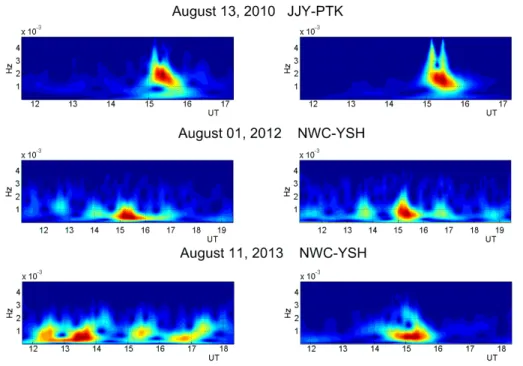
We made an analysis of the spectral composition of the VLF/LF signals for typhoon-induced disturbed days. For the analysis we used the filtered (0.2–15 mHz) nighttime amplitudes and phases of the signals. Some examples are given in Fig. 8. The fig-10
ure illustrates the wavelet spectra of the JJY signal recorded at the PTK station on 13 August 2010 (TC 1004) and the NWC signal recorded at the YSH station on 1 Au-gust 2012 (TC 1210) and 11 AuAu-gust 2013 (TC 1311). The anomalies in the VLF/LF signals observed on these days can be caused only by TCs activity. The maximum of spectral energy both in the phase and amplitude of the JJY signal is in the interval 15
1–2.5 mHz (i.e. periods of about 7–16 min). The maximum in the fluctuation spectra of the NWC signal on two disturbed days is in the range of periods of about 15–55 min. These periods found in the TC-disturbed days correspond to the range of periods for IGWs.
3 Conclusions
20
Perturbations of the VLF/LF signals associated with meteorological factors were inves-tigated in this work. The correlation analysis made for four VLF/LF transmitter signals in the frequency range of∼20–40 kHz recorded in three receiving stations in the Far East region has shown that VLF/LF signals are sensitive to any change of atmosphere parameters (pressure, humidity, wind velocity and temperature). However, the char-25
NHESSD
2, 2789–2812, 2014Meteorological effects in the lower
ionosphere
A. Rozhnoi et al.
Title Page
Abstract Introduction
Conclusions References
Tables Figures
◭ ◮
◭ ◮
Back Close
Full Screen / Esc
Printer-friendly Version
Interactive Discussion
Discussion
P
a
per
|
D
iscussion
P
a
per
|
Discussion
P
a
per
|
Discuss
ion
P
a
per
|
registration. The station exhibiting the highest sensitivity to variations of atmosphere parameters was found to be the one situated in Kunashir Island.
For the first time, we performed a detailed analysis of the VLF/LF signals sensitivity to TCs, in which eight TCs of different intensity passing across the VLF/LF signal wave paths were considered. Negative nighttime anomalies in the signal amplitude that are 5
most probably caused by TC activity, have been found for the 6 events. Those anoma-lies were observed during 1–2 days when TCs moved inside the sensitivity zones of the subionospheric paths. In two cases (TC 1213 and TC 1215) we could not estab-lish the cause of the signal decrease, because it can be due to either the TCs influ-ence or seismic activity. The spectral composition of the TC-disturbed signals is very 10
close to the spectral composition of seismo-disturbed days (Rozhnoi et al., 2012). Our spectral analysis made for the typhoon-induced disturbed VLF/LF signals revealed the maximum of fluctuation spectral energy in the interval of periods of about 7–16 and 15–55 min that corresponds to the range of IGW periods. This result corroborates the theory of penetration into the lower ionosphere the typhoon-generated IGWs.
15
We have not found any direct correlation between the TC intensity and magnitude of the signal anomalies.
Acknowledgements. The work was supported by joint UK-Russia project under grant 13-05-92602 KO_a and under grant RFBR 14-05-00099.
References 20
Afraimovich, E. L., Voeykov, S. V., Ishin, A. B., Perevalova, N. P., and Ruzhin, Y. Y.: Variations in the total electron content during a powerful typhoon of 5–11 August 2006, near the South-eastern Coast of China, Geomagnet. Aeronom., 48, 703–708, 2008.
Bauer, S. J.: An apparent ionospheric response to the passage of hurricanes, J. Geophys. Res., 63, 265–269, 1958.
25
NHESSD
2, 2789–2812, 2014Meteorological effects in the lower
ionosphere
A. Rozhnoi et al.
Title Page
Abstract Introduction
Conclusions References
Tables Figures
◭ ◮
◭ ◮
Back Close
Full Screen / Esc
Printer-friendly Version
Interactive Discussion
Discussion
P
a
per
|
D
iscussion
P
a
per
|
Discussion
P
a
per
|
Discuss
ion
P
a
per
|
11–15 December 2006); EOS Transactions, American Geophysical Union, 87, Suppl. Re-port No. SA33B-0276, 2006.
Bondur, V. G. and Pulinets, S. A.: Effect of mesoscale atmospheric vortex processes on the
upper atmosphere and ionosphere of the Earth, Izvestiya, Atmos. Ocean. Phys., 48, 871– 878, 2012.
5
Bondur, V. G., Pulinets, S. A., and Uzunov, D.: Ionospheric effect of large-scale atmospheric
vortex by the examle of Hurricane Katrina, Issledovaniya Zemli iz kosmosa (Study of the Earth from the space), 6, 3–11, 2008 (in Russian).
Dhaka, S K, Takahash, i M, Shibagaki, Y., Yamanaka, M. D., and Fukao, S.: Gravity wave generation in the lower stratosphere due to passage of the typhoon 9426 (Orchid)
ob-10
served by the MU radar at Shigaraki (34.85◦N, 136.10◦E), J. Geophys. Res., 108, 4595,
doi:10.1029/2003JD003489, 2003.
Hayakawa, M., Horie, T., Yoshida, M., Kasahara, Y., Muto, F., Ohta, K., and Nakamura, T.: On the ionospheric perturbation associated with the 2007 Niigata Chuetsu-oki earthquake, as seen from subionospheric VLF/LF network observations, Nat. Hazards Earth Syst. Sci., 8,
15
573–576, doi:10.5194/nhess-8-573-2008, 2008.
Huang, Y. N., Cheng, K., and Chen, S. W.: On the detection of acoustic-gravity waves generated by typhoon by use of real time HF Doppler frequency shift sounding system, Radio Sci., 20, 897–906, doi:10.1029/RS020i004p00897, 1985.
Isaev, N. V., Sorokin, V. M., Chmyrev. V. M., and Serebryakova. O. N.: Ionospheric electric fields
20
related to sea storms and typhoons, Geomagnet. Aeronom., 42, 638–643, 2002.
Isaev, N. V., Kostin, V. M., Belyaev, G. G., Ovcharenko, O. Ya., and Trushkina, E. P.: Distur-bances of the topside ionosphere caused by typhoons, Geomagnet. Aeronom., 50, 243–255, 2012.
Kazimirovsky, E.: Coupling from below as a source of ionospheric variability: a review, Ann.
25
Geophys.-Italy, 45, 1–29, 2002.
Lin, J. W.: Study of ionospheric anomalies due to impact of typhoon using principal component analysis and image processing, J. Earth Syst. Sci., 121, 1001–1010, doi:10.1007/s12040-012-0214-6, 2012.
Liu, Y. M, Wang, J. S., and Suo, Y. C.: Effects of typhoon on the ionosphere, Adv. Geosci., 29,
30
351–360, 2006,
NHESSD
2, 2789–2812, 2014Meteorological effects in the lower
ionosphere
A. Rozhnoi et al.
Title Page
Abstract Introduction
Conclusions References
Tables Figures
◭ ◮
◭ ◮
Back Close
Full Screen / Esc
Printer-friendly Version
Interactive Discussion
Discussion
P
a
per
|
D
iscussion
P
a
per
|
Discussion
P
a
per
|
Discuss
ion
P
a
per
|
Mao, T., Wang, J. S., Yang, G. L., Yu, T., Ping, J. S., and Suo, Y. C.: Effects of typhoon Matsa
on ionospheric TEC, Chinese Sci., 55, 712–717, doi:10.1007/s11434-009-0472-0, 2010. Mikhailova, G. A., Mikhailov, Y. M., and Kapustina, O. V.: ULF-VLF electric fields in the external
ionosphere over powerful typhoons in Pacific Ocean, Geomagnet. Aeronom., 2, 153–158, 2000.
5
Perevalova, N. P. and Polekh, N. M.: An investigation of the upper atmosphere response to cyclones using ionosonde data in Eastern Siberia and the Far East, in: Proc. SPIE 7296, Fifteenth International Symposium on Atmospheric and Ocean Optics/Atmospheric Physics, 72960J, 11 February 2009, Krasnoyarsk, Russia, doi:10.1117/12.823814, 2009.
Polyakova, A. S. and Perevalova, N. P.: Investigation into impact of tropical cyclones on the
10
ionosphere using GPS sounding and NCEP/NCAR Reanalysis data, Adv. Space Res., 48, 1196–1210, 2011.
Pulinets, S. A., Boyarchuk, K. A., Hegai, V. V., Kim, V. P., and Lomonosov, A. M.: Quasielectro-static model of atmosphere-thermosphere-ionosphere coupling, Adv. Space Res., 26, 1209– 1218, 2000.
15
Rozhnoi, A. A., Solovieva, M. S., Molchanov, O. A., Hayakawa, M., Maekawa, S., and Biagi, P. F.: Sensitivity of LF signal to global ionosphere and atmosphere perturbations in the network of stations, Phys. Chem. Earth, 1, 409–415, 2006.
Rozhnoi, A., Solovieva, M., Biagi, P. F., Schwingenschuh, K., and Hayakawa, M.: Low fre-quency signal spectrum analysis for strong earthquakes, Ann. Geophys.-Italy, 55, 181–186,
20
doi:10.4401/ag-5076, 2012.
Sharkov, E. A.: Global Tropical Cyclogenesis, Springer Praxis Books, p. 604, Springer Berlin Heidelberg, 2012.
Shen, C. S.: The correlations between the typhoon and the FoF2 of ionosphere, Chinese J. Space Sci., 2, 335–340, 1982 (in Chinese).
25
Sorokin, V. M., Yaschenko, A. K., Chmyrev, V. M., and Hayakawa, M.: DC electric field formation in the mid-latitude ionosphere over typhoon and earthquake regions, Phys. Chem. Earth, 31, 454–461, 2006.
Tao, Y., Wang, Y. G., Mao, T., Wang, J. S., Wang, S. Y., Shuai, F. H., Su, W. D., and Li, J. T.: A case study of the variation of ionospheric parameter during typhoons at Xiamen, Acta
30
NHESSD
2, 2789–2812, 2014Meteorological effects in the lower
ionosphere
A. Rozhnoi et al.
Title Page
Abstract Introduction
Conclusions References
Tables Figures
◭ ◮
◭ ◮
Back Close
Full Screen / Esc
Printer-friendly Version
Interactive Discussion
Discussion
P
a
per
|
D
iscussion
P
a
per
|
Discussion
P
a
per
|
Discuss
ion
P
a
per
|
Vanina-Dart, L. B., Romanov, A. A., and Sharkov, E. A.: Influence of a tropical cyclone on the upper ionosphere according to tomography sounding data over Sakhalin Island in Novem-ber 2007, Geomagnet. Aeronom., 51, 774–782, 2011.
Xiao, S. G., Zhang, D. G., and Xiao, Z.: Study on the detectability of typhoon-generated acoustic-gravity waves, Chinese J. Space Sci., 27, 35–40, 2007.
5
Xiao, S. G., Shi, J. K., Zhang, D. H., Hao, Y. Q., and Huang, W. Q.: Observational study of day-time ionospheric irregularities associated with typhoon, Sci. China Technol. Sci., 55, 1302– 1304, doi:10.1007/s11431-012-4816-7, 2012.
Xiao, Z., Xiao, S. G., Hao, Y. Q., and Zhang, D, H.: Morphological features of ionospheric response to typhoon, J. Geophys. Res., Space Phys., 112, A04304,
10
doi:10.1029/2006JA011671, 2007.
Xu, G., Wan, W., She, C., and Du, L.: The relationship between ionospheric total electron con-tent (TEC) over East Asia and the tropospheric circulation around the Qinghai-Tibet Plateau obtained with a partial correlation method, Adv. Space Res., 42, 219–223, 2008.
Zakharov, V. I. and Kunitsyn, V. E.: Regional features of atmospheric manifestations of tropical
15
NHESSD
2, 2789–2812, 2014Meteorological effects in the lower
ionosphere
A. Rozhnoi et al.
Title Page
Abstract Introduction
Conclusions References
Tables Figures
◭ ◮
◭ ◮
Back Close
Full Screen / Esc
Printer-friendly Version
Interactive Discussion
Discussion
P
a
per
|
D
iscussion
P
a
per
|
Discussion
P
a
per
|
Discuss
ion
P
a
per
|
Fig. 1. A map showing the position of the receivers in Petropavlovsk-Kamchatsky (PTK),
NHESSD
2, 2789–2812, 2014Meteorological effects in the lower
ionosphere
A. Rozhnoi et al.
Title Page
Abstract Introduction
Conclusions References
Tables Figures
◭ ◮
◭ ◮
Back Close
Full Screen / Esc
Printer-friendly Version
Interactive Discussion
Discussion
P
a
per
|
D
iscussion
P
a
per
|
Discussion
P
a
per
|
Discuss
ion
P
a
per
|
Fig. 2.Cross-covariance functions for the average residual amplitude in nighttime of the JJI
NHESSD
2, 2789–2812, 2014Meteorological effects in the lower
ionosphere
A. Rozhnoi et al.
Title Page
Abstract Introduction
Conclusions References
Tables Figures
◭ ◮
◭ ◮
Back Close
Full Screen / Esc
Printer-friendly Version
Interactive Discussion
Discussion
P
a
per
|
D
iscussion
P
a
per
|
Discussion
P
a
per
|
Discuss
ion
P
a
per
|
temperature (°C).
Fig. 3.An example of the anomalies observed in the amplitude of the signals recorded at the
PTK station during two cyclones in January 2013. The top panel shows the average residual
NHESSD
2, 2789–2812, 2014Meteorological effects in the lower
ionosphere
A. Rozhnoi et al.
Title Page
Abstract Introduction
Conclusions References
Tables Figures
◭ ◮
◭ ◮
Back Close
Full Screen / Esc
Printer-friendly Version
Interactive Discussion
Discussion
P
a
per
|
D
iscussion
P
a
per
|
Discussion
P
a
per
|
Discuss
ion
P
a
per
|
Fig. 4.The bottom panel shows an example of anomaly in the JJY signal recorded at the PTK
NHESSD
2, 2789–2812, 2014Meteorological effects in the lower
ionosphere
A. Rozhnoi et al.
Title Page
Abstract Introduction
Conclusions References
Tables Figures
◭ ◮
◭ ◮
Back Close
Full Screen / Esc
Printer-friendly Version
Interactive Discussion
Discussion
P
a
per
|
D
iscussion
P
a
per
|
Discussion
P
a
per
|
Discuss
ion
P
a
per
|
Fig. 5. The anomalies in the JJI signal recorded at the PTK and YSH stations during the
NHESSD
2, 2789–2812, 2014Meteorological effects in the lower
ionosphere
A. Rozhnoi et al.
Title Page
Abstract Introduction
Conclusions References
Tables Figures
◭ ◮
◭ ◮
Back Close
Full Screen / Esc
Printer-friendly Version
Interactive Discussion
Discussion
P
a
per
|
D
iscussion
P
a
per
|
Discussion
P
a
per
|
Discuss
ion
P
a
per
|
Fig. 6. The anomalies in the NWC signal recorded at three stations during the passage of
NHESSD
2, 2789–2812, 2014Meteorological effects in the lower
ionosphere
A. Rozhnoi et al.
Title Page
Abstract Introduction
Conclusions References
Tables Figures
◭ ◮
◭ ◮
Back Close
Full Screen / Esc
Printer-friendly Version
Interactive Discussion
Discussion
P
a
per
|
D
iscussion
P
a
per
|
Discussion
P
a
per
|
Discuss
ion
P
a
per
|
Fig. 7.The anomalies in the NWC signal recorded at the YSH and YUK stations during the
NHESSD
2, 2789–2812, 2014Meteorological effects in the lower
ionosphere
A. Rozhnoi et al.
Title Page
Abstract Introduction
Conclusions References
Tables Figures
◭ ◮
◭ ◮
Back Close
Full Screen / Esc
Printer-friendly Version
Interactive Discussion
Discussion
P
a
per
|
D
iscussion
P
a
per
|
Discussion
P
a
per
|
Discuss
ion
P
a
per
|
Fig. 8.Examples of the wavelet spectra of the filtered (0.2–15 mHz) typhoon-induce disturbed