NPGD
1, 977–997, 2014Precursors of earthquakes in VLF
range observed by DEMETER Satellite
D. K. Sondhiya et al.
Title Page
Abstract Introduction
Conclusions References
Tables Figures
◭ ◮
◭ ◮
Back Close
Full Screen / Esc
Printer-friendly Version
Interactive Discussion
Discussion
P
a
per
|
D
iscussion
P
a
per
|
Discussion
P
a
per
|
Discuss
ion
P
a
per
|
Nonlin. Processes Geophys. Discuss., 1, 977–997, 2014 www.nonlin-processes-geophys-discuss.net/1/977/2014/ doi:10.5194/npgd-1-977-2014
© Author(s) 2014. CC Attribution 3.0 License.
Open Access
Nonlinear Processes in Geophysics
Discussions
This discussion paper is/has been under review for the journal Nonlinear Processes in Geophysics (NPG). Please refer to the corresponding final paper in NPG if available.
On the possibility of precursors of
earthquakes in VLF range observed by
DEMETER Satellite
D. K. Sondhiya1, S. Kumar2, and A. K. Gwal1
1
Space Science Laboratory, Department of Physics, Barkatullah University, Bhopal-462026, India
2
School of Engineering and Physics, The University of the South Pacific, Suva, Fiji
Received: 27 March 2014 – Accepted: 24 April 2014 – Published: 19 May 2014 Correspondence to: D. K. Sondhiya ([email protected])
NPGD
1, 977–997, 2014Precursors of earthquakes in VLF
range observed by DEMETER Satellite
D. K. Sondhiya et al.
Title Page
Abstract Introduction
Conclusions References
Tables Figures
◭ ◮
◭ ◮
Back Close
Full Screen / Esc
Printer-friendly Version
Interactive Discussion
Discussion
P
a
per
|
D
iscussion
P
a
per
|
Discussion
P
a
per
|
Discuss
ion
P
a
per
|
Abstract
Very Low Frequency (VLF) disturbances in the ionospheric electric field observed by DEMETER satellite prior to three different earthquakes that occurred during the years 2008–2009 have been presented. The electromagnetic wave data has been analyzed for few days before the earthquake with special attention to the variation in
5
spectral characteristics and non-linear effects using the statistical and wavelet based techniques. Results indicate that the earthquake preparation process may disturb the ionospheric plasma and these disturbances can reach the non-linear stage leading to the strong variations in the electromagnetic field and plasma parameters. The enhancement in statistical parameters shows the coherent structure and intermittent
10
phenomenon which is the signature of turbulence. The characteristics features of VLF disturbances have further been studied using the wavelet and bispectral analysis tools which provide useful information on the plasma turbulence.
1 Introduction
Over the seismic regions observations of anomalous plasma changes and
15
electromagnetic emissions related with ionosphere indicate the existence of severe processes which control the state of circumterrestrial plasma for periods from several hours to several days (Boskova et al., 1994; He et al., 2009; Zhao et al., 2008). During the incidence of any strong earthquake, electric field may be generated within the upper atmosphere due to seismo-ionospheric coupling (Hayakawa, 1999; Hayakawa et al.,
20
2004; Pulinets et al., 2004). Underground gas discharges carry submicron aerosols with them which influence near Earth’s conductivity and generate extraneous electric field. Satellite observations show the presence of seismo-electromagnetic emissions in the frequency ranging from Ultra Low Frequency (ULF) to Very Low Frequency (VLF) in the seismically active zones prior to the commencement of any large earthquake
25
NPGD
1, 977–997, 2014Precursors of earthquakes in VLF
range observed by DEMETER Satellite
D. K. Sondhiya et al.
Title Page
Abstract Introduction
Conclusions References
Tables Figures
◭ ◮
◭ ◮
Back Close
Full Screen / Esc
Printer-friendly Version
Interactive Discussion
Discussion
P
a
per
|
D
iscussion
P
a
per
|
Discussion
P
a
per
|
Discuss
ion
P
a
per
|
The influence of dynamic processes in the lower atmosphere and on the ionosphere was substantiated by satellite observations of electric field perturbations and plasma density fluctuations above earthquake development regions (Sorokin, 2007; Sorokin and Hayakawa, 2013). The mechanisms that could perturb the ionospheric plasma during the preparation of earthquakes are related to the redistribution of charges at
5
the surface of the Earth, the emission of radioactive gas (radon) and the upward propagation of acoustic gravity waves (e.g. Pulinets and Boyarchuk, 2004, and references therein). The disturbances in the ionospheric plasma can reach the nonlinear stage leading to the phenomena of intermittence, which is considered as a sign of turbulence. Kinney et al. (1995) investigated the phenomenon of
magneto-10
hydrodynamic turbulence using numerical simulations and found that influence of the coherent magnetic vortices is responsible for this behavior. The intermittence is characterized by the shape of the power spectrum and the high-order spectral analysis (McComb, 1990; Frisch, 1995). Hussain (1983) defined the Coherent Structures (CS) in turbulent variables (velocity, momentum, density, temperature, transport of mass
15
and heat) that have high self-correlation. These structures are strongly associated with energy dissipation of the turbulent flows and are also a source of non-linearity at least in some scales.
The present paper deals with the analysis of phenomenon of intermittent and coherent structure in the ionospheric plasma in VLF range registered by DEMETER
20
(Detection of Electromagnetic Emission Transmitted to Earthquake Region) micro-satellite. The DEMETER satellite flew close to the epicenter of the earthquakes many times and operated in burst mode. The waveforms registered in this mode can be analyzed using wavelet, bispectral and statistical methods to detect the ULF-VLF disturbances in the ionospheric plasma. The geomagnetic conditions (Dst<50 nT)
25
NPGD
1, 977–997, 2014Precursors of earthquakes in VLF
range observed by DEMETER Satellite
D. K. Sondhiya et al.
Title Page
Abstract Introduction
Conclusions References
Tables Figures
◭ ◮
◭ ◮
Back Close
Full Screen / Esc
Printer-friendly Version
Interactive Discussion
Discussion
P
a
per
|
D
iscussion
P
a
per
|
Discussion
P
a
per
|
Discuss
ion
P
a
per
|
2 Theoretical framework
Fourier analysis is inappropriate for the analysis of turbulence in the plasma (Farge, 1996); therefore we have used wavelet transform technique. The usefulness of wavelet to detect the turbulence was underlined by Farge (1992) in the context of coherent structures. The main advantage of wavelet transform is that it preserves the information
5
about the local features (e.g. singularities) of the signal and also allows reconstruction of the signal over a given range of scales. This property is of importance in the study of turbulence, which often shows coherent structures that are apparently related to non-linear processes. More discussion about wavelet transform and its applications to turbulence analysis can be found in number of books and review articles (e.g. Farge
10
et al., 1996; Mallat, 1998; Wernik, 2002, 2005). A more detailed description of methods used in this work can be found in Błecki et al. (2007, 2009, and 2012).
2.1 Wavelet power and global wavelet spectrum analysis
Wavelet-based analyses involve the use of the Continuous Wavelet Transform (CWT) (Torrence and Compo, 1998) of VLF transientsf(t) sampled at time steps δt. For all
15
time indexesnCWT can be calculated as:
W f(x,s)= NX−1
k=0 ˆ
fkψ¯ˆs(sωk)ei ωknδt, (1)
where (ˆ ) indicates the Fourier transform, k the frequency index and ωk=±2πk Nδt
the angular frequency. For convenience, the scales are written as sj =2δj2 j δj, j
= 20
0, 1,. . .,j.
NPGD
1, 977–997, 2014Precursors of earthquakes in VLF
range observed by DEMETER Satellite
D. K. Sondhiya et al.
Title Page
Abstract Introduction
Conclusions References
Tables Figures
◭ ◮
◭ ◮
Back Close
Full Screen / Esc
Printer-friendly Version
Interactive Discussion
Discussion
P
a
per
|
D
iscussion
P
a
per
|
Discussion
P
a
per
|
Discuss
ion
P
a
per
|
(Markovic and Koch, 2005):
¯
W2n=δjδt Cδ
j=j2 X
j=j1
|W f(x,s)|2
sj , (2)
whereCδ is a scale independent characteristics of the basic function used (Torrence and Compo, 1998). The scale-averaged wavelet power can be viewed as a time series
5
of the average variance in a certain band of scales. The average of the wavelet power over all local wavelet spectra along the time axis is the global wavelet power spectrum (Torrence and Compo, 1998):
¯
W2(s)= 1
N
N−1 X
n=0
|W f(x,s)|2. (3)
10
The wavelet power spectrum and the global wavelet spectrum provide the main fluctuations in power of VLF signals at different scales and over a range of scales at different times.
2.2 Bi-spectral analysis
The fundamental process involves in the development of plasma turbulence and
15
coherent structure is the wave-wave interaction. The classical bi-spectrum is defined as B(ω1,ω2)=hX(ω1)+X(ω2)X∗(ω1+ω2)iwhich measures the degree of phase coupling between the frequency components of observed signal such thatω1+ω2=ω3 where ω3< ωNyquist. The angle brackets denote an ensemble average. It is an indication of quadratic coupling of the modes of the system (Kim and Powers, 1978). The
bi-20
coherence is the normalized amplitude of the bi-spectrum,
b2(ω1,ω2)=
|B(ω1,ω2)|2 h|X(ω1)||X(ω2)||X∗(ω
1+ω2)|i2
NPGD
1, 977–997, 2014Precursors of earthquakes in VLF
range observed by DEMETER Satellite
D. K. Sondhiya et al.
Title Page
Abstract Introduction
Conclusions References
Tables Figures
◭ ◮
◭ ◮
Back Close
Full Screen / Esc
Printer-friendly Version
Interactive Discussion
Discussion
P
a
per
|
D
iscussion
P
a
per
|
Discussion
P
a
per
|
Discuss
ion
P
a
per
|
and takes a valueb2ǫ{0, 1}. The bi-coherence has maxima at frequency pairs which are phase related as ∅(ω1,ω2)=∅(ω1)+∅(ω2)− ∅(ω1+ω2)+∅0 and is zero in the presence of randomly phased Gaussian noise.
Kim and Powers (1978) first time used this method for the study of plasma process. It allows the nonlinear interaction between the wave modes by computing
5
the bispectrum of the signal. It provides information about the phase coherence. A quantitative measure of the phase coherency can be obtained using the incoherence spectrum. The first use of bi-spectral analysis for space plasma was given by Tanaka et al. (1987). Bi-spectrum analysis was applied in the study of nonlinear processes in the magnetospheric cusp and ionospheric electromagnetic turbulence analysis in ULF
10
range (Błecki et al., 2007, 2012).
2.3 Statistical analysis
The Probability Density Functions (PDFs) have been suggested useful to understand the phenomena that occur in any turbulent system involving hydrodynamic (Ramos et al., 2001; Bolzan et al., 2002) or magnetohydrodynamic flows (Burloga and Vinas,
15
2004; Bolzan et al., 2005). These functions indicate whether the phenomenon has random character with PDF that is close to Gaussian or it is intermittent and asymmetric indicating turbulence in the system. The useful parameters to study turbulence are skeweness and kurtosis. The skewness (s) is the third moment of the measured physical value normalized by the variance given as
20
s= h(x−X) 3
i
h(x−X)2i32
, (5)
wherexis the measured value (in our case, the electric field intensity) andX denotes its mean value. The skewness reveals information about the asymmetry of the PDF. Positive skewness indicates that the PDF has a longer tail forx−X >0 than forx−X <
NPGD
1, 977–997, 2014Precursors of earthquakes in VLF
range observed by DEMETER Satellite
D. K. Sondhiya et al.
Title Page
Abstract Introduction
Conclusions References
Tables Figures
◭ ◮
◭ ◮
Back Close
Full Screen / Esc
Printer-friendly Version
Interactive Discussion
Discussion
P
a
per
|
D
iscussion
P
a
per
|
Discussion
P
a
per
|
Discuss
ion
P
a
per
|
0. Hence, a positive skewness means that the variablexis more likely to take on large positive values than large negative values.
The s has been used to investigate the transport asymmetry in hydrodynamics turbulence specifically in Convective Boundary Layer (CBL) in atmosphere (Wyngaard and Weil, 1991). In recent years, there are many works demonstrating the importance
5
of the study of the skewness parameter in magnetohydrodynamics turbulence data obtained in laboratory (Antonov et al., 2000) and experimental sites (Burlaga et al., 2002). The kurtosis (or flatness) is the measure of the intermittency. It is defined as the fourth momentum of the measured physical value normalized by the variance
K= h(x−X) 4
i
h(x−X)2i2. (6)
10
A PDF with longer tails will have a larger kurtosis than a PDF with narrower tails. A time series with most measurements clustered around the mean has low kurtosis, a time series dominated by intermittent extreme events has high kurtosis.
3 Results and discussion 15
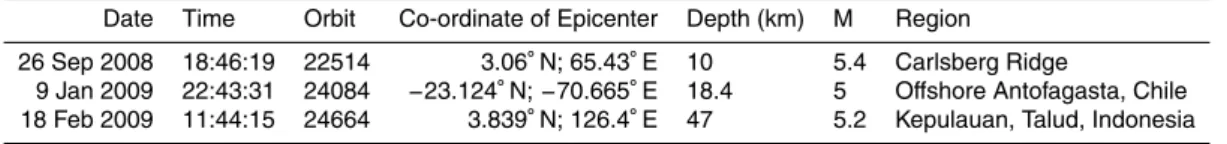
For the analysis of coherent structure and phenomena of intermittence VLF signals have been taken form three different orbits of DEMETER satellite associated with three earthquakes. The characteristics of these earthquakes are given in Table 1.
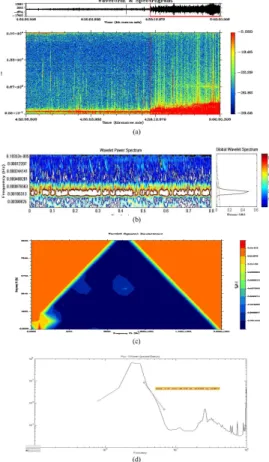
First we have taken the earthquake that occurred on 26 September 2008, at 18:46:19 UT in Carlsberg Ridge Region. It had its epicenter at 3.06◦N and 65.43◦E.
20
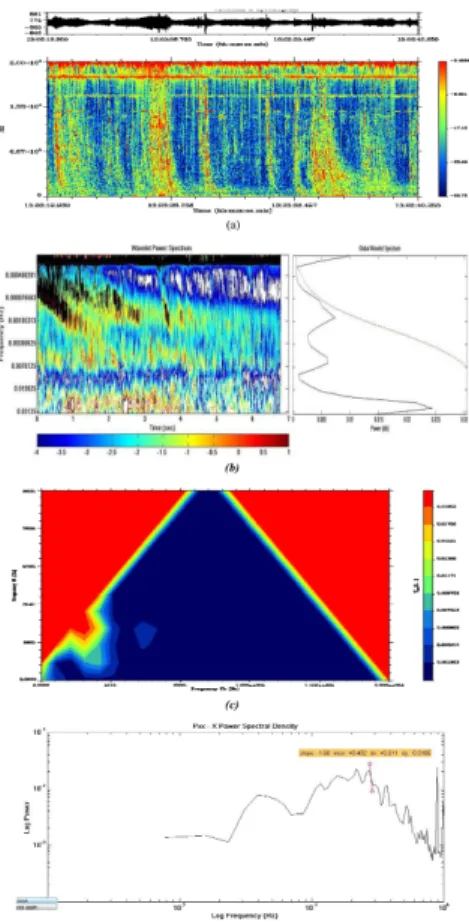
Its depth was 10 km and magnitude wasM=5.4. The closest approach of DEMETER satellite to the epicenter was at 04:25:00 UT on 17 September 2008. The wavelet spectrogram of the electric field waveform in the VLF frequency range up to 20 kHz during a burst mode between 04:33:36 and 05:00:308 UT is presented in Fig. 1a. Figure 1b represents the normalized Wavelet Power Spectrum (right panel) using
25
NPGD
1, 977–997, 2014Precursors of earthquakes in VLF
range observed by DEMETER Satellite
D. K. Sondhiya et al.
Title Page
Abstract Introduction
Conclusions References
Tables Figures
◭ ◮
◭ ◮
Back Close
Full Screen / Esc
Printer-friendly Version
Interactive Discussion
Discussion
P
a
per
|
D
iscussion
P
a
per
|
Discussion
P
a
per
|
Discuss
ion
P
a
per
|
denotes the current time and the y axis denotes the frequencies or periods in the time series; the gray scale bar represents the third dimension of the periodogram, and denotes the energy associated with each frequency or period. It was found that there exists a high power concentration near 0.3×10⁻³Hz and 0.1×10⁻³Hz frequency bands.
5
To test the statistical significance of the global wavelet power spectrum peaks a theoretical red noise spectrum is defined. The AR(1) model is used to simulate this spectrum with autocorrelation factor estimated directly from the signals. After defining the univariate lag-1 auto regressive model, the background spectrum for red noise is multiplied by the 95th percentile value forχ22 to determine the 5 % significance level
10
(95 % confidence level) of the wavelet global spectrum (Torrence and Compo, 1998). The autocorrelation coefficient is calculated as 0.84. It gives a peak at 0.1×10⁻³Hz frequency band. It is not statistically significant because located outside the cone of influence. It is probably due to generation of highly intense electric field due to earthquake generation process.
15
The calculation of bispectrum (Fig. 1c) shows a strong interaction at 0–50 Hz band. Figure 1d shows the example of the single spectrum. The slope of this is about−2.47, which corresponds to the Kolmogorov model of the turbulence.
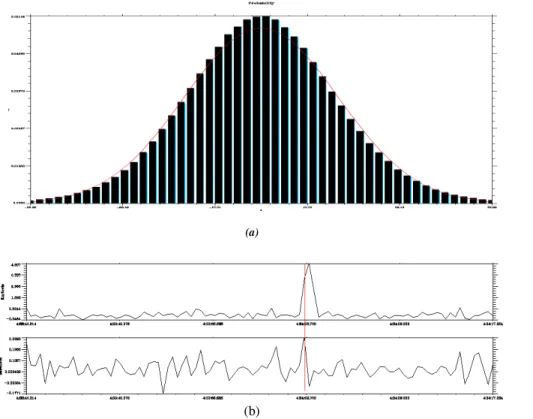
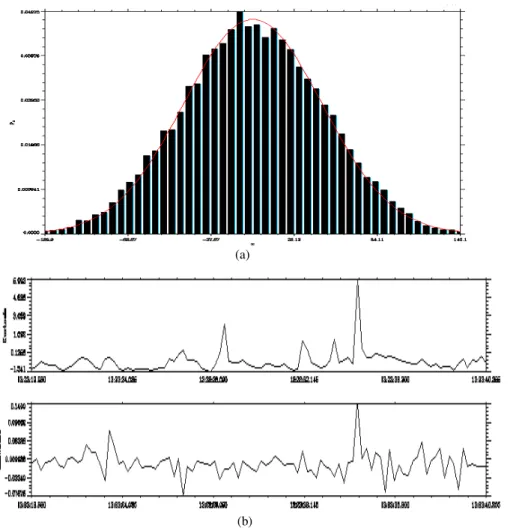
The probability distribution (PDF) curve (Fig. 2a) along with the parameter of the wave distribution as kurtosis and skewness (Fig. 2b) are presented in Fig. 2. It is found
20
that PDF curve shows distortion in relation to a Gaussian distribution. Wave distribution parameter shows strong enhancement at the time of increase wave activity. This shows the intermittent character of the process.
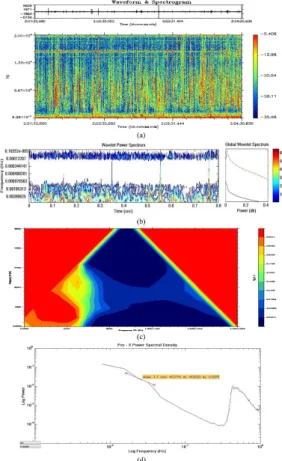
Secondly, we analyzed the VLF signal observed during the earthquake that occurred at Offshore Antofagasta, Chile, on 9 January 2009 with magnitudeM=5. Waveform of
25
NPGD
1, 977–997, 2014Precursors of earthquakes in VLF
range observed by DEMETER Satellite
D. K. Sondhiya et al.
Title Page
Abstract Introduction
Conclusions References
Tables Figures
◭ ◮
◭ ◮
Back Close
Full Screen / Esc
Printer-friendly Version
Interactive Discussion
Discussion
P
a
per
|
D
iscussion
P
a
per
|
Discussion
P
a
per
|
Discuss
ion
P
a
per
|
A clear picture of the turbulent cascade is seen in the lower part of bispectrum illustrated in Fig. 3c. The cascade of the energy appears in the figure as an elongated “red island” parallel to the horizontal frequency axis, from 800 Hz up to 4800 Hz. The energy from the lower frequency was transferred to the higher frequency during the development of the turbulence. Figure 3d shows a single spectrum and again the slope
5
of 1.7 indicates the developed Kolmogorov type of the turbulence.
Figure 4a shows the PDF and the distortion of this plot can be seen in relation to a Gaussian distribution. The parameters of the distribution, as kurtosis and skewness are presented in Fig. 4b. Strong enhancements of these moments were seen at the time of the increase in wave activity.
10
As the third example, we analyzed the waveform of electric field observed by DEMETER satellite (orbit 24664) on 18 February 2009 at 18:28 UT over the Kepulauan (3.839◦N, 126.4◦S), Talud, Indonesia, during earthquake (M=5.2) and is shown in Fig. 5a. The Spectrogram shown in Fig. 5b indicates emissions in the VLF range upto 20 kHz which appears to be tweeks or short duration whistlers. The straight
15
line around 19.2 kHz seems to be the signal from VTX3 transmitter located at South Vijaynarayanam, India. Figure 5b presents the normalized wavelet power spectrum with its global wavelet power spectrum of observed VLF signal. It is found that there exists a high wavelet power concentration near the frequency range from 0.15 up to 0.03 Hz showing the clear picture of turbulence. That is the region where
20
whistlers are particularly enhanced up to highest frequency. It also shows transfer of energy from the lower frequency to higher frequency range during the development of turbulence. The combination of both positive and negative peaks into a single broad peak represents the non-stationary present near the higher frequency bands, which can be attributed to various plasmasphere effect generated due to earthquake
25
NPGD
1, 977–997, 2014Precursors of earthquakes in VLF
range observed by DEMETER Satellite
D. K. Sondhiya et al.
Title Page
Abstract Introduction
Conclusions References
Tables Figures
◭ ◮
◭ ◮
Back Close
Full Screen / Esc
Printer-friendly Version
Interactive Discussion
Discussion
P
a
per
|
D
iscussion
P
a
per
|
Discussion
P
a
per
|
Discuss
ion
P
a
per
|
waves, plasmaspheric hiss, lightning-generated whistlers, magnetosonic waves and electromagnetic ion cyclotron waves.
The bispectrum for this disturbance is illustrated in Fig. 5c. It indicates a strong significant 3-wave interaction that is clearly seen in the frequency range of 2694 Hz– 3456 Hz. Figure 5d shows the example of the single spectrum with a slope of about
5
1.68, which corresponds to the Kolmogorov model of the turbulence.
The probability distribution function curve along with the parameters of the wave distribution as kurtosis and skewness are presented in Fig. 6, which show strong enhancement of these moments at the time of increased wave activity.
4 Summary
10
In this work detailed analysis of electromagnetic wave data observed by the DEMETER satellite prior to the three different earthquakes has been presented. Wavelet and Bispectral techniques based analysis shows many significant effect in the ionosphere few days before the earthquake. Large value of kurtosis shows the higher level of intermittence in the VLF signal before earthquake. It is possible to conjecture that the
15
sources of this intermittence are the coherent structures. Large values of the kurtosis have also been estimated in strongly non-Gaussian probability density functions which are consisted with earlier studies (Hussian, 1983; Kinney and Mc William, 1995; Ramos, 2001; Bolzan, 2002, 2005; Hnat et al., 2003). For the better understanding of this behavior skewness parameter has been estimated. In general, the kurtosis
20
and skewness parameters have shown the same behavior according to results of Burgala and Forman, (2002). The enhanced value of skewness is due to the presence of the coherent structures in the transients. The high energy at the large scales of the VLF turbulence due the earthquake preparation process indicated the generation of coherent structures in the VLF signal. The coherent VLF signals propagating in
25
NPGD
1, 977–997, 2014Precursors of earthquakes in VLF
range observed by DEMETER Satellite
D. K. Sondhiya et al.
Title Page
Abstract Introduction
Conclusions References
Tables Figures
◭ ◮
◭ ◮
Back Close
Full Screen / Esc
Printer-friendly Version
Interactive Discussion
Discussion
P
a
per
|
D
iscussion
P
a
per
|
Discussion
P
a
per
|
Discuss
ion
P
a
per
|
wave growth takes place as predicted by established theories (Nunn, 1997; Nunn et al., 2005). The resulting pitch angle diffusion of particles produces a more stable configuration in which the steep gradient is reduced towards that corresponding to the marginally stable distribution (Kennel, 1996; Artemyev et al., 2013). For initially positive gradients in the energetic electron distribution function with respect to parallel velocity,
5
wave growth takes place above the frequency of the causative coherent signal. The theory predicts that the bandwidth of emissions triggered in this way should rapidly increase with time and may reach maximum widths of several hundred Hz (Matthews, 1985).
Acknowledgements. D. K. Sondhiya is thankful to the University Grant Commission, New Delhi
10
(India) for providing financial support through Special Assistance Program (SAP).
References
Antonov, N. V., Lanotte, A., and Mazzino, A.: Persistence of small-scale anisotropies and anomalous scaling in a model of magnetohydrodynamics turbulence, Phys. Rev. E, 61, 6586– 6605, doi:10.1103/PhysRevE.61.6586, 2000.
15
Artemyev, A. V., Orlova, K. G., Mourenas, D., Agapitov, O. V., and Krasnoselskikh, V. V.: Electron pitch-angle diffusion: resonant scattering by waves vs. nonadiabatic effects, Ann. Geophys., 31, 1485–1490, doi:10.5194/angeo-31-1485-2013, 2013.
Błecki, J., Savin, S., Parrot, M., and Wronowski, R.: Nonlinear interactions of the low frequency plasma waves in the middle-altitude polar cusp as observed by Prognoz-8, Interball-1 and
20
cluster satellites, Acta Geophys., 55, 459–468, 2007.
Błecki, J., Parrot, M., and Wronowski, R.: Can the ionospheric plasma turbulence be a precursor of the earthquake?, Results of DEMETER measurements, in: Proceedings of ESA Swarm Science Workshop, 24–26 Potsdam, 2009.
Błecki, J., Kos’ciesza, M., Parrot, M., Savin, S., and Wronowski, R.: Extremely low frequency
25
NPGD
1, 977–997, 2014Precursors of earthquakes in VLF
range observed by DEMETER Satellite
D. K. Sondhiya et al.
Title Page
Abstract Introduction
Conclusions References
Tables Figures
◭ ◮
◭ ◮
Back Close
Full Screen / Esc
Printer-friendly Version
Interactive Discussion
Discussion
P
a
per
|
D
iscussion
P
a
per
|
Discussion
P
a
per
|
Discuss
ion
P
a
per
|
Bolzan, M. J. A., Ramos, F. M., Sá, L. D. A., Rodrigues Neto, C., and Rosa, R. R.: Analysis of fine-scale canopy turbulence within and above an Amazon forest using Tsallis’ generalized thermostatistics, J. Geophys. Res., 107, 8063, doi:10.1029/2001JD000378, 2002.
Bolzan, M. J. A., Sahai, Y., Fagundes, P. R., Rosa, R. R., Ramos, F. M., and Abalde, J. R.: Intermitency analysis of geomagnetic storm time-series observed in Brazil, J. Atmos.
Sol.-5
Terr. Phys., 67, 1365–1372, doi:10.1016/j.jastp.2005.06.008, 2005.
Boskova, J., Smilauer, J., Tıska, P., and Kudela, K.: Anomalous behavior of plasma parameters as observed by the intercosmos 24satellite prior to the Iranian earthquake of 20 June 1990, Stud. Geophys. Geod., 38, 213–220, 1994.
Burlaga, L. F. and F.-Viñas. A.: Multi-scale probability distributions of solar wind speed
10
fluctuations at 1 AU described by a generalized Tsallis distribution, Geophys. Res. Lett., 31, L16807, doi:10.1029/2004GL020715, 2004.
Burlaga, L. F., Plunkett, S. P., and St. Cyr, O. C.: Successive CMEs and complex ejecta, J. Geophys. Res., 107, SSH1-3–SSH1-12, doi:10.1029/2001JA00255, 2002.
Farge, M.: Wavelet transforms and their applications to turbulence, Annu. Rev. Fluid Mech., 24,
15
395–457, 1992.
Farge, M., Evlahan, K., Perrier, N. V., and Goirand, E.: Wavelets and turbulence, in: Special issue on wavelets, Proceedings of the IEEE, edited by: Daubechies, J. and Kovasevic, J., 84, 639–669, 1996.
Frisch, U.: The Legacy of A. N. Kolmogorov, Cambridge University Press, Cambridge, UK,
20
1995.
Fuzinawa, Y. and Takahashi, K.: Electromagnetic radiations associated with major earthquakes, 105, 249–259, doi:10.1016/S0031-9201(97)00117, 1998.
Hayakawa, M. (Ed.): Atmospheric and Ionospheric Electromagnetic Phenomena Associated with Earthquakes, Terrapub, Tokyo, 1999.
25
Hayakawa, M., Molchanov, O. A., and NASDA/UEC team: Achievements of NASDA’s earthquake remote sensing frontier project, Terrestrial, Atmospheric and Oceanic Sciences, 15, 311–327, 2004.
He, Y. F., Yang, D. M., Chen, H. R., Qian, J. P., Zhu, R. J., and Parrot, M.: SNR changes of VLF radio signals detected onboard the DEMETER satellite and their possible
30
NPGD
1, 977–997, 2014Precursors of earthquakes in VLF
range observed by DEMETER Satellite
D. K. Sondhiya et al.
Title Page
Abstract Introduction
Conclusions References
Tables Figures
◭ ◮
◭ ◮
Back Close
Full Screen / Esc
Printer-friendly Version
Interactive Discussion
Discussion
P
a
per
|
D
iscussion
P
a
per
|
Discussion
P
a
per
|
Discuss
ion
P
a
per
|
Hnat, B., Chapman, S. C., and Rowlands. G.: Intermitency, scalingand the Fokker–Planck approach to fluctuations of the solar wind bulk plasma parameters as seen by wind, Phys. Rev. E, 67, 056404, doi:10.1103/PhysRevE.67.056404, 2003.
Hussain, A. K. M. F.: Coherent structure-reality and myth, Phys. Fluids, 26, 2816, doi:10.1063/1.864048, 1983.
5
Karakelian, D., Klemperer, S. L., Fraser-Smith, A. C., and Beroza, G. C.: A transportable system for monitoring ultra low frequency electromagnetic signals associated with earthquakes, Seismol. Res. Lett., 71, 423–436, 2000.
Kennel, C. F. and Petschek, H. E.: Limit on stably trapped particle fluxes, J. Geophys. Res., 71, 1–28, doi:10.1029/JZ071i001p00001, 1966.
10
Kim, Y. C. and Powers, E. J.: Digital bispectral analysis of self-excited fluctuation spectra, Phys. Fluids, 21, 1452–1453, 1978.
Kinney, R. and McWilliams, J. C.: Coherent structures and turbulent cascades in twodimensional incompressible magnetohydrodynamic turbulence, Phys. Plasmas, 2, 3623– 3639, 1995.
15
Mallat, S. A.: Wavelet Tour of Signal Processing, Academic Press, San Diego, 1998.
Markovic, D., and Koch, M.: Wavelet and scaling analysis of monthly precipitation extremes in Germany in the 20th century: inter annual to inter decadal oscillations and the North Atlantic Oscillation influence, Water Resour. Res., 41, W09420, doi:10.1029/2004WR003843, 2005. Matthews, J. P.: A theory of diffuse emission bursts triggered by coherent VLF signals
20
propagating parallel to the geomagnetic field, J. Geophys. Res., 90, 2910–2914, 1985. McComb, W. D.: The Physics of Fluid Turbulence, Clarendon press, Oxford, 1990.
Molchanov, O. A.: On the origin of low- and middlelatitude ionospheric turbulence, Phys. Chem. Earth, 29, 559–567, 2004.
Nagao, T., Enomoto, Y., Fujinawa, Y., Hata, M., Hayakawa, M., Huang, Q., Izutsu, I., Kushida, Y.,
25
Maeda, K., Oike, K., Uyeda, S., and Yoshino, T.: Electromagnetic anomalies associated with 1995 KOBE earthquake, J. Geodyn., 33, 401–411, 2002.
Nunn, D., Omura, Y., Matsumoto, H., and Yagitni, N. S.: The numerical simulation of VLF chorus and discrete emissions observed on the Geotail satellite using a Vlasov code, J. Geophys. Res., 102, 27083–27097, 1997.
30
Nunn, D., Rycroft, M., and Trakhtengerts, V.: A parametric study of the numerical simulations of triggered VLFemissions, Ann. Geophys., 23, 1–12, 2005,
NPGD
1, 977–997, 2014Precursors of earthquakes in VLF
range observed by DEMETER Satellite
D. K. Sondhiya et al.
Title Page
Abstract Introduction
Conclusions References
Tables Figures
◭ ◮
◭ ◮
Back Close
Full Screen / Esc
Printer-friendly Version
Interactive Discussion
Discussion
P
a
per
|
D
iscussion
P
a
per
|
Discussion
P
a
per
|
Discuss
ion
P
a
per
|
Pulinets, S. and Boyarchuk, K.: Ionospheric Precursors of Earthquakes, Springer, Berlin, 2004. Ramos, F. M., Rosa, R. R., Neto, R. R., Bolzan, M. J. A., and S’a L. D. A.: Non-extensive
statistics and three-dimensional fully developed turbulence, Physica A, 295, 250–253, 2001. Sorokin, V. M.: Plasma and electromagnetic effects in the ionosphere related to the dynamics
of charged aerosols in the lower atmosphere, R. J. Phys. Chem. B, 1, 138–170, 2007.
5
Sorokin, V. and Hayakawa, M.: Generation of seismic related DC electric fields and lithosphere–atmosphere-ionosphere coupling, Modern Applied Science, 7, 1–25, doi:10.5539/mas.v7n6p1, 2013.
Tanaka, Y., Lagoutte, D., Hayakawa, M., and Lefeuvre, F.: Spectral broadening of VLF transmitter signalsand sideband structure observed on Aureol-3 satelliteat middle latitudes, J.
10
Geophys. Res., 92, 7551–7559, 1987.
Torrence, C. and Compo, G. P.: A practical guide to wavelet analysis, B. Am. Meteorol. Soc., 79, 61–78, 1998.
Wernik, A. W.: High-latitude ionospheric plasma turbulence: advanced analysis methods and results, Acta Geophysica Polonica, 50, 119–134, 2002.
15
Wernik, A. W.: Application of the wavelet transform to investigation of space plasma turbulence, in: Proceedings of the International Workshop on Applications of Wavelets to Real World Problems, Istanbul, Turkey, 17–18 July, edited by: Hasan Siddiqi, A., Alsan, S., Rasulov, M., Oguz, O., and Aslan, A., 49–66, 2005.
Wyngaard, J. C. and Weil, J. C.: Transport asymmetry in skewed turbulence, J. C. Phys.
20
Fluids A-Fluid, 3, 155, doi:10.1063/1.857874, 1991.
NPGD
1, 977–997, 2014Precursors of earthquakes in VLF
range observed by DEMETER Satellite
D. K. Sondhiya et al.
Title Page
Abstract Introduction
Conclusions References
Tables Figures
◭ ◮
◭ ◮
Back Close
Full Screen / Esc
Printer-friendly Version
Interactive Discussion
Discussion
P
a
per
|
D
iscussion
P
a
per
|
Discussion
P
a
per
|
Discuss
ion
P
a
per
|
Table 1.Characteristics of Earthquakes.
Date Time Orbit Co-ordinate of Epicenter Depth (km) M Region
26 Sep 2008 18:46:19 22514 3.06◦N; 65.43◦E 10 5.4 Carlsberg Ridge
NPGD
1, 977–997, 2014Precursors of earthquakes in VLF
range observed by DEMETER Satellite
D. K. Sondhiya et al.
Title Page
Abstract Introduction
Conclusions References
Tables Figures
◭ ◮
◭ ◮
Back Close
Full Screen / Esc
Printer-friendly Version
Interactive Discussion
Discussion
P
a
per
|
D
iscussion
P
a
per
|
Discussion
P
a
per
|
Discuss
ion
P
a
per
|
Fig. 1. (a)Waveform and spectrogram of VLF signal (Orbit-22514, Date – 17 September 2008)
NPGD
1, 977–997, 2014Precursors of earthquakes in VLF
range observed by DEMETER Satellite
D. K. Sondhiya et al.
Title Page
Abstract Introduction
Conclusions References
Tables Figures
◭ ◮
◭ ◮
Back Close
Full Screen / Esc
Printer-friendly Version
Interactive Discussion
Discussion
P
a
per
|
D
iscussion
P
a
per
|
Discussion
P
a
per
|
Discuss
ion
P
a
per
|
(a)
(b)
−
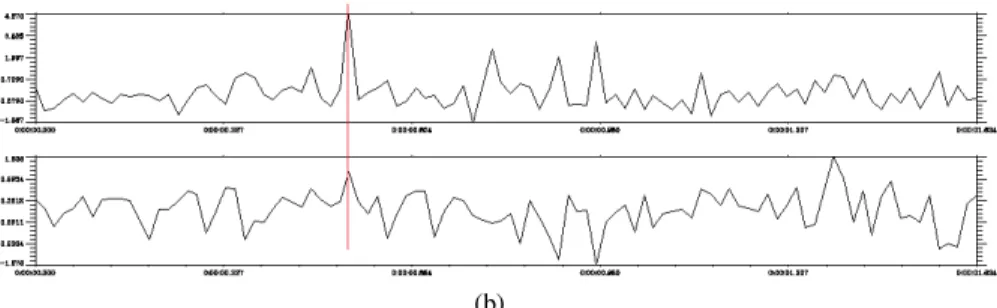
Fig. 2. (a) Probability distribution function, (b) moments evolution curves for kurtosis and
skweness.
NPGD
1, 977–997, 2014Precursors of earthquakes in VLF
range observed by DEMETER Satellite
D. K. Sondhiya et al.
Title Page
Abstract Introduction
Conclusions References
Tables Figures
◭ ◮
◭ ◮
Back Close
Full Screen / Esc
Printer-friendly Version
Interactive Discussion
Discussion
P
a
per
|
D
iscussion
P
a
per
|
Discussion
P
a
per
|
Discuss
ion
P
a
per
|
Fig. 3. (a)Waveform and spectrogram of in VLF frequency range using SWAN. (Orbit-24084,
NPGD
1, 977–997, 2014Precursors of earthquakes in VLF
range observed by DEMETER Satellite
D. K. Sondhiya et al.
Title Page
Abstract Introduction
Conclusions References
Tables Figures
◭ ◮
◭ ◮
Back Close
Full Screen / Esc
Printer-friendly Version
Interactive Discussion
Discussion
P
a
per
|
D
iscussion
P
a
per
|
Discussion
P
a
per
|
Discuss
ion
P
a
per
|
(b)
Fig. 4(a) Probability distribution function (b) Moments evolution curves for Kurtosis and skweness
Fig. 4. (a) Probability distribution function, (b) moments evolution curves for kurtosis and
NPGD
1, 977–997, 2014Precursors of earthquakes in VLF
range observed by DEMETER Satellite
D. K. Sondhiya et al.
Title Page
Abstract Introduction
Conclusions References
Tables Figures
◭ ◮
◭ ◮
Back Close
Full Screen / Esc
Printer-friendly Version
Interactive Discussion
Discussion
P
a
per
|
D
iscussion
P
a
per
|
Discussion
P
a
per
|
Discuss
ion
P
a
per
|
Fig. 5. (a)Waveform and spectrogram of in VLF frequency range using SWAN. (Orbit-24664,
NPGD
1, 977–997, 2014Precursors of earthquakes in VLF
range observed by DEMETER Satellite
D. K. Sondhiya et al.
Title Page
Abstract Introduction
Conclusions References
Tables Figures
◭ ◮
◭ ◮
Back Close
Full Screen / Esc
Printer-friendly Version
Interactive Discussion
Discussion
P
a
per
|
D
iscussion
P
a
per
|
Discussion
P
a
per
|
Discuss
ion
P
a
per
|
279
(a)
(b)
Fig. 6. (a) Probability distribution function, (b) moments evolution curves for kurtosis and