Vol.6, No. 1, 2012 71 International Journal for Quality research
UDK - 658.5:005
Original Scientific Paper (1.01)
Golam Kabir1)
1) Bangladesh University of Engineering and Technology
(BUET), Bangladesh
THIRD PARTY LOGISTIC SERVICE PROVIDER SELECTION USING FUZZY AHP AND TOPSIS METHOD
Abstract: The use of third party logistic (3PL) services providers is increasing globally to accomplish the strategic objectives. In the increasingly competitive environment, logistics strategic management requires systematic and structured approach to have cutting edge over the rival. Logistics service provider selection is a complex multi-criteria decision making process; in which, decision makers have to deals with the optimization of conflicting objectives such as quality, cost, and delivery time. In this paper, fuzzy analytic hierarchy process (FAHP) approach based on technique for order preference by similarity to ideal solution (TOPSIS) method has been proposed for evaluating and selecting an appropriate logistics service provider, where the ratings of each alternative and importance weight of each criterion are expressed in triangular fuzzy numbers.
Keywords: FAHP, Logistics service provider selection, TOPSIS technique, 3PL
1. INTRODUCTION
The continued growth across the globe is leading, the business development, whereas, information technology (IT) and freedom from licensing has given rise to globalization. Globalization of business has been considered, the driving force for outsourcing by many researchers (Foster and Muller 1990) as the most influential. The logistics service provider selection is a complex multi-criteria problem that includes both quantitative and qualitative criteria some of which can conflict each other and is vital in enhancing the competitiveness of companies (Çakır 2009; Güner 2005). While choosing the appropriate provider, logistics managers might be uncertain whether the selection will satisfy completely the needs of the organization Bevilacqua and Petroni (2002). Verma and Pulman (1998) examined the difference between managers' ratings of the perceived importance of different supplier attributes and their actual choice of suppliers in an experimental setting. They used two methods: a Likert scale set of questions and a discrete choice analysis (DCA) experiment. Ghodsypour and O‟Brien (1998) proposed an integration of analytical hierarchy process (AHP) and linear programming to consider both tangible and intangible factors for choosing the best suppliers and placing the optimum order quantities among them such that the total value of purchasing becomes maximum.
Analytical Hierarchy Process provides the objective mathematics to process the intuitive, rational, irrational factors and personal preference of the individual or a group in making a decision. The strength of the AHP lies in its ability of structuring complex, multi-person and multi-attribute problems hierarchically and investigating each level of the hierarchy separately
combining the results. Bevilacqua and Petroni (2002) developed a system for supplier selection using fuzzy logic (FL). FL; which was introduced by Zadeh (1965) with his pioneer work “Fuzzy Sets”, can simply be defined as “a form of mathematical logic in which truth can assume a continuum of values between 0 and 1”. As fuzzy set theory became an important problem modeling and solution technique due to its ability of modeling problems quantitatively and qualitatively those involve vagueness and imprecision (Kahraman 2006), it has been successfully applied many disciplines such as control systems, decision making, pattern recognition, system modeling and etc. in fields of scientific researches as well as industrial and military applications. Kahraman et al. (2003) used fuzzy AHP (FAHP) to select the best supplier firm for a white good manufacturer established in Turkey providing the most satisfaction. Xia and Wu (2007) proposed an integrated approach of AHP (improved by rough sets theory and multi-objective mixed integer programming) to simultaneously determine the number of suppliers for employing and the order quantity allocated to these suppliers in the case of multiple sourcing, multiple products with multiple criteria and supplier‟s capacity constraints.
72 G. Kabir appropriate logistics service provider selection
decisions. Finally, discussions are provided in section 4.
2.FUZZY SETS THEORY AND TOPSIS METHOD
Fuzzy set theory
Zadeh (1965) came out with the fuzzy set theory to µM
1
deal with vagueness and uncertainty in decision making in order to enhance precision. Thus the vague data may be represented using fuzzy numbers, which can be further subjected to mathematical operation in fuzzy domain. Thus fuzzy numbers can be represented by its membership grade ranging between 0 and 1. A triangular fuzzy number (TFN) M◻◻◻ is shown in Figure 1 (Kabir and Hasin 2011).
Ml(y) Ml(r)
M
O
l m u
Figure 1.
A TFN is denoted simply as (l/m, m/u) or (l, m, u), represents the smallest possible value, the most promising value and the largest possible value
0,
respectively. The TFN having linear representation on left and right side can be defined in terms of its membership function as:
x < l,
µ
(x\M
◻
)
(x-l) / (m-l),
(u-x) / (u-m),
0,
l
≤
x
≤
m
m
≤
x
≤
u,
x > u,
(1) A fuzzy number with its corresponding left and
right representation of each degree of membership is as below:
M◻= ( Ml(y), Ml(r) ) = ( l+(m-l) y, u+(m-u) y ), y
ε[0,1] (2)
where l(y) and l(r) denotes the left side representation and the right side representation of a fuzzy number respectively (Kabir 2011).
The fuzzy summation
⊕
and fuzzy subtraction Θ of any two TFN are also TFNs, but the multiplication⊗
of any two TFNs is only approximate TFNs. The data can be assessed using Table 1, which shows the linguistics scale along with corresponding triangular fuzzy scale.Table 1: Triangular fuzzy conversion scale
Linguistic Scale Triangular Fuzzy Scale Triangular Fuzzy Reciprocal Scale
Just equal 1, 1, 1 1, 1, 1
Equally important 1/2, 1, 3/2 2/3, 1, 2
Weakly important 1, 3/2, 2 1/2, 2/3, 1
Strongly more important 3/2, 2, 5/2 2/5, 1/2, 2/3
Very strongly more important 2, 5/2, 3 1/3, 2/5, 1/2
Absolutely more important 5/2, 3, 7/2 2/7, 1/3, 2/5
Vol.6, No. 1, 2012 73 a −
othe
0
b
i
gi
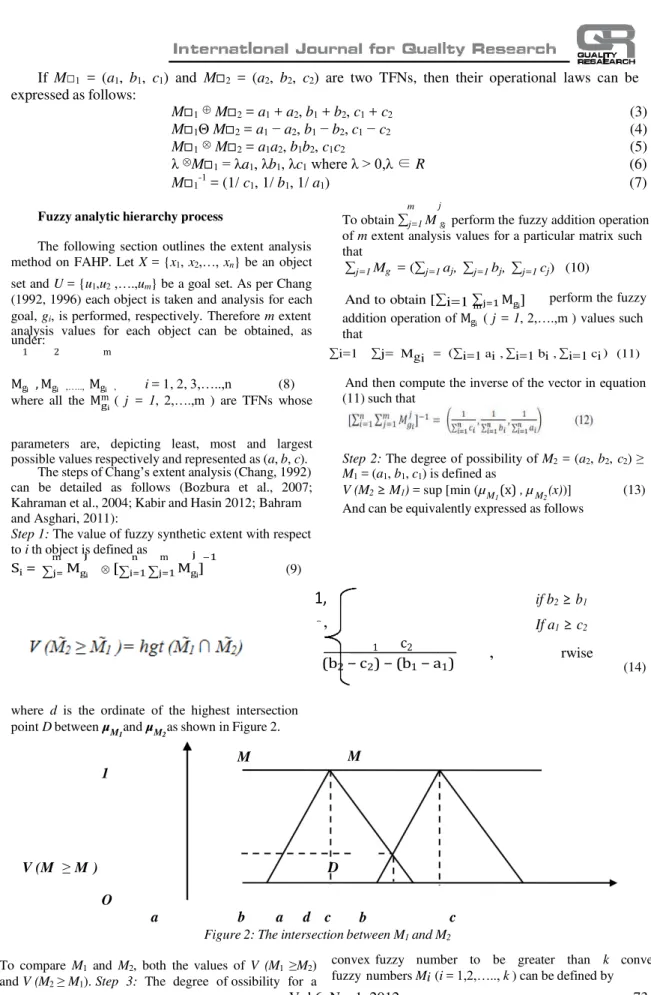
If M□1 = (a1, b1, c1) and M◻2 = (a2, b2, c2) are two TFNs, then their operational laws can be expressed as follows:
M◻1
⊕
M◻2 = a1 + a2, b1 + b2, c1 + c2 (3) M◻1ΘM◻2 = a1 − a2, b1 −b2, c1 − c2 (4)M◻1
⊗
M◻2 = a1a2, b1b2, c1c2 (5)λ
⊗
M◻1 = λa1, λb1, λc1 where λ> 0,λ∈R (6)M◻1-1 = (1/ c1, 1/ b1, 1/ a1) (7)
m j
Fuzzy analytic hierarchy process
The following section outlines the extent analysis method on FAHP. Let X = {x1, x2,…,xn} be an object
To obtain ∑j=1 M g perform the fuzzy addition operation of m extent analysis values for a particular matrix such that
∑j=1 Mg = (∑j=1 aj, ∑j=1 bj, ∑j=1 cj) (10) set and U = {u1,u2 ,….,um} be a goal set. As per Chang
(1992, 1996) each object is taken and analysis for each And to obtain [∑i=1 ∑m j=1 Mgi ] perform the fuzzy
goal, gi, is performed, respectively. Therefore m extent analysis values for each object can be obtained, as under:
addition operation of Mgi ( j = 1, 2,….,m ) values such
that
1 2 m ∑i=1 ∑j= Mgi = (∑i=1 ai , ∑i=1 bi , ∑i=1 ci ) (11)
Mgi , Mgi ,….., Mgi , i = 1, 2, 3,…..,n (8)
where all the Mm ( j = 1, 2,….,m ) are TFNs whose
And then compute the inverse of the vector in equation (11) such that
parameters are, depicting least, most and largest possible values respectively and represented as (a, b, c).
The steps of Chang‟s extent analysis (Chang, 1992) can be detailed as follows (Bozbura et al., 2007; Kahraman et al., 2004; Kabir and Hasin 2012; Bahram and Asghari, 2011):
Step 1: The value of fuzzy synthetic extent with respect to i th object is defined as
Step 2: The degree of possibility of M2 = (a2, b2, c2) ≥ M1 = (a1, b1, c1) is defined as
V (M2 ≥M1) = sup [min (µM
1 (x) , µ M2 (x))] (13) And can be equivalently expressed as follows
m j n m j –1
Si = ∑j= Mgi
⊗
[∑i=1 ∑j=1 Mgi ] (9)1,
,
if b2 ≥b1
If a1 ≥ c2
1 c2
,
(b2 − c2) − (b1 − a1)
rwise
(14)
where d is the ordinate of the highest intersection point D between µM1 and µM2 as shown in Figure 2.
M M
1
V (M ≥ M ) D
O
a b a d c c
Figure 2: The intersection between M1 and M2
To compare M1 and M2, both the values of V (M1 ≥M2) and V (M2 ≥ M1). Step 3: The degree of ossibility for a
74 G. Kabir
*
* * V (M ≥M1, M2,…., Mk) = V[(M ≥M1) and (M ≥M2
) and … (M ≥Mk)] (15) = min V (M ≥Mi), (i = 1, 2, 3 ,…., k)
Assuming that
d' (Ai) = min V (Si ≥Sk) (16) for k = 1, 2, 3,…., n; k ≠i. Then the weight vector is given by
W' = ( d' (A1), d' (A2),….., d' (An))T (17) where Ai =(i = 1,2,3,…n) are n elements
Step 4: By normalizing, the normalized weight vectors are
W = ( d (A1), d (A2),….., d (An))T (18) where W is a non-fuzzy number.
TOPSIS Method
Positive Ideal solution:
A* = { v1* , …, vn*}, where vj* ={ max (vij) if j J ; min (vij) if j J' } (21)
Negative ideal solution:
A' = { v1' , …, vn' }, where v' = { min (vij) if j J ; max (vij) if j J' } (22)
Step 4: Calculate the separation measures for each alternative.
The separation from the ideal alternative is: Di * = [ (vj*– vij)2 ] ½ i = 1, …, m (23) Similarly, the separation from the negative ideal alternative is:
D'i = [ (vj' – vij)2 ] ½ i = 1, …, m (24) Step 5: Calculate the relative closeness to the ideal solution CCi
CCi* = S'i / (Si* +S'i ), 0 CCi 1 (25) TOPSIS (Technique for Order Preference by Step 6: By comparing CCi values, the ranking of Similarity to Ideal Solution) is one of the useful Multi
Attribute Decision Making techniques that are very simple and easy to implement, so that it is used when the user prefers a simpler weighting approach. On the other hand, the AHP approach provides a decision hierarchy and requires pairwise comparison among criteria. The user needs a more detailed knowledge about the criteria in the decision hierarchy to make informed decisions in using the AHP (Lee 2001). TOPSIS method was firstly proposed by Hwang and Yoon (1981). According to this technique, the best alternative would be the one that is nearest to the positive ideal solution and farthest from the negative ideal solution (Benitez et al. 2007). The positive ideal solution is a solution that maximizes the benefit criteria and minimizes the cost criteria, whereas the negative ideal solution maximizes the cost criteria and minimizes the benefit criteria (Wang and Elhag 2006; Wang and Lee 2007). In other words, the positive ideal solution is composed of all best values attainable of criteria, whereas the negative ideal solution consists of all worst values attainable of criteria (Ertuğrul and Karakasoğlu 2009; Stank et al., 1998). In this study, TOPSIS method is used for determining the final ranking of the logistics service providers. The method is calculated as follows:
Step 1: Construct normalized decision matrix. This step transforms various attribute dimensions into non-dimensional attributes, which allows comparisons across criteria. Normalize scores or data as follows:
rij = xij / (x2ij)1/2 for i = 1, …, m; j = 1, …, n (19) Step 2: Construct the weighted normalized decision matrix.
Assume we have a set of weights for each criteria wj for j = 1,…n. Multiply each column of the normalized decision matrix by its associated weight. An element of the new matrix is:
vij = wj rij , for i = 1, …, m; j = 1, …, n(20)
Step 3: Determine the positive ideal and negative ideal solutions.
alternatives are determined.
3. EMPIRICAL STUDY
The application of the fuzzy AHP approach and TOPSIS method is demonstrated for a medium-sized and growth-oriented fast-moving-consumer-goods (FMCG) company, which is steadily moving towards IT enablement of its supply chain (Spencer et al., 1994; Kalpande et al., 2010). It has partially outsourced its outbound logistics to carrying and forwarding agents. The company is willing to outsource its entire logistics activities. The goal is to choose the best logistics service provider for a case company. So, this goal is placed at the top of the hierarchy. The hierarchy descends from the more general criteria in the second level to the alternatives at the bottom level.
Based on the extensive literature survey, various logistics criteria or factors have been identified, however looking to the requirement of the present case study decision-makers (DMs) restricted them to six only, they are identified as compatibility, financial stability, flexibility, operational performance, quality management and reputation of the 3PL services provider. These criteria have been discussed in brief.
Compatibility is very important as it enables the user and the provider to work together. Bowersox and Daugherty (1990) identify compatibility of culture and values, as one of the keys to successful partnership which can result in long-term relationship. As per empirical study of Boyson et al. (1999) compatibility with company culture and philosophy attribute, was ranked second in the degree of importance.
Similarly financial stability plays an important role in order management. As per Bowersox and Daugherty (1990) financially sound 3PL services provider boosts customer satisfaction and reduces cost through a dedicated resource base, it also reduces logistical risks for partnering firm.
Vol.6, No. 1, 2012 75 potential criteria for a 3PL services providers, it can pull
customers (1998) hence becomes shippers‟ obvious choice. Flexibility in services plays an important role in rapidly changing customers‟ need and market scenario. 3PL services provider may foster the shippers‟ ambitious plan of meeting the customers‟ fast changing need in real time through flexibility in services, thus, it entails an important criterion needed for the 3PL services providers.
Operational performance indicates IT capability, size and quality of fixed assets, delivery performance level, employee satisfaction level etc. Size and quality of fixed assets help the 3PL services providers to discharge their duties efficiently. The availability of the appropriate physical equipment their size and the quality must be assessed before selecting 3PL services providers. Hum (2000) called for the strategic logistics capabilities in order to have strategic positioning of 3PL services providers and further emphasized to nurture the in-house resources and expertise (intellectual assets).
Quality management infuses innovativeness and responsiveness in the system to guarantee high service level. 3PL services provider is attributed to increase the customer satisfaction by timely delivering and maintaining the commitment of high service level. The ability to provide quantitatively measurable performance is among the most important criteria when choosing a provider (1994).
Reputation of the 3PL services provider plays an important role in highlighting its selection. Reputation also helps to build the customer relationship which boosts the long-term business.
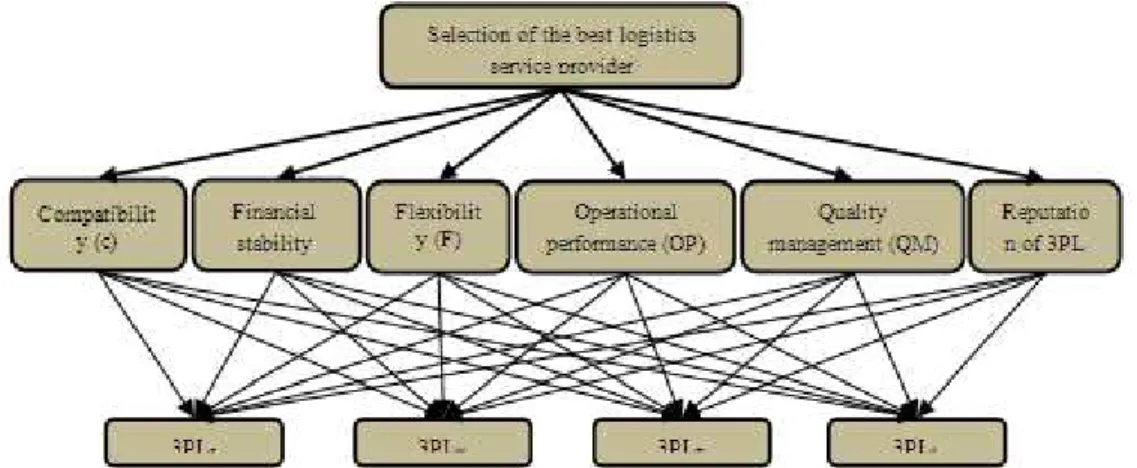
Four logistics service providers are considered for the decision alternatives, and located them on the bottom level of the hierarchy. These are 3PLS, 3PLK, 3PLT and 3PLL, where S, K T & L indicates the first letter of the respective logistic services provider. Figure 3 illustrates a hierarchical representation of selecting best logistics service provider decision-making model.
Figure 3: Hierarchical representation of best logistics service provider selection
The use of ratings enables DMs to analyze each LSP individually with respect to each criterion for their subsequent ranking relative to each other. A decision matrix „D‟ as shown in Table 2 may be constructed to
measure the relative degree of importance for each logistics criteria or attributes, based on the proposed methodology. The decision matrix consist 6×6 elements.
Table 2: Decision matrix ‘D’ for main attributes
Attributes C FS F OP QM R
C 1,1,1 2/5,1/2,2/3 2,5/2,3 5/2,3,7/2 2/7,1/3,2/5 1/2,2/3,1
FS 3/2,2,5/2 1,1,1 2,5/2,3 3/2,2,5/2 2,5/2,3 2/3,1,2
F 1/3,2/5,1/2 1/3,2/5,1/2 1,1,1 2/3,1,2 7/2,4,9/2 1/3,2/5,1/2
OP 5/2,3,7/2 2/5,1/2,2/3 1/2,1,3/2 1,1,1 5/2,3,7/2 1,1,1
76 G. Kabir Inconsistency of TFN used can be checked and the consistency ratio (CR) may be calculated [26]. The results obtained are: λmax = 6.5342; CI = 0.1068; RI =
For the third requirement- the values are calculated as
V (SF ≥ SC) = 0.87, V (SF ≥ SFS) = 0.50, V (SF ≥ 1.24 and CR = 0.0862. As CR < 0.1 the level of SOP) = 0.66,
inconsistency present in the information stored in „D‟
matrix is satisfactory (Saaty 1998).
V (SF ≥ SQM) = 1.00, V (SF ≥ SR) = 0.61,
For the fourth requirement- the values are SC= (6.69, 8.00, 9.57)
⊗
(1/58.72,1/39.83) = (0.11, 0.17, 0.24)
SFS= (8.67, 11.00, 14.00)
⊗
(1/58.72, 1/39.83) = (0.15, 0.23, 0.35)SF= (6.17, 7.20, 9.00)
⊗
(1/58.72, 1/39.83) = (0.11, 0.15, 0.23)SOP= (7.90, 9.50, 11.17)
⊗
(1/58.72, 1/39.83) = (0.13, 0.20, 0.28)SQM= (6.84, 7.78, 9.18)
⊗
(1/58.72, 1/39.83) = (0.12, 0.15, 0.23)SR= (8.00, 10.00, 12.00)
⊗
(1/58.72, 1/39.83) = (0.14, 0.21, 0.30)1/48.35,
1/48.35,
1/48.35,
1/48.35,
1/48.35,
1/48.35,
calculated as
V (SOP ≥ SC) = 1.00, V (SOP ≥ SFS) = 0.81, V (SOP ≥ SF) = 1.00,
V (SOP ≥ SQM) = 1.00, V (SOP ≥ SR) = 0.93, For the fifth requirement- the values are calculated as
V (SQM ≥ SC) = 0.88, V (SQM ≥ SFS) = 0.52, V (SQM ≥ SF) = 1.00,
V (SQM ≥ SOP) = 0.67, V (SQM ≥ SR) = 0.62, For the sixth requirement- the values are calculated as
V (SR ≥ SC) = 1.00, V (SR ≥ SFS) = 0.88, V (SR ≥ The degrees of possibility of superiority of SC can
be calculated by equations (14) and (16) and is denoted by V (SC ≥ SFS). Therefore, the degree of possibility of superiority for the first requirement- the values are calculated as
V (SC ≥ SFS) = 0.60, V (SC ≥ SF) = 1.00, V (SC ≥ SOP) = 0.77,
V (SC ≥ SQM) = 0.77, V (SC ≥ SR) = 0.72,
For the second requirement- the values are calculated as
V (SFS ≥ SC) = 1.00, V (SFS ≥ SF) = 1.00, V (SFS ≥ SOP) = 1.00,
V (SFS ≥ SQM) = 1.00, V (SFS ≥ SR) = 1.00,
SF) = 1.00,
V (SR ≥ SOP) = 1.00, V (SR ≥ SQM) = 1.00,
With the help of equation (17), the minimum degree of possibility of superiority of each criterion over another is obtained. This further decides the weight vectors of the criteria.
Therefore, the weight vector is given as W' = (0.60, 1.000, 0.50, 0.811, 0.515, 0.881) The normalized value of this vector decides the priority weights of each criterion over another. The normalized weight vectors are calculated as
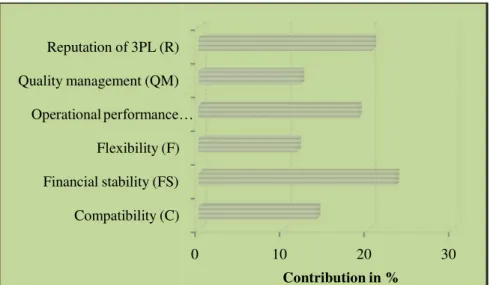
W = (0.139, 0.232, 0.116, 0.188, 0.120, 0.205)
Reputation of 3PL (R)
Quality management (QM)
Operational performance…
Flexibility (F)
Financial stability (FS)
Compatibility (C)
0 10 20 30
Contribution in % Figure 4: Contribution of criteria in percentage
The priority weight of each logistics service normalized matrix is formed by multiplying each value providers with respect to the each criterion has been
determined following the similar procedure. Normalization of these values is made using equation
with their weights.
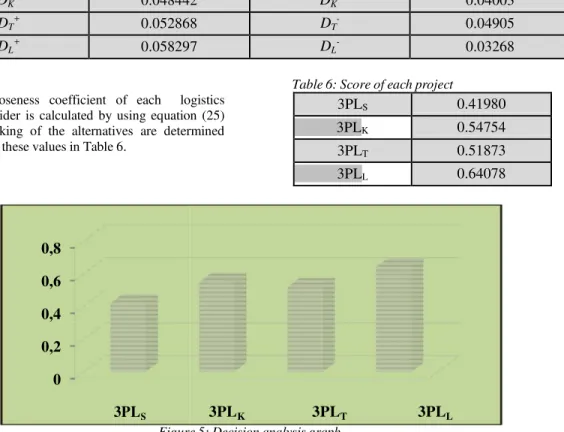
3PLS 0.41980
3PLK 0.54754
3PLT 0.51873
3PLL 0.64078
Table 3: Normalized decision matrix Attributes/
Alternatives C FS F OP QM R
3PLS 0.462 0.614 0.545 0.528 0.477 0.426 3PLK 0.528 0.477 0.484 0.462 0.409 0.569 3PLT 0.593 0.409 0.484 0.593 0.477 0.497 3PLL 0.396 0.477 0.484 0.396 0.614 0.497
Table 4: Weighted normalized decision matrix Attributes/
Alternatives C FS F OP QM R
3PLS 0.0642 0.1424 0.0632 0.0993 0.0572 0.0873 3PLK 0.0734 0.1107 0.0561 0.0869 0.0491 0.1166 3PLT 0.0824 0.0949 0.0561 0.1115 0.0572 0.1019 3PLL 0.055 0.1107 0.0561 0.0744 0.0737 0.1019
Positive and negative ideal solutions are with respect to each criteria are calculated with the help determined by taking the maximum and minimum of equation (23) and (24). Table 5 shows the separation values for each criterion using equation (21) and (22).
Then the distance of each alternative from PIS and NIS
measure of each alternative form PIS and NIS.
Table 5: Separation measure of each alternative
DS+ 0.040135 DS- 0.05547
DK+ 0.048442 DK- 0.04003
DT+ 0.052868 DT- 0.04905
DL+ 0.058297 DL- 0.03268
The closeness coefficient of each logistics service provider is calculated by using equation (25) and the ranking of the alternatives are determined according to these values in Table 6.
Table 6: Score of each project
0,8
0,6
0,4
0,2
0
3PL
S3PL
K3PL
T3PL
L Figure 5: Decision analysis graph78 G. Kabir Figure 5 shows that service provider 3PLL will be the best alternative. The order of ranking the alternatives using Fuzzy Analytical Hierarchy Process and TOPSIS method is 3PLL > 3PLK > 3PLT > 3PLS.
4.CONCLUSIONS
Logistics service provider selection process becomes increasingly important in today‟s complex environment. The selection process involves the determination of quantitative and qualitative factors to select the best possible provider. In this study logistics service provider selection via extent fuzzy AHP and TOPSIS method has been proposed. The decision
criteria are compatibility, financial stability, flexibility, operational performance, quality management and reputation of the 3PL services provider. These criteria were evaluated to obtain the preference degree associated with each logistics service provider alternative for selecting the most appropriate one for the company. By the help of the extent fuzzy approach, the ambiguities involved in the data could be effectively represented and processed to make a more effective decision.
As a result of this study, 3PLL is determined as the best logistics service provider which has the highest priority weight. The company management found the application and results satisfactory and decided to work with 3PLL.
REFERENCES:
[1] Benitez, J.M., Martin, J.C., Roman, C. (2007). Using fuzzy number for measuring quality of service in the hotel industry. Tourism Management, 28(2), 544-555.
[2] Bevilacqua M., Petroni, A. (2002). From Traditional Purchasing to Supplier Management: A Fuzzy Logic- Based Approach to Supplier Selection. International Journal of Logistics: Research and Applications, 5(3), 28-46.
[3] Bahram S.G., i S. Asghari. (2011). A new method for constructing confidence interval for Cpm based on fuzzy data. International Journal for Quality Research 5, (2): 67-73.
[4] Bowersox, D.J., Daugherty, P. (1990). Logistical Excellence: It‟s Not Business as Usual. Digital Press, Burlington, M.A.
[5] Boyson, S., Corsi, T., Dresner, M., Rabinovich, E. (1999). Managing effective third party logistics relationship: what does it take?. Journal of Business Logistics, 20(1), 73-100.
[6] Bozbura, F.T., Beskese, A. (2007). Prioritization of organizational capital measurement indicators using fuzzy AHP. International Journal of Approximate Reasoning, 44(2), 124-147.
[7] Çakır E. (2009). Logistics Outsourcing and Selection of Third Party Logistic Service Provider (3PL) Via Fuzzy AHP. Master Thesis, Bahçeşehir University.
[8] Chang, D.Y. (1992). Extent analysis and synthetic decision. Optimization Techniques and Applications, 1, 352.
[9] Chang, D.Y. (1996). Applications of the extent analysis method on fuzzy AHP. European Journal of Operational Research, 95(3), 649-655.
[10] Ertuğrul, Ð., Karakasoğlu, N. (2009). Performance evaluation of Turkish cement firms with fuzzy analytic hierarchy process and TOPSIS methods. Expert Systems with Applications. 36(1), 702-715.
[11] Foster, T.A., Muller, E.J. (1990). Third parties: your passport to profits. Distribution, 89(10), 30-32.
[12] Ghodsypour S.H., O‟Brien C. (1998). A Decision Support System for Supplier Selection using an Integrated Analytic Hierarchy Process and Linear Programming. International Journal of Production Economics, 56(57), 199-212.
[13] Güner, H. (2005), Bulanık AHP ve Bir İşletme İçin Tedarikçi Problemine Uygulanması. Master Thesis, Pamukkale University.
[14] Hum, S.H. (2000). A Hayes-Wheelwright framework approach for strategic management of third party logistics services. Integrated Manufacturing Systems, 11(2), 132-137.
[15] Hwang C.L., Yoon, K. (1981). Multiple attributes decision making methods and applications, Springer, Berlin.
[16] Kabir, G. (2011). Fuzzy AHP for Contractor Evaluation in Project Management- A Case Study. International Journal of Business and Information Technology, 1(1), 85-96.
[17] Kabir, G., Hasin, M.A.A. (2011). Evaluation of Customer Oriented Success Factors in Mobile Commerce Using Fuzzy AHP. Journal of Industrial Engineering and Management, 4(2), 361-386.
[19] Kahraman C. (2006). Fuzzy Applications in Industrial Engineering. Studies in Fuzziness and Soft Computing, 201, Springer Verlag, NJ USA.
[20] Kahraman, C., Cebeci, U., Ulukan, Z. (2003). Multi-criteria Supplier Selection Using Fuzzy AHP. Logistics Information Management, 16(6), 382-394.
[21] Kahraman, C., Cebeci, U., Ruan, D. (2004). Multi-attribute comparison of catering service companies using fuzzy AHP: the case of Turkey. International Journal of Production Economics, 87(2), 171-184
[22] Kalpande S., R. Gupta, and M. Dandekar. (2010). Identification of strength and weaknesses of Indian manufacturing SMEs using AHP approach. International Journal for Quality Research 4, (4): 263-269. [23] Lee, W.B., Lau, H., Liu, Z., Tam, S. (2001). A fuzzy analytic hierarchy process approach in modular
product design. Expert Systems, 18(1), 32-42.
[24] Saaty, T.L. (1988). The Analytic Hierarchy Process: Planning, Priority Setting, Resource Allocation. RWS Publications, Pittsburgh, PA.
[25] Spencer, M.S., Rogers, D.S., Daugherty, P.J. (1994). JIT systems and external logistics suppliers. International Journal of Operations & Production Management, 14(6), 60-74.
[26] Stank, T.P., Daugherty, P.J., Ellinger, A.E. (1998). Pulling customers closer through logistics service. Business Horizons, 41(5), 74-80.
[27] Verma, R., Pulman, E.M. (1998). An Analysis of the Supplier Selection Process. International Journal of Management Sciences, 26(6), 739-750.
[28] Wang Y.M., Elhag T.M.S. (2006). Fuzzy TOPSIS method based on alpha level sets with an application to bridge risk assessment. Expert Systems with Applications, 31, 309-319.
[29] Wang, Y.J., Lee, H.S. (2007). Generalizing TOPSIS for fuzzy multiple-criteria group decision-making. Computers & Mathematics with Applications, 53(11), 1762-1772.
[30] Xia W., Wu, Z. (2007). Supplier Selection with Multiple Criteria in Volume Discount Environments. Omega, 35, 494-504.
[31] Zadeh, L.A. (1965). Fuzzy sets. Information and Control, 8, 338-353.
Received: 18.09.2011 Accepted: 14.01.2012 Open for discussion: 1 Year