Plant Photosynthesis-Irradiance Curve
Responses to Pollution Show
Non-Competitive Inhibited Michaelis Kinetics
Maozi Lin1,2, Zhiwei Wang2, Lingchao He2, Kang Xu2, Dongliang Cheng3, Genxuan Wang2*
1Fuqing Branch of Fujian Normal University, Fuqing, Fujian Province 350300, Republic of China,2College of Life Sciences, Zhejiang University, Hangzhou, Zhejiang Province 310027, Republic of China,3Key Laboratory of Humid Subtropical Eco-geographical Process, Fujian Normal University, Ministry of Education, Fuzhou, Fujian Province 350007, Republic of China
Abstract
Photosynthesis-irradiance (PI) curves are extensively used in field and laboratory research to evaluate the photon-use efficiency of plants. However, most existing models for PI curves focus on the relationship between the photosynthetic rate (Pn) and photosyntheti-cally active radiation (PAR), and do not take account of the influence of environmental fac-tors on the curve. In the present study, we used a new non-competitive inhibited Michaelis-Menten model (NIMM) to predict the co-variation of Pn, PAR, and the relative pollution
index (I). We then evaluated the model with published data and our own experimental data.
The results indicate that the Pn of plants decreased with increasingIin the environment
and, as predicted, were all fitted well by the NIMM model. Therefore, our model provides a robust basis to evaluate and understand the influence of environmental pollution on plant photosynthesis.
Introduction
Photosynthesis-irradiance (PI) curves, which show the efficiency and capacity of plant photo-synthesis with respect to light intensity, have widely been used in both field and laboratory research to evaluate the influences of abiotic and biotic factors (e.g., nutrient limitation, photo-acclimation) on plant performance, e.g., phytoplankton [1–9],Alnusrubra[10], winter wheat
[11,12],Oriza sativa[13,14],Atriplex hastate[15],Alocasia macrorrhiza[15],Tidestromia
oblongifolia[15],Trillium grandiflorum[16], alga [17], and carrots [18]. Accurate assessment
of such relationships is of fundamental importance for understanding the photochemical yield of the process and for studying the responses of plants to environmental changes, such as pol-lution, temperature, water, and light stresses.
Many models have been used to assess the relationship between the photosynthetic rate (Pn) and photosynthetically active radiation (PAR), including the exponential function (EF, [8, 10]), hyperbolic tangent function (HTF, [1]), nonrectangular hyperbola model (NHM, [11, OPEN ACCESS
Citation:Lin M, Wang Z, He L, Xu K, Cheng D, Wang G (2015) Plant Photosynthesis-Irradiance Curve Responses to Pollution Show Non-Competitive Inhibited Michaelis Kinetics. PLoS ONE 10(11): e0142712. doi:10.1371/journal.pone.0142712
Editor:Antonietta Quigg, Texas A&M University at Galveston, UNITED STATES
Received:April 10, 2015
Accepted:October 26, 2015
Published:November 12, 2015
Copyright:© 2015 Lin et al. This is an open access article distributed under the terms of theCreative Commons Attribution License, which permits unrestricted use, distribution, and reproduction in any medium, provided the original author and source are credited.
Data Availability Statement:All relevant data are within the paper and its Supporting Information files.
Funding:The present study was supported by Natural Science Foundation of China (31330010 and 31370589) and Natural Science Foundation of Zhejiang Province, China (LZ13C030001). The funders had no role in study design, data collection and analysis, decision to publish, or preparation of the manuscript.
13]), rectangular hyperbolic model (RHM, [18]), binomial regression function (BRF, [9,13]), and the modified model based on the rectangular hyperbolic model (MM, [14]). All of these models, except for the three functions (EF, HTF, and BRF), are derived from the Michaelis-Menten equation [11,14,17–19,20]. Biochemically, photosynthesis is essentially a process of reversible enzymatic reaction kinetics, because the primary process in photosynthesis is an oxi-dation-reduction reaction [17] and photosynthetic efficiency relies on photon use efficiency by antenna pigments and the catalytic reaction efficiency of CO2by ribulose diphosphate carbox-ylase. Thus, photons play the role of a resource in photosynthesis, and the relationship between individual gross photosynthesis and PAR can be described by the Michaelis-Menten model [21]. Therefore, the Michaelis-Menten model is optimal to assess the relationship between Pn and PAR. Namely, the RHM, NHM, and MM are all suitable for mathematical fittingof the relationship between Pn and PAR.
However, the PI curve varies significantly with abiotic factors [7], especially environmental pollution [22–25]. Soil pollution, which results from elevated concentrations of pollutants in soil or water, has become a widespread environmental problem because of increased industrial-ization [26], the land application of sewage sludge [27], and the use of feed additives and/or premixes containing heavy metals in animal husbandry [28]. Thus, it is necessary to build a further model that takes into account the effect of pollution on the relationship between Pn and PAR.
The objectives of the present study were to: 1) build a model for predicting the relationship of Pn, PAR, andI(the relative pollution index) in a contaminated environment; and 2) deter-mine why and whether the non-competitive inhibited Michaelis-Menten model (NIMM) is suitable for predicting the PI curve of plant responses to pollution. However, because there are three kinds of pollutant-induced inhibited enzymatic reactions, including competitive, non-competitive, and un-non-competitive, it is also important to determine which is the most suitable to show the inhibiting effect of pollutants on the PI curve.
Materials and Methods
2.1 The non-competitive inhibited Michaelis-Menten model
Michaelis and Menten [29] proposed the Michaelis-Menten equation (Eq 1) to describe the relationship between v and [S] in enzymatic reactions,
v¼ Vm½S Kmþ ½S
ð1Þ
where v is the velocity of the enzymatic reaction, Vmis the maximum velocity of the enzymatic reaction, [S] is the content of the substrate in the enzymatic reaction, and Kmis the Michaelis constant. Further, in an inhibitor-induced enzymatic reaction, three general types of inhibition kinetics equations (i.e., competitive,Eq 2; non-competitive,Eq 3; and uncompetitive,Eq 4) can be derived from the Michaelis-Menten equation [29,30],
v¼ Vm½S Km 1þ
½I Ki
þ ½S ð2Þ
v¼ Vm½S
ðKmþ ½SÞ 1þ ½I Ki
v¼ Vm½S Kmþ ½S 1þ
½I Ki
ð4Þ
in these equations, v, Vm, [S], and Kmare the same as mentioned above; [I] is the content of the inhibitor; and Kiis the inhibition constant. As mentioned above, photosynthesis is a process of enzymatic reactions, and photons play the role of a resource [21], the PAR in photosynthesis is similar to the [S] in an enzymatic reaction.
The RHM (Eq 5) was derived from the Michaelis-Menten equation [11,14,18,19],
Pn¼ aPmPAR
aPARþPm
Rd ð5Þ
whereαis the photochemical efficiency of photosynthesis at low light, Pmis the maximum photosynthetic rate, PAR is the photosynthetically active radiation, and Rd is the dark respira-tion rate.
Ye [14] presented a new model (Eq 6) modified from the RHM (Eq 5) for predicting the relationship between Pn and PAR,
Pn¼að1 bPARÞPAR
1þgPAR Rd ð6Þ
Whereαis the photochemical efficiency of photosynthesis at low light, i.e., the initial slope of the PI curve;βis a correction factor for the decreasing trend of Pn when PAR exceed light satu-ration point due to photoinhibition, and theβis similar to the convexity [9,11] or the sharp-ness of the knee [20] of the PI curve,γis a conversion factor for theα(i.e., the initial slope of the PI curve) and the Pm(i.e., the maximum photosynthetic rate), and theγis proportional to the radio ofαand Pm(i.e.,g/Pam);α,β, andγare coefficients that are independent of irradiance [14]; PAR is the photosynthetically active radiation, and Rd is the dark respiration rate. Here, we assumed that, 1) the Pn of plants decreased with increasing concentrations of a pollutant; and 2) the effect of the pollutant on the PI curve is non-competitive inhibited, and we pre-sented our new non-competitive inhibited Michaelis-Menten model (NIMM) as:
Pn¼ að1 bPARÞPAR ð1þgPARÞ 1þ I
Ki
Rd ð7Þ
Whereα,βandγare the same as mentioned above; Pn denotes the net photosynthetic rate; Ki denotes an inhibition constant;Iis the relative pollution index and
I¼ Ci
Cimax
ð8Þ
Where Ciis the actual concentration of pollutant i in water or soil; and Cimaxis the maximum concentration of pollutant i in water or soil.
2.2 Experimental design
the soil heavy metal pollution result from rapid industrialization and urbanization during industrial and agricultural development and population growth. So, we tested the pollutants including phenol and some common metal pollutants, e.g., Cu2+, Pb2+, Cd2+, and Al3+. The Bordeaux mixture (a mixture of coppersulfate and lime) or animal manure use in agriculture results in the potential risk of soil copper pollution. The lead and cadmium pollution also result from automobile exhaust. The soil acidity increasing leads to aluminum pollution. The plants we considered including monocotyledonous or dicotyledonous plant, C3or C4plant, herba-ceous or woody plant, or crop. We collected and analyzed the data of effects of phenol and Cu2+on plants from pot-culture experiments. For additional information, we also extracted and analyzed the data about the effects of other pollutants such as Pb2+, Cd2+and Al3+on plants from published literatures [22–25].
2.3 Pot-culture experiment and PI curves measurement
The pot-culture experiments were carried out in a greenhouse at the Fuqing Branch of Fujian Normal University from June to September in 2013.T.pratenseL. andW.trilobata, two types of ornamental groundcover that often appear on roadsides and plantations, were planted in flowerpots filled with1.8 kg soil. Each treatment had 15 replicates. The properties of the soil were pH: 6.4, total nitrogen: 24.2 mg kg-1, total phosphorus: 1.15 g kg-1, available phosphorus: 9.03 mg kg-1, total potassium: 68 mg kg-1, and clay particles: 21.7%.
T.pratenseseeds were germinated for 48 h in the dark (on wet filter paper at 25°C) and
sown into a flowerpot (diameter: 200mm, height: 200mm) filled with phenol treated soil. Before being filled into pot, air-dried soil was treated with 0 (as control), 100, 200, or 300 mg kg-1of phenol.W.trilobatawere collected from the roadsides and cut, and the apex meristem with two leaves (100-mm length, two internodes) were planted in a flowerpot (diameter: 200 mm, height: 200 mm). Three apex meristems were planted in every flowerpotwith
CuSO45H2O added soil. Air-dried soil was added with 0 (as control), 500, 1000, or 2000 mg kg-1of CuSO45H2O, and then was filled into the flower port.
We selected a sunny day (three months after planting) to measure the PI curves using a CIRAS-2 Portable Photosynthesis System (PP Systems, USA) with an LED radiation source.
2.4 Data collection and detailed data descriptions
PI data for plants under different concentrations of pollutants from four studies were gathered from published literatures (Table 1) to further evaluate our NIMM. All data were collected from pot-culture experiments.
The pot-culture experiments ofZ.maysseedling [22] were conducted in silica culture. And the seedlings consisting of one bud and two leaves were treated with three Hoagland solu-tion (including equal amount of Pb2+and EDTA at different concentrations: 0, 0.25 or 0.5
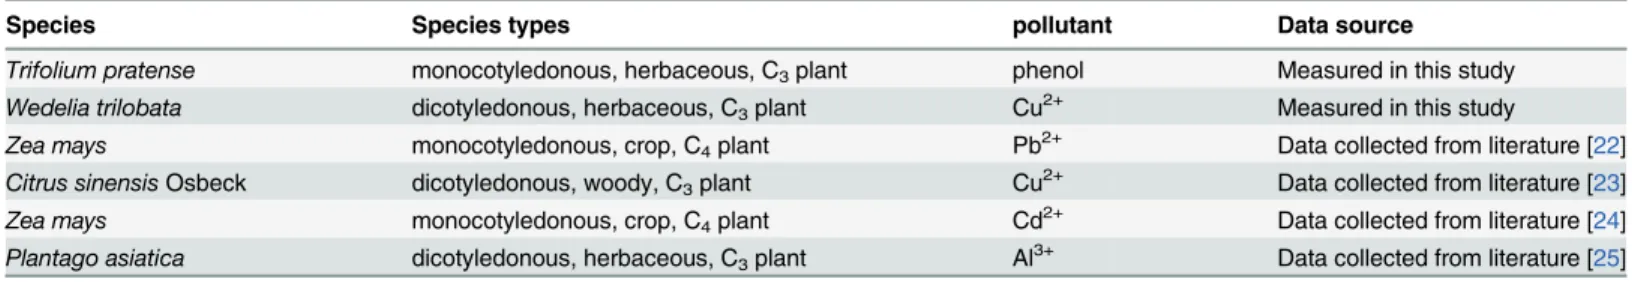
Table 1. Data matrix for model establishing.
Species Species types pollutant Data source
Trifolium pratense monocotyledonous, herbaceous, C3plant phenol Measured in this study
Wedelia trilobata dicotyledonous, herbaceous, C3plant Cu2+ Measured in this study
Zea mays monocotyledonous, crop, C4plant Pb2+ Data collected from literature [22]
Citrus sinensisOsbeck dicotyledonous, woody, C3plant Cu2+ Data collected from literature [23]
Zea mays monocotyledonous, crop, C4plant Cd2+ Data collected from literature [24]
Plantago asiatica dicotyledonous, herbaceous, C3plant Al3+ Data collected from literature [25]
mmolL-1). After 15 days of treatment, the PI curves were measured with a Ciras-2 portable photosynthesis system (PP systems, UK). For more detailed information, please seeS1 Table.
The one-year oldC.sinensisOsbeck [23] was grafted ontoCitrus aurantiumL. before Cu stress treatment. The pot-culture experiments ofC.sinensisOsbeck were conducted in a 10-L pot filled with 8 L of Alva nutrient solution (pH 6.5). The Alva nutrient solution was aerated 3 times with each time for 2 h in every day, and it was renewed every 10 days; And theC.sinensis Osbeck were treated with five Alva nutrient solution (containing Cu2+concentration at0, 0.1, 5, 20 or 40μmolL-1). After 60 days of treatment, the PI curves were measured with a CID-301 PS (CID Bio-Science, Inc., USA). For more detailed information, please seeS2 Table.
The other pot-culture experiments ofZ.mays[24] were conducted in paddy soil. The prop-erties of the paddy soil were pH: 6.42, organic matter: 1.63%, total Cd: 0.32 mgkg-1, total nitro-gen: 0.09%, available phosphorus: 0.05%, available potassium: 0.04%. The paddy soil was air-dried and sieved through a 2-mm sieve, mixed with different amount of CdCl22.5H2O, and then the post-treated paddy soil was added into each pot up to three kg with one gram of com-pound fertilizer (including N 15%, P 15%, K 15%). Finally, the germinatedZ.mayswere planted; So far, the germinatedZ.mayswere treated with six paddy soil (including Cd concen-tration at: 0.32, 1, 5, 15, 50 or 100 mgkg-1). After 20 days of treatment, the PI curves were mea-sured with Li-6400 (Li-Cor Inc., USA). For more detailed information, please seeS3 Table.
TheP.asiatica[25] seed was sterilized with 0.1% HgCl2for 10 min, following by washing
and soaking in distilled water for 8 h, and then the seed was sowed in sterilized silica culture. The two-leaves old plantswere transplanted into a 20 cm × 23cm flowerpot with three kg medium (peat soil: sand = 3:1). On the six-leaves old plant, the Al stress was performed. 10 mL of AlCl3solution (pH 4.0) with different concentration at 0, 100, 500, 800 or 2000 mgL-1were respectively poured into the flowerpot to simulate different leaching of Al3+in soil every day. After 20 days of treatment, the PI curves were respectively measured with a Ciras-2 portable photosynthesis system (PP systems, UK). For more detailed information, please seeS4 Table.
2.5 Mathematical fitting and model testing
To obtain the equation parameters (i.e.,α,β,γ, Ki, and Rd), mathematical fitting of NIMM was performed using 1stOpt software (7D-Soft High Technology Inc. Beijing, China) with the Levenberg-Marquardt method. In addition, mathematical fitting of the relationship of Pn andI and that of Pn and PAR were performed to obtain the equation parameters using the same soft-ware and method as in the previous case. The relationship between the Pn and PAR ofT.
pra-tenseresponse to different concentrations of phenol in our pot-culture experiment was
calculated according to the mathematical fitting results to test the NIMM. The relationship between the Pn and PAR ofW.trilobataresponse to different concentrations of Cu2+was cal-culated using the same method.
Results
3.1 Experimental results
The Pn in our pot-culture experiments was measured with a Ciras-2 under conditions of natu-ral ambient CO2at different PAR. Our results were similar to the references [22–25]. Clearly, the PI curves of the plants were saturation curves. The results also showed that, either inW.
tri-lobataor inT.pratense, the Pn increased with PAR increasing below the PARsat(i.e., light
satu-ration point,1000μmol photon m-2s-1inT.pratense,1400μmol photon m-2s-1inW.
trilobata), while decreased as PAR increasing above PARsat. The results also showed that the
3.2 Effect of a pollutant on the normalized Pn of plants
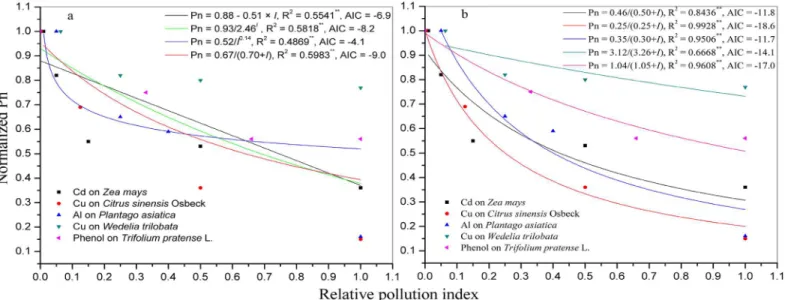
The normalized Pn of plants decreased with increasing concentrations of the pollutant under 1000μmol photon m-2s-1PAR (Fig 1). Akaike's information criterion (AIC) was proposed by Akaike [31,32] and defined asEq 9,
AIC¼Nln Reþ2p ð9Þ
Where N is the number of experimental data points, p is the number of parameters in an estimated model, and Reis the residual sum of squares. In addition, the model with the lowest AIC is regarded as the best representation of a curve [32]. The Pn values for all five species were normalized to the pollutant-free control value of Pn, and the normalized Pn were regressed with respect toIusing linear (Eq 10), power (Eq 11), exponential (Eq 12), and hyper-bolic (Eq 13) functions,
Pn0¼aþbI ð10Þ
Pn0¼ a
Ib ð11Þ
Pn0¼ a
bI ð12Þ
Pn0¼ a
bþI ð13Þ
in these equations (Eqs10~13), Pn0is the normalized net photosynthetic rate, a and b are coefficients,Iis the relative pollution index.
And the results showed that all functions (Eqs10,11,12and13) were significant (P<0.01),
and the hyperbolic function (Eq 13) was the optimal function based on having the greatest goodness-of-fit (R2) of 0.5983 and the lowest AIC of -9.0 (Fig 1a). The normalized Pn of each species was regressed with respect toIusing a hyperbolic (Eq 13) function, and the results were all significant (P<0.01) (Fig 1b).
3.3 Mathematical fitting of PI curves using different models
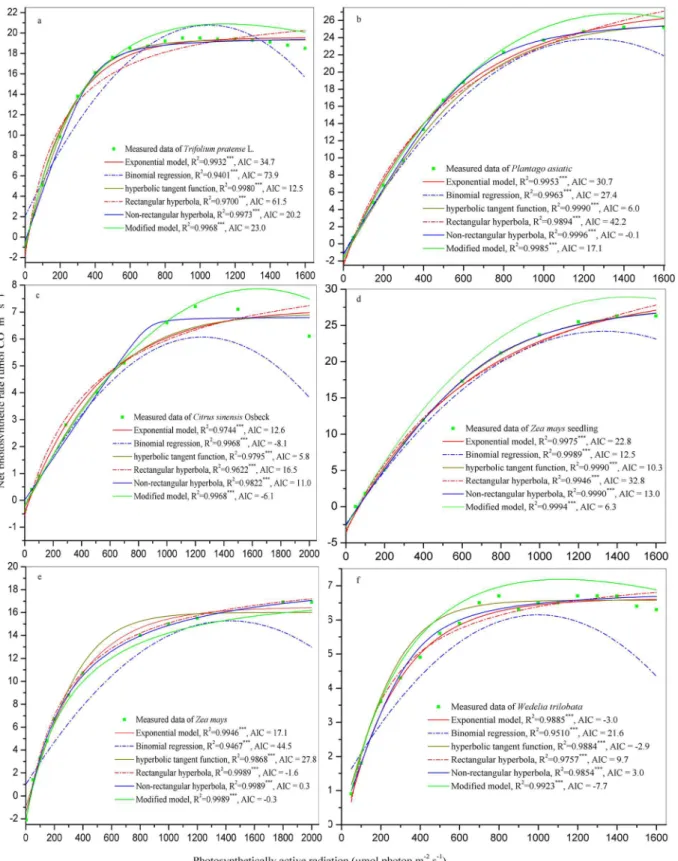
The Pn ofT.pratense,Z.maysseedling,C.sinensisOsbeck,Z.mays,P.asiatica,W.trilobata were respectively regressed with respect to PAR usingan EF [8,10], HTF [1], NHM [11,13], RHM [17,18], BRF [9,13], and MM [14]. The R2was significant for all models (P<0.001). In
T.pratenseorP.asiatica, the three largest R2values (associated with the lowest AIC) of models
were for HTF, NHM, and MM (Fig 2a and 2b). InC.sinensisOsbeck orZ.maysseedling, the three largest R2values (associated with the lowest AIC) of models were for HTF, BRF, and MM (Fig 2c and 2d). InZ.mays, the three largest R2values (associated with the lowest AIC) of mod-els were for RHM, NHM, and MM (Fig 2e). InW.trilobata, the three largest R2values (associ-ated with the lowest AIC) of models were for EF, HTF, and MM (Fig 2f). The MM and BRF were both better than other models at describing the photoinhibition phenomenon at high PAR (Fig 2).
3.4 Evaluation of NIMM
trilobatawas greater than that ofCitrus sinensisOsbeck. The Kiof Cu toW.trilobatawas greater than that of the phenol toT.pratense. ForZ.mays, the Kiof Cd was greater than that of Pb.
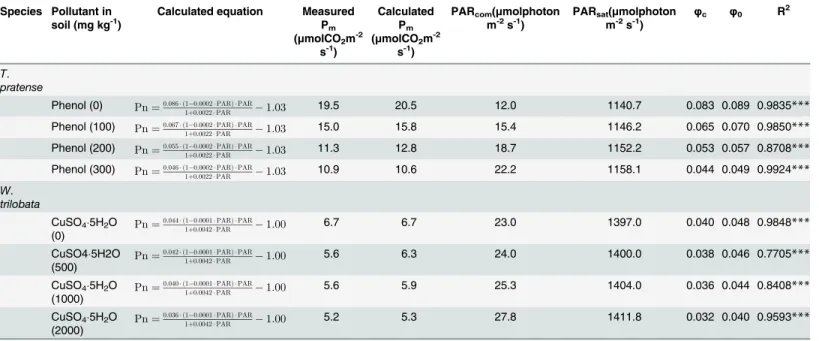
The NIMM was tested using our pot-culture experimental data. Either inT.pratense, or in
W.trilobata, the R2values were all significant (P<0.001) under different pollution levels (Fig
3,Table 3). Either inT.pratense, or inW.trilobata, the light saturation point (PARsat) and the light compensation point (PARcom) both increased with worsening pollution, while the maxi-mum photosynthetic rate (Pm), quantum efficiency at PARcom(φc), and intrinsic quantum effi-ciency (φ0) all decreased (Table 3). Theφcrepresents the light energy use efficiency at PARcom, theφ0represents the intrinsic light energy use efficiency at darkness, i.e., the optimal light use potential of plant. The results suggested that the pollutant inhibited the light use potential of plant. In order to analyze the credibility of the assessment results, we performed paired sam-plest test analysis, and the results showed that inT.pratense, the calculated Pmwas no signifi-cant difference to the measured Pm(t= -1.975,df= 3,P2-tailed= 0.143), inW.trilobata, the calculated Pmwas also no significant difference to the measured Pm(t= -1.777,df= 3,P2-tailed = 0.174).
Discussion
All of the above mentioned existing models (i.e., EF; HTF; NHM; RHM; BRF; and MM) pro-vide useful protocols for PI curve assessment. Jassby and Platt reported that, from zero light up to the onset of photoinhibition, the PI curve for natural populations of coastal phytoplankton is best described by HTF, and they recommended its use as an operational model for the eluci-dation of physiological parameters in photosynthesis-light experiments and for the theoretical investigation [1]. The shape of PI curve described by EF suggests that a linear relation holds only for low light intensities, then the photosynthetic rate tends towards a maximum value-when the light intensity is increasing [8,10]. The NHM was found to be objective to calculate the photosynthetic parameters of the PI curve [9,11,13,20], the PI curve could also be described by BRF [13,33], but the BRF could not be used to calculate thequantum
Fig 1. Effect of a pollutant on the normalized Pn under 1000μmolphotonm-2s-1PAR.a, the normalized Pn of all five species regressed with respect toI using linear, power, exponential, and hyperbolic functions. b, the normalized Pn of each species regressed with respect toIusing the hyperbolic function. AIC is Akaike's information criterion.**means significant atP0.01.
efficiencyand explain that the predicted Pn declines quickly when PAR excesses the light satu-ration point [13]. In addition, the BRF has the shortcoming of sometimes inferring a positive dark respiration rate, which has no biological significance. The RHM can be obtained from the NHM by puttingθ= 0, it is a special case of the NHM [20]. And the RHM is preferred to the NHM by some workers on the grounds of simplicity [18,20], though it is rather tedious to take the limit asθ!0 in the NHM equation [20]. Our experimental results showed that the shapes of PI curves were similar to that of the literatures. Our experimental results also showed that the PI curves have photoinhibition phenomenon at high irradiance, i.e., the Pn decreased when the PAR exceeded light saturation point. These results were fully consistent with that of the lit-erature [8,11,13,14,23,34]. Although the HTM, EF, NHM and RHM have been extensively applied [11,14,17,18,20,34–38], they do not consider the photoinhibition of plants. The MM, which is based on the RHM, is useful to study photoinhibition and photosynthetic behavior at high irradiance and, especially, is the best model to describe the PI curve because its fitted values wereclose to the measured data [14]. Therefore, the MM (Eq 6) was the optimal
Table 2. Mathematical fitting results of the NIMM for plant responses to pollution.
Model parameters
Species (Pollutant) Data source Ki α β γ Rd R2
Trifolium pratense(Phenol) Measured in this study 1.17 0.086 0.0002 0.0022 1.03 0.9886 Wedelia trilobata(Cu) Measured in this study 4.48 0.044 0.0001 0.0042 1.00 0.9629 Zea mays(Pb) Reference [22] 0.395 0.044 0.0003 0.0002 1.78 0.9841 Citrus sinensisOsbeck (Cu) Reference [23] 0.321 0.013 0.0003 0.0002 0.42 0.9862 Zea mays(Cd) Reference [24] 0.923 0.061 0.0001 0.0015 1.65 0.8984 Plantago asiatica(Al) Reference [25] 0.501 0.058 0.0003 0.0005 1.59 0.9576 Kidenotes the inhibition constant;αdenotes the photochemical efficiency of photosynthesis at low light, i.e., the initial slope of the PI curve;βandγare
the coefficients that are independent of irradiance; Rd denotes the dark respiration rate.
doi:10.1371/journal.pone.0142712.t002
modelfor predicting the relationship of Pn and PAR. Moreover, based on the lowest AIC values [31,32], the HTF, NHM, and MM are more suitable for characterizing the PI curve (Fig 2).
Temperature, intensity of irradiation, and concentration of carbon dioxide in the surround-ing medium are the three important controllsurround-ing factors could influence the rate of photosyn-thesis in plant, and of the three controlling factors, the most important is the temperature [11, 17]. However, the concentration of carbon dioxide in the atmosphere remains relatively con-stant, and it is unlikely to be a major factor effecting variations in the rate of photosynthesis, simultaneously, the temperature could not influence the shape of the PI curve of plant, there-fore, temperature and concentration of carbon dioxide need not appear explicitly in a PI curve model [11]. On the other hand, the shapes of PI curves in our pot-culture experiments (Fig 3) were fully consistent with that of the literatures [8,11,13,14,22–25,34], and showed thatα and Pmboth decreased along with the increasing concentrations of pollutant, but the convexity [11,13,37], or the sharpness of the knee [20] of the PI curve described by the NHM increased along with increasing pollutant concentrations. It indicated that the pollutants negatively affected on the photosynthesis of plants, and the impact degree increased with rising pollutant concentrations. This conclusion was similar to that of the literature [17]. The literature [17] reported that a poison may materially to reduce the rate of photosynthesis, because the poison may either decrease the velocity of the Blackman reaction, or decrease the velocity of the pri-mary photosynthetic reaction by being preferentially adsorbed by the chlorophyll a and thus preventing the latter from adsorbing or combining with hydrated carbon dioxide. So, pollutant was significant and necessary appear explicitly in a PI curve model. And even though some metals, such as zinc and copper, are essential trace elements for plants as the natural active sites of an enzyme, plant growth and development only need low concentrations of these metals of around 10μg g-1dry plant tissue [39,40]. Some studies [41,42] have also shown that pollutants
Table 3. Model testing results of the NIMM.
Species Pollutant in soil (mg kg-1)
Calculated equation Measured Pm (μmolCO2m-2
s-1)
Calculated Pm (μmolCO2m-2
s-1)
PARcom(μmolphoton m-2s-1)
PARsat(μmolphoton m-2s-1)
φc φ0 R2
T. pratense
Phenol (0) Pn¼0:086 ð1 0:0002PARÞ PAR
1þ0:0022PAR 1:03 19.5 20.5 12.0 1140.7 0.083 0.089 0.9835***
Phenol (100) Pn¼0:067 ð1 0:0002PARÞ PAR
1þ0:0022PAR 1:03 15.0 15.8 15.4 1146.2 0.065 0.070 0.9850***
Phenol (200) Pn¼0:055 ð1 0:0002PARÞ PAR
1þ0:0022PAR 1:03 11.3 12.8 18.7 1152.2 0.053 0.057 0.8708***
Phenol (300) Pn¼0:046 ð1 0:0002PARÞ PAR
1þ0:0022PAR 1:03 10.9 10.6 22.2 1158.1 0.044 0.049 0.9924***
W. trilobata
CuSO45H2O
(0) Pn¼
0:044 ð1 0:0001PARÞ PAR
1þ0:0042PAR 1:00 6.7 6.7 23.0 1397.0 0.040 0.048 0.9848***
CuSO45H2O
(500) Pn¼
0:042 ð1 0:0001PARÞ PAR
1þ0:0042PAR 1:00 5.6 6.3 24.0 1400.0 0.038 0.046 0.7705***
CuSO45H2O
(1000) Pn¼
0:040 ð1 0:0001PARÞ PAR
1þ0:0042PAR 1:00 5.6 5.9 25.3 1404.0 0.036 0.044 0.8408***
CuSO45H2O
(2000) Pn¼
0:036 ð1 0:0001PARÞ PAR
1þ0:0042PAR 1:00 5.2 5.3 27.8 1411.8 0.032 0.040 0.9593***
PARsatis light saturation point; PARcomis light compensation point; Pmis maximum photosynthetic rate;φcis the quantum efficiency at PARcom;φ0is
intrinsic quantum efficiency;PARcom¼Rda,φ0=α[1+(β+γ)PARcom],φc¼a
1þðbþgÞ PARcom bgPAR2 com
ð1þgPARcomÞ2 ,PARsat¼
ffiffiffiffiffiffiffiffiffiffiffiffiffiffiffiffiffiffiffiffiffiffiffiffiffi ðbþgÞ ð1þgPARcomÞ
b
p
1 g ,Pm¼
a ð1bPARsatÞ PARsat 1þgPARsat Rd;
(heavy metals) significantly affect the Pn of plants. Hence, in the present study, an attempt was made to build a new model, which was integratedI(i.e., pollution index) into the MM, for pre-dicting the relationship of Pn, PAR andI.
Then, how to integrate theIinto the MM? The relationship of normalized Pn andIwere respectively regressed using linear (Eq 10), power (Eq 11), exponential (Eq 12), and hyperbolic (Eq 13) functions. And, the effect of pollutants on the Pn of plants (Fig 1) indicated that the hyperbolic function (Eq 13) was optimal for predicting the relationship of Pn andI. Thus, we integrated theIinto the MM as:
Pn¼að1 bPARÞPAR 1þgPAR
a
bþI Rd ð14Þ
Eq 14can be converted into:
Pn¼að1 bPARÞPAR ð1þgPARÞðbþI
aÞ
Rd ð15Þ
Further,Eq 15can be converted into:
Pn¼ að1 bPARÞPAR ð1þgPARÞb
að1þ
I
bÞ
Rd ð16Þ
If b = Kiandd¼ba,Eq 16can be expressed as:
Pn¼ að1 bPARÞPAR ð1þgPARÞ d ð1þ I
KiÞ
Rd ð17Þ
Whereδis a non-zero coefficient,Eq 17is equivalent to the NIMM, i.e.,Eq 7.
Further, our mathematical fitting results showed that the NIMM was suitable for predicting the relationship of Pn, PAR, andIbecause of their high R2(Table 2) and their significance at theP<0.001 level (Table 3), that is, the NIMM was suitable for fitting the PI curve of plant
responses to pollution (Fig 3,Table 3). The NIMM showed that the Pn is a function of PAR andI, thus, theEq 18denotes the influence rate ofIon Pn, and theEq 19denotes the influence rate of PAR on Pn,
@Pn
@I ¼
að1 bPARÞPAR
Kið1þgPARÞ 1þKIi
2 ð18Þ
@Pn
@PAR¼
a 2abPAR abgPAR2 Kið1þgPARÞ
2
1þ I
Ki
ð19Þ
Where@Pn
@I and
@Pn
@PARare partial derivative, denotes the influence rate ofIon Pn, and the infl
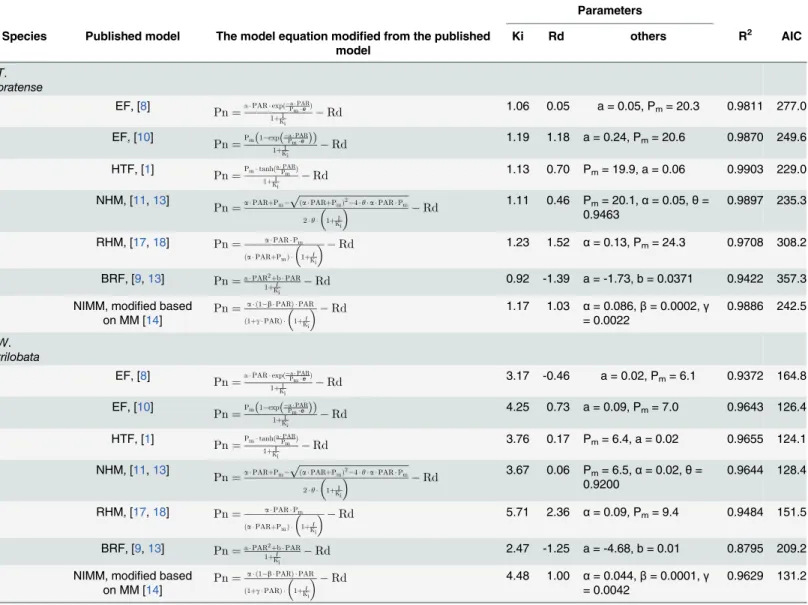
that of the models which were modified from the EF [8,10], RHM [17,18], and BRF [9,13] (i.e., 277.0, 249.6, 308.2, and 357.3 respectively), while, the AIC of the NIMM was higher than that of the models modified from the HTF [1] or NHM [11,13] (i.e., 229.0 or 235.3 respec-tively). InW.trilobata, the AIC of the NIMM (i.e., 131.2) was lower than that of the models which were modified from the EF [8], RHM [17,18], and BRF [9,13] (i.e., 164.8, 151.5, and 209.2 respectively), while, the AIC of the NIMM was higher than that of the models modified from the EF [10], HTF [1] or NHM [11,13] (i.e., 126.4, 124.1, and 128.4 respectively). Although the model with the lowest AIC is regarded as the best representation of a curve [32], the models of the EF [10], HTF [1], NHM [11,13], and RHM [17,18] cannot fit the data that shows the photoinhibition phenomenon at high irradiance. The NIMM modified from the MM [14], is more reliable at unveiling the photoinhibition phenomenon. Therefore, the NIMM provides a robust tool to evaluate and understand the influence of environmental pollu-tion on plant photosynthesis, and it is relative improved model comparing to the previous models published [1,8–11,13,17,18,20].
Pollutants (metals) are harmful to plants because they inhibit various metabolic processes [41–43]. Some metal pollutants directly affect enzymes of the chlorophyll biosynthesis pathway [44–46], and some affect the proper assembly of the photosynthetic pigment-protein com-plexes [47,48]. Some metalsreplace the central Mg ion in chlorophyll molecules, destroying the chlorophyll [49]. Conversely, some studies have not found that metal pollutants directly affect the biosynthesis of pigments or influence the photosynthetic machinery, and have claimed that the metal pollutants interfere with cell division and chloroplast replication, thus decreasing the number of chloroplasts and ultimately lowering the photosynthetic efficiency [50]. Thus, regardless of whether elevated concentrations of pollutants in contaminated environments bind equally well to enzymes, they will already have negatively affected plant growth and devel-opment through the inhibition of photosynthetically related enzyme activity. Our mathemati-cal fitting results indicate that the elevated concentrations of pollutants not only inhibitedα (i.e., photosynthetic potential, light use efficiency, or the slope of the PI curve), but also lowered Pn (Tables2and3, Figs1and3). The former (i.e., decreasedαassociated with increasing pol-lutant concentrations) suggested that the pollution decreased the activity of the photosyntheti-cally related enzyme. Ourpot-culture experimental results showed that inW.trilobata, the pollutant (Cu2+) did not significantly affect the pigment content, above-ground biomass, or belowground biomass, but did significantly affect the Pn (Please seeS7 Table). Our pot-culture experimental results also showed that the pollutant (phenol) significantly affected the biomass and Pn ofT.pratense, but did not affect its pigment contents (Please seeS8 Table). The results indicate that the pollutants acted as a non-competitive inhibitor because they varied the Pn of plants (which is equivalent to the maximum enzymatic reaction rate in the Michaelis-Menten model). Combining with the above-mentioned relationship between individual gross photo-synthesis and PAR following the Michaelis-Menten model [21], that is, our results were similar to the literature [21]. And, the NIMM was suitable for reasonably predicting the relationships of Pn, PAR, andI.
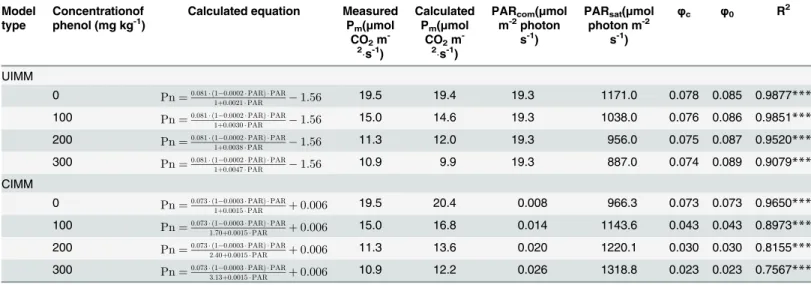
To compare the three Michaelis kinetics (i.e., non-competitive, competitive, and un-com-petitive inhibition), we integrated the pollution factor into the MM in different ways, and per-formed mathematical fitting using our pot-culture experimental data forT.pratense. The result for un-competitive inhibited Michaelis-Menten (UIMM) kinetics was
Pn¼0:081ð1 0:0002PARÞPAR 1þ0:0021PAR1þ I
0:80
ð Þ 1:56, R
2
= 0.9777, and an AIC of 283.2. The result for competitive
inhibited Michaelis-Menten (CIMM) kinetics wasPn¼0:073ð1 0:0003PARÞPAR 11þ I
0:470
ð Þþ0:0015PAR þ0:006, R
2=
NIMM). We also tested the two models (UIMM and CIMM) using our pot-culture experimen-tal data forT.pratense; the results are shown inTable 5. Based on the UIMM, it’s unreasonable that theφ0increased but the calculated Pmdecreased with the increasing phenol pollution. Based on the CIMM, we performed paired samplesttest analysis, and the results showed that the calculated Pmwas significant higher than the measured Pm(t= -5.184,df= 3,P2-tailed= 0.014), i.e., the calculated Pmdeviated greatly from the measured Pm. So, the UIMM and CIMM were both unsuitable for predicting the relationship of Pn, PAR, andI. The NIMM, however, was suitable for predicting the relationship of Pn, PAR, andIbecause the calculated
Table 4. The comparation of model application results inT.pratenseorW.trilobata.
Parameters
Species Published model The model equation modified from the published model
Ki Rd others R2 AIC
T. pratense
EF, [8] Pn
¼aPARexpð
aPAR PmeÞ 1þI
Ki
Rd 1.06 0.05 a = 0.05, Pm= 20.3 0.9811 277.0
EF, [10] Pn
¼Pm 1 exp aPAR Pme
ð Þ
ð Þ
1þI Ki
Rd 1.19 1.18 a = 0.24, Pm= 20.6 0.9870 249.6
HTF, [1] Pn
¼PmtanhðaPAR Pm Þ 1þI
Ki
Rd 1.13 0.70 Pm= 19.9, a = 0.06 0.9903 229.0
NHM, [11,13]
Pn¼aPARþPm
ffiffiffiffiffiffiffiffiffiffiffiffiffiffiffiffiffiffiffiffiffiffiffiffiffiffiffiffiffiffiffiffiffiffiffiffiffiffiffiffiffiffiffiffi
ðaPARþPmÞ2 4yaPARPm
p
2y 1þI Ki
Rd
1.11 0.46 Pm= 20.1,α= 0.05,θ=
0.9463 0.9897 235.3
RHM, [17,18] Pn¼ aPARPm
ðaPARþPmÞ 1þI Ki
Rd 1.23 1.52 α= 0.13, Pm= 24.3 0.9708 308.2
BRF, [9,13] Pn¼aPAR2
þbPAR 1þI
Ki
Rd 0.92 -1.39 a = -1.73, b = 0.0371 0.9422 357.3
NIMM, modified based on MM [14] Pn¼
a ð1 bPARÞ PAR
ð1þgPARÞ 1þI Ki
Rd 1.17 1.03 α= 0.086,β= 0.0002,γ
= 0.0022 0.9886 242.5
W. trilobata
EF, [8] Pn
¼aPARexpð
aPAR PmeÞ 1þI
Ki
Rd 3.17 -0.46 a = 0.02, Pm= 6.1 0.9372 164.8
EF, [10]
Pn¼Pmð1 expðPmaPAReÞÞ 1þI
Ki
Rd 4.25 0.73 a = 0.09, Pm= 7.0 0.9643 126.4
HTF, [1] Pn
¼PmtanhðaPmPARÞ 1þI
Ki
Rd 3.76 0.17 Pm= 6.4, a = 0.02 0.9655 124.1
NHM, [11,13]
Pn¼aPARþPm
ffiffiffiffiffiffiffiffiffiffiffiffiffiffiffiffiffiffiffiffiffiffiffiffiffiffiffiffiffiffiffiffiffiffiffiffiffiffiffiffiffiffiffiffi
ðaPARþPmÞ2 4yaPARPm
p
2y 1þI Ki
Rd
3.67 0.06 Pm= 6.5,α= 0.02,θ=
0.9200
0.9644 128.4
RHM, [17,18] Pn¼ aPARPm
ðaPARþPmÞ 1þKiI
Rd 5.71 2.36 α= 0.09, Pm= 9.4 0.9484 151.5
BRF, [9,13] Pn¼aPAR2þbPAR 1þI
Ki
Rd 2.47 -1.25 a = -4.68, b = 0.01 0.8795 209.2
NIMM, modified based
on MM [14] Pn¼
a ð1 bPARÞ PAR
ð1þgPARÞ 1þI Ki
Rd 4.48 1.00 α= 0.044,β= 0.0001,γ
= 0.0042 0.9629 131.2
EF, exponential function; HTF, hyperbolic tangent function; NHM, nonrectangular hyperbola model; RHM, rectangular hyperbolic model; BRF, binomial regression function; MM, modified model based on the rectangular hyperbolic model; NIMM, non-competitive inhibited Michaelis-Menten model; Ki
denotes the inhibition constant; Pm, maximum net photosynthetic rate;eis natural logarithm, 2.71828; a and b is constant;θis convexity of the PI curve;α
denotes the photochemical efficiency of photosynthesis at low light,i.e., the initial slope of the PI curve;βandγare the coefficients that are independent of irradiance; Rd denotes the dark respiration rate; AIC, Akaike's information criterion.
Pmvalues were close to the measured Pm(Table 3), and thefitted results were close to mea-sured data (Fig 3).
Interestingly, pollutants play a role in the inhibition of photosynthetically related enzyme activity; the Kidecreased with the combination of the pollutant with the photosynthetically related enzyme. The mathematical fitting results (Table 2) indicate thatW.trilobatais tolerant of Cu pollution [51].
Finally, we put forward a perspective that the field investigation still needs to be further done for model validation. The published results [22–25] and the present study showed that the pollution factor could affect the PI curve in controlled experiment. In natural environment, many other uncontrolled variables such as temperature, humidity, CO2concentrations and so on, can also affect photosynthetic parameters. Therefore, it is important to justify and reveal the accuracy of the NIMM in practice.
Supporting Information
S1 Table. Effect of Pb2+on the Pn ofZea mays. (DOCX)
S2 Table. Effect of Cu2+on the PnofCitrus sinensisOsbeck. (DOCX)
S3 Table. Effect of Cd2+on the PnofZea mays. (DOCX)
S4 Table. Effect of Al3+on the PnofPlantago asiatica. (DOCX)
Table 5. Model testing results of the un-competitive inhibited and the competitive inhibited model.
Model type
Concentrationof phenol (mg kg-1)
Calculated equation Measured Pm(μmol
CO2m -2
s-1)
Calculated Pm(μmol
CO2m -2
s-1)
PARcom(μmol m-2photon
s-1)
PARsat(μmol photon m-2
s-1)
φc φ0 R2
UIMM
0 Pn¼0:081 ð1 0:0002PARÞ PAR
1þ0:0021PAR 1:56 19.5 19.4 19.3 1171.0 0.078 0.085 0.9877***
100 Pn¼0:081 ð1 0:0002PARÞ PAR
1þ0:0030PAR 1:56 15.0 14.6 19.3 1038.0 0.076 0.086 0.9851***
200 Pn¼0:081 ð1 0:0002PARÞ PAR
1þ0:0038PAR 1:56 11.3 12.0 19.3 956.0 0.075 0.087 0.9520***
300 Pn¼0:081 ð1 0:0002PARÞ PAR
1þ0:0047PAR 1:56 10.9 9.9 19.3 887.0 0.074 0.089 0.9079***
CIMM
0 Pn¼0:073 ð1 0:0003PARÞ PAR
1þ0:0015PAR þ0:006 19.5 20.4 0.008 966.3 0.073 0.073 0.9650***
100 Pn¼0:073 ð1 0:0003PARÞ PAR
1:70þ0:0015PAR þ0:006 15.0 16.8 0.014 1143.6 0.043 0.043 0.8973***
200 Pn¼0:073 ð1 0:0003PARÞ PAR
2:40þ0:0015PAR þ0:006 11.3 13.6 0.020 1220.1 0.030 0.030 0.8155***
300 Pn¼0:073 ð1 0:0003PARÞ PAR
3:13þ0:0015PAR þ0:006 10.9 12.2 0.026 1318.8 0.023 0.023 0.7567***
UIMM is the un-competitive inhibited Michaelis-Menten; CIMM is the competitive inhibited Michaelis-Menten; PARsatis the light saturation point; PARcomis
the light compensation point; Pmis the maximum photosynthetic rate;φcis the quantum efficiency at PARcom;φ0is the intrinsic quantum efficiency; PARcom¼Rda,φ0=α[1+(β+γ)PARcom],φc¼a
1þðbþgÞ PARcom bgPAR2 com
ð1þgPARcomÞ2 ,PARsat¼
ffiffiffiffiffiffiffiffiffiffiffiffiffiffiffiffiffiffiffiffiffiffiffiffiffi ðbþgÞ ð1þgPARcomÞ
b
p
1
g ,Pm¼
a ð1bPARsatÞ PARsat 1þgPARsat Rd;
S5 Table. Effect of phenol on the Pn ofTrifolium pratenseL. (DOCX)
S6 Table. Effect of CuSO45H2O on the Pn ofWedelia trilobata.
(DOCX)
S7 Table. Effect of Cu2+onW.trilobata. (DOCX)
S8 Table. Effect of phenol onT.pratenseL. (DOCX)
Acknowledgments
We would like to thank Meifang Jin, Qiaoli Zeng and Jiahui Kang, Fuqing Branch of Fujian Normal University, for their help in experiment. We are grateful to the three anonymous reviewers and the academic editor for their comments that helped us improve the submitted manuscript.
Author Contributions
Conceived and designed the experiments: ML DC GW. Performed the experiments: ML DC. Analyzed the data: ML ZW LH KX DC GW. Contributed reagents/materials/analysis tools: ML DC GW. Wrote the paper: ML ZW LH KX DC GW. Designed the software language used in analysis: ML.
References
1. Jassby AD, Platt T. Mathematical formulation of the relationship between photosynthesis and light for phytoplankton. Limnol Oceanogr. 1976; 21: 540–547.
2. Perry MJ, Talbot MC, Alberte RS. Photoadaptation in marine phytoplankton: response of the photosyn-thetic unit. Mar Biol.1981; 62: 91–101.
3. Dubinsky Z, Falkowski PG, Wyman K. Light harvesting and utilization by phytoplankton. Plant and Cell Physiol. 1986; 27: 1335–1350.
4. Platt T, Harrison WG, Horne EPW, Irwin B. Carbon fixation and oxygen evolution by phytoplankton in the Canadian high arctic. Polar Biol.1987; 8: 103–114.
5. Cullen JJ, Yang X, MacIntyre HL. Nutrient limitation and marine photosynthesis. In: Falkowski PG, Woodhead AD, editors. Primary productivity and biogeochemical cycles in the sea. New York: Plenum Press; 1992. pp. 69–88.
6. Lindley ST, Bidigare RR, Barber RT. Phytoplankton photosynthesis parameters along 140 degrees W in the equatorial Pacific. Deep Sea Res II.1995; 42: 441–463.
7. Johnson Z. Regulation of marine photosynthetic efficiency by photosystem II. PhD Thesis, Duke Uni-versity. 2000. pp. 14.
8. Steele JH. Environmental control of photosynthesis in the sea. Limnol Oceanogr. 1962; 7: 137–150. 9. Platt T, Denman KL, Jassby AD. The mathematical representation and prediction of phytoplankton
pro-ductivity. Fish Mar Serv. 1975; 523: 110.
10. Webb WL, Newton M, Starr D. Carbon dioxide exchange ofAlnusrubra: A mathematical model. Oecolo-gia. 1974; 17: 281–291.
11. Marshall B, Biscoe PV. A model for C3leaves describing the dependence of net photosynthesis on
irra-diance. I. Derivation. J Exp Bot. 1980; 31: 29–39.
12. Marshall B, Biscoe PV. A model for C3 leaves describing the dependence of net photosynthesis on irra-diance. II. Application to the analysis of flag leaf photosynthesis. J Exp Bot. 1980; 31: 41–48.
13. Liu YF, Xiao LT, Tong JH, Li XB. Primary application on the non-rectangular hyperbolamodel for photo-synthetic light-response curve. Chin Agr Sci Bull. 2005; 121: 76–79 (in Chinese with English abstract). 14. Ye ZP. A new model for relationship between irradiance and the rate of photosynthesis inOryza sativa.
15. Björkman O. Environmental and biological control of photosynthesis: In augural address. In: Marcelle R, editor. Environmental and biological control of photosynthesis. The Hague: Dr. W. Junk, Publ., 1975, pp. 1–16.
16. Tayor RJ, Pearcy RW. Seasonal patterns of the CO2exchange characteristics of understory plants
from a deciduous forest. Can. J. Bot. 1976; 54: 1094–1103.
17. Baly EC. The kinetics of photosynthesis. Proc Roy Soc London B.1935; 117: 218–239.
18. Kyei-boahen S, Lada R, Astatkie T, Gordon R, Caldwell C. Photosynthetic response of carrots to vary-ing irradiances. Photosynthetica. 2003; 41: 301–305.
19. Thornley JMH. Photosynthesis. In: Sutcliffe JF, Mahlberg P, editors. Mathematical models in plant physiology. London: Academic Press; 1976. pp. 11–14,92–110.
20. Thornley JHM. Dynamic model of leaf photosynthesis with acclimation to light and nitrogen. Ann Bot. 1998; 81: 421–430.
21. López-Urrutia Á, Martin ES, Harris RP, Irigoien X. Scaling the metabolic balance of the oceans. Proc Natl Acad Sci USA. 2006; 103: 8739–8744. PMID:16731624
22. Yao G, Gao HY, Wang WW, Zhang LT, Bu JW. The effects of Pb-stress on functions of photosystems and photosynthetic rate in maize seedling leaves. Acta Ecol Sin. 2009; 29: 1162–1169 (in Chinese with English abstract).
23. Zhang GJ, Jiang H, Zheng LQ, Chen J, Qiu DL, Liu XH. Effect of copper stress on photosynthesis of navel orange seedlings. Chin J Eco-Agric.2009; 17: 130–134 (in Chinese with English abstract). 24. Hui JA, Dang Z, Ye QS. Influence of cadmium stress on photosynthetic characteristics of maize.J
Agro-Environ Science.2010; 19: 205–210 (in Chinese with English abstract).
25. Xiao YA, Li XH, Li Y, Zeng JJ, Hu XH, Ju JW, et al. Effects of aluminum stress on photosynthetic physio-logical characteristics of Plantago asiatica. J Jinggangshan U. 2010; 31: 48–52 (in Chinese with English abstract).
26. Kidd P, Barcelób J, PilarBernalc M, Navari-Izzo F, Poschenrieder C, Shilev S, et al. Trace element behaviour at the root-soil interface: Implications in phytoremediation. Environ Exp Bot. 2009; 67: 243– 259.
27. Cai QY, Mo CH, Wu QT, Zeng QY, Katsoyiannis A. Concentration and speciation of heavy metals in six different sewage sludge-composts. J Hazard Mat. 2007; 147: 1063–1072.
28. Zhang SQ, Zhang FD, Liu XM, Wang YJ, Zou SW, He XS. Determination and analysis on main harmful composition in excrement of scale livestock and poultry feedlots. Plant Nutr Fertilizer Sci.2005; 11: 822–829 (in Chinese with English abstract).
29. Michaelis L, Menten ML. Die Kinetik der Invertinwirkung. Biochem Z. 1913; 49: 333–369. 30. Berg JM, Tymoczko JL, Stryer L. Biochemistry. New York: WH Freeman; 2002.
31. Akaike H. A new look at the statistical model identification. IEEE Trans Automat Contr. 1973; 19:716– 723.
32. Yamaoka K, Nakagawa T, Uno T. Application of Akaike's Information Criterion (AIC) in the Evaluation of Linear Pharmacokinetic Equations. J Pharmacokinet Biopharm. 1978; 6: 165–175. PMID:671222 33. Fu WG, Li PP, Bian XM, Wu YY, Cao QY. Diurnal photosynthetic changes of Phragmites communis in
the wetland lying in Beigushan mountain of Zhenjiang prefecture. Acta Bot Boreal Occident Sin. 2006; 26: 0496–0501 (in Chinese with English abstract).
34. Marschall M, Proctor CF. Are bryophytes shade plants? Photosynthetic light responses and proportions of chlorophyll a, chlorophyll b and total carotenoids. Ann Bot. 2004; 94: 593–603. PMID:15319230 35. Leverenz JW, Jarvis PG. Photosynthesis in Sitka spruce VIII. The effects of light flux density and
direc-tion on the rate of photosynthesis and the stomatal conductance of needles. J Appl Ecol. 1979; 16: 919–932.
36. Farquhar GD, Caemmerer SV, Berry JA.A biochemical model of photosynthetic CO2assimilation in
leaves of C3species. Planta. 1980; 149: 78–90. doi:10.1007/BF00386231PMID:24306196
37. Ögren E. Convexity of the photosynthetic light-response curve in relation to intensity and direction of light during growth. Plant Physiol. 1993; 101: 1013–1019. PMID:12231754
38. Prioul JL, Chartier P. Partitioning of transfer and carboxylation components of intracellular resistance to photosynthetic CO2fixation: A critical analysis of the methods used. Ann Bot. 1977; 41: 789–800.
39. Baker AJM, Brooks RR. Terrestrial higher plants which hyperaccumulate metallic elements-a review of their distribution, ecology and phytochemistry. Biorecovery.1989; 1: 81–126.
41. Prasad MNV, Hagemeyer J. Heavy metal stress in plants: from molecules to ecosystems. Berlin: Springer; 1999.
42. Joshi MK, Mohanty P. Chlorophyll a fluorescence as a probe of heavy metal ion toxicity in plants. In: Papageorgiou GC, Govindjee, editors. Chlorophyll a fluorescence: a signature of photosynthesis. Dor-drecht: Springer; 2004. pp. 637–661.
43. Küpper H, Kroneck PMH. Heavy metal uptake by plants and cyanobacteria. In: Sigel A, Sigel H, Sigel RKO, editors. Metal ions in biological systems. New York: Marcel Dekker;2005. pp. 97–142. PMID:
15971666
44. Stobart AK, Griffiths WT, Ameen‐Bukhari I, Sherwood RP. The effect of Cd2+on the biosynthesis of
chlorophyll in leaves of barley. Physiol Plant. 1985; 63: 293–298.
45. Padmaja K, Prasad D, Prasad A. Inhibition of chlorophyll synthesis inPhaseolus vulgarisL. seedlings by cadmium acetate. Photosynthetica.1990; 24: 399–405.
46. Böddi B, Oravecz A, Lehoczki E. Effect of cadmium on organization and photoreduction of protochlor-phyllide in dark-grown leaves and etioplast inner membrane preparations of wheat. Photosynthetica. 1995; 31: 411–420.
47. Krupa Z. Cadmium-induced changes in the composition and structure of the light-harvesting chlorophyll a/b protein complex II in radish cotyledons. Physiol Plant.1987; 73: 518–524.
48. Horváth G, Droppa M, Oravecz Á, Raskin VI, Marder JB. Formation of the photosynthetic apparatus during greening of cadmium-poisoned barley leaves. Planta.1996; 199: 238–243.
49. Küpper H, Küpper F, Spiller M. In situ detection of heavy metal substituted chlorophylls in water plants. Photosynth Res.1998; 58: 123–133.
50. Baryla A, Carrier P, Franck F, Coulomb C, Sahut C, Havaux M. Leaf chlorosis in oilseed rape plants (Brassica napus) grown on cadmium-polluted soil: causes and consequences for photosynthesis and growth. Planta.2001; 212: 696–709. PMID:11346943