Article
Chemical analysis of potable water samples from selected suburbs of Accra,
Ghana
E.T. Gyamfi1, M. Ackah1, A. K. Anim1, J. K. Hanson1, L. Kpattah1, S. Enti-Brown1, Y. Adjei-Kyereme2, E. S. Nyarko1
1
Nuclear Chemistry and Environmental Research Centre, National Nuclear Research Institute, Ghana Atomic Energy Commission. Kwabenya, Accra, Ghana
2
Nuclear and Radioactive Waste Management Centre, National Nuclear Research Institute, Ghana Atomic Energy Commission. Kwabenya, Accra, Ghana
E-mail: [email protected]
Received 7 August 2011; Accepted 10 September 2011; Published online 5 June 2012 IAEES
Abstract
A study was carried out to assess the suitability of potable water used for domestic activities in twelve selected suburbs in Accra. Several water quality parameters such as temperature, pH, electrical conductivity (EC), total
dissolved solids (TDS), salinity and redox potential (eh) were measured. The results of the physical parameters revealed the following: temperature range of 25.2oC - 26.2oC, pH range of 6.64-7.80, conductivity range of 187-725 µS/cm, total dissolved solids, 90-352 mg/L, total suspended solids 0-4 mg/L, bicarbonate, 68.27-121.91 mg/L, chloride, 11.996-343.89 mg/L, Phosphate, BDL-0.128 mg/L and sulphate, 0.08-0.40 mg/L. Copper and Manganese recorded concentrations below the WHO limits of 2mg/L and 0.01mg/L respectively.
Iron however recorded concentrations higher than WHO limits of 0.1mg/L. However, Cd, Pb, Cr and Co were below their respective detection limits.
Keywords potable water; Accra; trace metals.
1 Introduction
Potable water is the water of sufficiently high quality that can be consumed or used with low risk of immediate or long term harm. Water has always been an important and life-sustaining drink to humans and is essential to the survival of all organisms (Wateraid, 2008). Excluding fat, water composes approximately 70% of
the human body by mass. It is a crucial component of metabolic processes and serves as a solvent for many bodily solutes. Water is essential for the growth and maintenance of our bodies, as it is involved in a number
of biological processes. The amount of water needed varies with the individual, as it depends on the condition of the subject, the amount of physical exercise, and on the environmental temperature and humidity. An individual's thirst provides a better guide for how much water they require rather than a specific fixed quantity.
In terms of mineral nutrients intake, it is unclear what the drinking water contribution is. However, inorganic minerals generally enter surface water and ground water via storm water runoff or through
IAEES www.iaees.org some arthropods and desert animals, but provides only a small fraction of a human's necessary intake. Parameters for drinking water quality typically fall under two categories: chemical/physical and
microbiological (Ackah et al., 2011; Sayyed and Wagh, 2011; Tiwari, 2011). Chemical/physical parameters include heavy metals, trace metals, total suspended solids (TSS) and turbidity.
There are a variety of trace elements present in virtually all potable water, some of which play a role in
metabolism. Major ions in drinking water are correlated with palatable and unpalatable mineralization that affects the quality of drinking water (WHO, 2006; Delpla et al., 2009). Ca2+ and K+ are the most important components affecting the taste of water (Hashimoto et al., 1987), while high concentrations of Na make the water taste salty. The recommended dietary amounts for Mg2+ are 6 mg/kg per day, but excess Mg2+ makes water taste bitter (WHO, 2004). SO42- makes water taste unpalatable by decreasing the concentration of Ca2+ ,
which is essential for good tasting water. Elements such as Co, Cr, Fe, Mn, Mo, Ni, Se, Sn, V and Zn are essential for growth (Nkono and Asubiojo, 1997). However, at certain high concentrations they become toxic
to the human body. For instance, high Mn levels in drinking water have also been shown to affect intellectual functions in 10-year-old children in Araihazar, Bangladesh (Wasserman et al., 2006). Other elements, such as As, Bi, Cd, Hg, Pb, and Ti, have no apparent metabolic function and are termed non-essential elements. Some
are very toxic, such as As, Hg, Pb, Cr, and Cd (Barati et al., 2010; Mora et al., 2009).
Ghana is well endowed with water resources. The Volta river system basin, consisting of the
Oti, Daka, Pru, Sene and Afram rivers as well as the white and black Volta rivers, covers 70% of the country area. Another 22% of Ghana is covered by the south-western river system watershed comprising the Bia, Tano, Ankobra and Pra rivers. The coastal river system watershed, comprising the Ochi-Nawuka, Ochi
Amissah, Ayensu, Densu and Tordie rivers, covers the remaining 8% of the country. Statistics indicated that 62 percent of the Ghana’s population as at 2010 had access to potable drinking water (Ghana web).In
2000,total water withdrawal was 982 million m³, of which two thirds were used for agricultural purposes (Ghana web). Another 10% was withdrawn for industry, leaving 24% or 235 million m³ for domestic use (Ghana web). Furthermore, 37,843 km³ are used for hydroelectricity generation at the Akosombo dam each
year. The quantity of water available to Ghanaians has reduced to about a quarter of what was available in 1960, which had reduced from 3,709 gallons per head to 995 gallons, due to the rise in population. It is further
expected to shrink to a sixth by 2050. The deterioration of water quality and quantity has occurred as a result of the pollution of water sources by human activities such as illegal mining, bush burning, improper use of
agro-chemicals for farming and dumping of waste into or near water courses. According to one estimate, only a quarter of the residents in Accra receive continuous water supply, whereas approximately 30% are provided for 12 hours each day per five days in the week. Another 35% are supplied for two days each week. The
remaining 10% of urban residents who mainly live on the outskirts of Accra are completely without access to piped water (Wateraid, 2008). According to the water company Aqua Vitens Rand Ltd. (AVRL), a joint
venture of the Dutch Vitens Rand water services BV and Aqua Vitra Ltd., based in Accra, the situation is even worse: In February 2008, some communities within the Accra-Tema metropolis were served either once in a week, once in a fortnight or once in a month (AVRL: The Dodowa Intervention report). The lack of clean
drinking water and sanitation systems is a severe public health concern in Ghana, contributing to 70% of diseases in the country. Consequently, households without access to clean water are forced to use less reliable
and hygienic sources, and often pay more (Hall et al., 2008).
Accra is the capital town of Ghana as such it is expected that residents have access to potable water. As a result, water quality is of great concern. However, an extensive analysis has not been conducted to determine
for domestic use in certain areas in Accra. Parameters including the concentration of total dissolved inorganic major ions (Ca2+, K+, Mg2+, Na+, SO42-, HCO3-, PO43-,and Cl-), and trace heavy metals were determined to
assess the quality of water for consumption.
2 Material and Methods 2.1 Study area
The twelve suburbs selected in the Accra metropolis for this study was based on areas where potable water
supply is inadequate and or non-existence. In such cases, individuals arrange for their water supply from vendors who normally supply in tanks. These suppliers either do not disclose their source of water or may give wrong information to their clients. The study area falls within the Greater Accra Metropolitan Area (GAMA).
Accra, is located on latitude of 5.55 (5° 32' 60 N) and a longitude of 0.22 (0° 14' 60 W). The area is densely populated with population estimated to be around 3,909,764. The vegetation consists of the coastal savanna
grassland. The climate is hot and humid and reflects a bimodal rainfall pattern with a mean annual rainfall of about 1,300 mm. The mean daily temperature is 26 °C with a range of 18 °C–35 °C. The relative humidity can be as high as 97% in the mornings of wet seasons and as low as 20% in the afternoon of the dry seasons.
2.2 Sampling
To evaluate contamination of potable drinking water, water samples were collected during 2011. The samples
were collected into acid pre-cleaned high-density 1L polyethylene sampling bottles. Two sets of water samples were collected at each of the sampling points. One was for the measurement of anions. The other, for analysis of cations and trace elements was acidified with 1% nitric acid to discourage the formation of precipitates and
to keep the metal ions in the dissolved state. Temperature, pH, electrical conductivity, redox potential (eh), salinity and total dissolved solids measurements were conducted on site with a portable HACH conductivity
meter which was calibrated prior to taking of readings. The samples were kept over ice in an ice chest and transported to the inorganic laboratory of the National Nuclear and Environmental Research Center, Ghana Atomic Energy Commission for analysis.
2.3 Sample preparation and analysis
All chemicals and standards used during preparation and analysis were of the highest purity analytical grade
available. De-ionised water was used throughout the analysis wherever applicable. Alkalinity was determined by strong acid titration method. Calcium (Ca) was determined using the standard EDTA titrimetric methods according to APHA (1998). Zinc, Magnessium, Copper, Nickel, Cobalt, Chromium, Iron, Cadmium and Lead
were determined using Varian Fast Sequential Atomic Absorption Spectrometer (model AA 240FS). Total hardness was determined using standard EDTA titration with ammonia buffer and erichrome black ‘T’
indicator. The water samples for anion analysis were filtered using a hand operated vacuum pump equipped with a 0.45μm cellulose acetate filter membrane. Chloride determination was undertaken using the
argentometric method (APHA, 1998). Sulphate (SO42-) and phosphate (PO43-) were determined by UV
spectrophotometric method. Bicarbonate (HCO3-) determination was carried out using acid titration, with
methyl orange as indicator.
3 Results and Discussion
3.1 Physicochemical analysis
The physical and chemical parameters analysed in the water samples are shown in Table 1. pH lower than 4 will produce sour taste and higher value above 8.5 bitter taste. Dissolved gases such as carbon (IV) oxide,
IAEES www.iaees.org
6.64-7.81. Thus all the water samples measured pH values within the WHO (2004) limit of 6.5-8.5. The turbidity of all the water samples analysed ranged between 0-5 NTU .This falls within the WHO limit of 5
NTU. The turbidity in water is the reduction of transparency due to the presence of particulate matter such as clay or silt, finely divided organic matter, plankton or other microscopic organisms. Water samples with high turbidity presents colloidal materials which provides adsorption sites for chemicals that may be harmful or
cause undesirable tastes and odors. Turbidity may indicate the presence of disease causing organisms. These organisms include bacteria, viruses, and parasites that can cause symptoms such as nausea, cramps, diarrhea,
and associated headaches (US EPA 2003). The pH and turbidity of the water samples are therefore suitable for domestic use within WHO limits. The electric potentials were between -19 to -84 MV whiles the temperature ranged between 25.2-26.6 oC. Salinity of the water samples were high, measuring between 0.1 and 0.4. The colour ranged between 0-47 HU. 33.3 % of the water samples measured colour greater than the WHO limit of 15 HU. The highest colour of 47 HU was measured in the sample W.L. The high colour measured in some of
samples may due to dissolved components such as iron and manganese, humus, plankton, weeds and or industrial wastes.
The electrical conductivity of water relates to the total concentration of dissolved ions in water and the
temperature at which the measurement is taken. 100 % of the samples measured conductivities below the WHO (2003) limit of 1500 µS/cm. The conductivity ranged from 187.9 µS/cm to 725 µS/cm. The highest
conductivity, 725 µS/cm was measured for ASY.
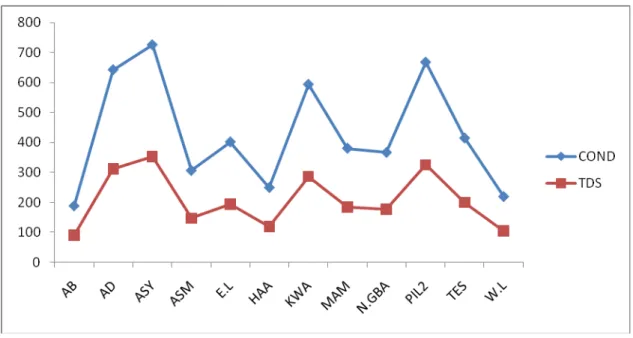
Total suspended solids ranged between 0 and 4. The highest value of 4 was measured in MAM. The total dissolved solids measured in the samples were all below the WHO (2003) limit of 1000 mg/l. The TDS ranged
from 90.2 mg/l (AB) to 352 mg/l (ASY). Many dissolved substances are undesirable in water. Dissolved minerals, gases and organic constituents may produce aesthetically displeasing colour, taste and odor. Some
dissolved organic chemicals may deplete the dissolved oxygen in the receiving waters. Fig. 1 shows a direct variation between TDS and conductivity for all the samples analysed.
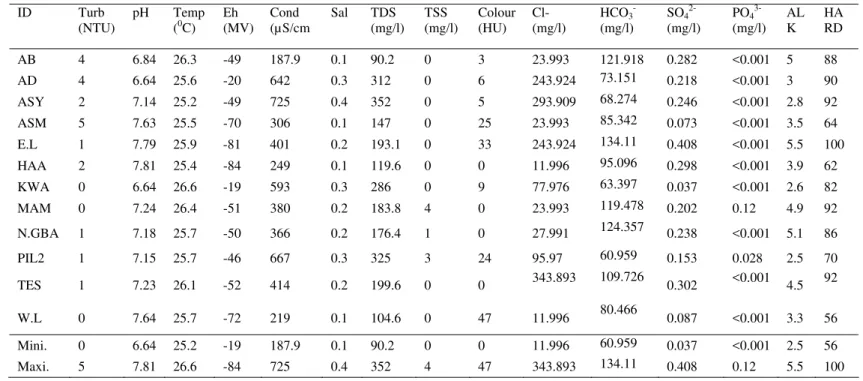
Table 1 Physicochemical parameters of the water samples ID Turb
(NTU)
pH Temp (0C)
Eh (MV) Cond (µS/cm Sal TDS (mg/l) TSS (mg/l) Colour (HU) Cl- (mg/l)
HCO3- (mg/l)
SO4 2-(mg/l)
PO43- (mg/l)
AL K
HA RD
AB 4 6.84 26.3 -49 187.9 0.1 90.2 0 3 23.993 121.918 0.282 <0.001 5 88
AD 4 6.64 25.6 -20 642 0.3 312 0 6 243.924 73.151 0.218 <0.001 3 90
ASY 2 7.14 25.2 -49 725 0.4 352 0 5 293.909 68.274 0.246 <0.001 2.8 92
ASM 5 7.63 25.5 -70 306 0.1 147 0 25 23.993 85.342 0.073 <0.001 3.5 64
E.L 1 7.79 25.9 -81 401 0.2 193.1 0 33 243.924 134.11 0.408 <0.001 5.5 100
HAA 2 7.81 25.4 -84 249 0.1 119.6 0 0 11.996 95.096 0.298 <0.001 3.9 62
KWA 0 6.64 26.6 -19 593 0.3 286 0 9 77.976 63.397 0.037 <0.001 2.6 82
MAM 0 7.24 26.4 -51 380 0.2 183.8 4 0 23.993 119.478 0.202 0.12 4.9 92
N.GBA 1 7.18 25.7 -50 366 0.2 176.4 1 0 27.991 124.357 0.238 <0.001 5.1 86
PIL2 1 7.15 25.7 -46 667 0.3 325 3 24 95.97 60.959 0.153 0.028 2.5 70
TES 1 7.23 26.1 -52 414 0.2 199.6 0 0 343.893 109.726 0.302 <0.001 4.5 92
W.L 0 7.64 25.7 -72 219 0.1 104.6 0 47 11.996 80.466 0.087 <0.001 3.3 56
Mini. 0 6.64 25.2 -19 187.9 0.1 90.2 0 0 11.996 60.959 0.037 <0.001 2.5 56
Fig. 1 Variation between Conductivity(µS/cm) and TDS(mg/l)
Alkalinity of water is its quantitative capacity to react with a strong acid to a designated pH. The alkalinity measured in the water samples were between 2.5 mg/l (PIL2) and 5.5 mg/l (E.L). Highly alkaline waters are
usually unpalatable. Excess alkalinity in water is harmful for irrigation which leads to soil damage and reduce crop yields. The alkalinity measured for all the samples were however far below the WHO limit of 200 mg/l. Hardness of water is caused by the presence of multivalent metallic cations and is largely due to calcium,
Ca++, and magnesium, Mg++ ions. Hardness is reported in terms of CaCO3. Hardness is the measure of
capacity of water to react with soap, hard water requiring considerably more soap to produce lather. It is not
caused by single substance but by a variety of dissolved polyvalent metallic ions, predominantly calcium and magnesium cations.
The hardness measured in the water samples were rather low, ranging between 56 mg/l and 100 mg/l. The
measured values were all below the WHO limit of 500 mg/l. The low and high value of Hardness has advantages and disadvantages. Absolutely soft waters are tasteless, corrosive and have the property of
dissolving metals in solution. Moderately hard water is preferred to soft water for irrigation purposes. Based on the WHO limits, the alkalinity and hardness of the water samples from the selected areas can be considered to be safe.
Inorganic phosphate occurs naturally in water and often in high amounts during periods of low biological productivity. The water samples analysed phosphate concentrations measuring between <0.001 (detection limit)
and 0.12 mg/l. Only 16.66 % of the samples analysed had detectable amounts of phosphate. 0.12 mg/l was measured in MAM whilst 0.028 mg/l was measured in PIL2. Apart from natural sources, waters receiving sewage, agricultural runoff and certain industrial discharges normally contain significant concentrations of
phosphate.
The presence of high levels of sulphate in water may contribute to the corrosion of distribution system.
IAEES www.iaees.org
Chloride is one of the major inorganic anion in water. In potable water, the salty taste is produced by the chloride concentrations. There is no known evidence that chlorides constitute any human health hazard. For
this reason, chlorides are generally limited to 250 mg/l in supplies intended for public use (WHO). The chloride levels measured in the water samples ranged between 11.996 mg/l (W.L) and 343.893 mg/l (TES). 83.33 % of the samples analysed however, measured chloride levels below the WHO limit.
Chloride and HCO3- were by far the dominant anions in all the water samples. However, 58.33 % of the
water samples measured HCO3- dominance. The HCO3- concentrations ranged from 68.274 mg/l to 121.918
mg/l. The highest HCO3- concentration, 121.918 mg/l was measured for E.L.
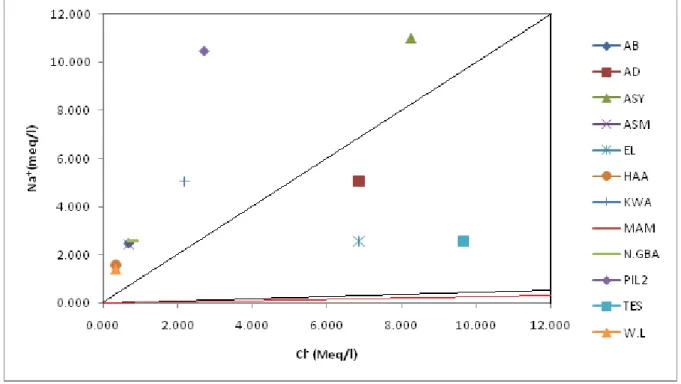
Relationship between Cl- and Na+ shows that the majority of the samples are near the sea water line, suggesting a marine contribution to the water composition (Fig. 2). Accra is bounded southwards by the Gulf
of Guinea, thus sea spray into surface waters is likely to be the source of Cl- in 75 % of the water samples. Fig. 2 therefore suggests that samples; TES, AD and EL had their chloride content from human sources.
Fig. 2 Cl- versus Na+ Ca2+ + Mg2+ and HCO3- concentrations were higher for AB and PIL2 , consistent with deep, old waters thus suggesting groundwater source for AB snd PIL2 (Fig. 3). Fig.3 further indicates that 83.33 % of the water samples were young waters, probably surface waters.
3.2 Trace metals
The trace metals analysed in the water samples are shown in Table 2. It is interesting to note that the water sample W.L measured the least concentrations of 32 mg/l (Na), 2 mg/l (K), 0.036 mg/l (Mn), and 14.4 mg/l (Ca) whiles the water sample ASY measured the highest concentrations of 253 mg/l (Na), 15.9 mg/l (K), 1.876
mg/l (Zn), 2.592 mg/l (Ni), 0.308 mg/l (Cu) and 3.368 mg/l (Fe). From Fig. 3, ASY is classified as groundwater hence the higher concentrations of trace metals may be due to water-rock interactions whiles the
surface water (Fig. 3). The concentrations of the trace metals Cd, Pb, Cr and Co were below their respective detection limits of <0.002, <0.01, <0.001, and <0.005.
Fig. 3 HCO3- versus Ca2+ + Mg2+
Sodium and potassium have no health implications and the levels obtained were of acceptable limits for drinking water. The sodium ion is ubiquitous in water. The concentrations of Na in the samples ranged
between 32 mg/l and 253 mg/l. Most water supplies contain less than 20 mg of sodium per liter, but in some countries levels can exceed 250 mg/liter (WHO, 2003).
Potassium is an essential element in plant, animal and human nutrition (Lewis, 1997). In humans,
potassium ions play a critical role in many vital cell functions, such as metabolism, growth, repair and volume regulation, as well as in the electric properties of the cell (Adriogue and Wesson, 1994). Potassium
concentrations range between 2 mg/l and 15.9 mg/l. The Ca concentrations were between 14.4 mg/l and 43.2 mg/l. Calcium is a major constituent of various types of rock. It is one of the most common constituents
present in natural waters ranging from zero to several hundred milligrams per liter depending on the source and treatment of the water. Calcium is a cause for hardness in water and incrustation in boilers. Magnesium is a common constituent in natural water. Magnesium salts are important contributors to the hardness of water
which break down when heated, forming scale in boilers. Mg concentrations ranged between zero to 5.443 mg/l. Chemical softening, reverse osmosis, electro dialysis, or ion exchange reduces the magnesium and
associated hardness to acceptable levels.
Copper is found mainly as a sulphide, oxide, or carbonate in the minerals. Copper enters the water system through mineral dissolution, industrial effluents, because of its use as algicide and insecticide and through
corrosion of copper alloy water distribution pipes. It may occur in simple ionic form or in one of many complexes with groups, such as cyanides, chlorides, ammonia or organic ligands. Cu concentrations were
IAEES www.iaees.org
maximum (WHO). The tests for copper is essential because of dissolved copper salts even in low concentrations are poisonous to some biota.
The intake of manganese can be high as 20 mg/day without apparent ill effects. All the water samples measured Mn levels below the WHO limit. The concentrations were between 0.036 mg/l and 0.152 mg/l. It should be noted that manganese may be objectionable to consumers if it is deposited in water mains and causes
water discoloration. Although concentrations below 0.5 mg/l (WHO) are usually acceptable to consumers, this may vary with local circumstances.
Zinc is an essential and beneficial element in body growth. The levels of Zn measured in all the samples were below the WHO limit of 3.0 mg/l. The concentrations were between 0.108 mg/l and 1.876 mg/l. Very high Concentrations may cause a bitter taste and opalescence in alkaline water. Zinc most commonly enters the
domestic supply from deterioration of galvanized iron and dezincification of brass. Zinc in water may also come from anthropogenic water pollution. The concentrations of Ni measured in the samples ranged from
<0.001 to 2.592 mg/l
The concentration of Fe in all the samples were higher than the WHO limit of 0.1 mg/l. Concentrations measured were between 1.076 mg/l and 3.368 mg/l. Anaerobic ground waters may contain Fe2+ at concentrations up to several milligrams per liter without discoloration or turbidity in the water when directly pumped from a well.
Table 2 Concentrations (mg/l) of trace metals in the water samples analysed
Iron is an essential element in human nutrition. Estimates of the minimum daily requirement for iron
quantities. Long time consumption of drinking water with a high concentration of iron can lead to liver diseases (hemosiderosis). Iron also promotes the growth of iron-bacteria. This gives a rusty appearance to the
waters. Colonies of these bacteria may also form a slime which causes problems in water closets, pipes, pumps and distribution system. High concentration of iron in water is not suitable for processing of food, beverages, ice, dyeing, bleaching and many other items. Water with high concentration of the iron when used in
preparation of tea and coffee, interacts with tanning giving a black inky appearance with a metallic taste.
4 Conclusion
The results of the study shows that the water supplied to the selected suburbs of Accra were either surface water or groundwater. The physicochemical parameters as well as the trace metals indicated that the water
samples were safe for consumption and domestic use. The levels of iron and chloride were greater than the WHO limit. The pH’s of all the samples were within the WHO limit of 6.5-8.5.
In order to ensure improvement in the quality and quantity of water resources in Accra, there is the need for sustainable and pragmatic measures and actions is put in place by the responsible authorities in the water sector in Ghana. It is recommended that stakeholders such as the Ghana Water Company Limited and
Community Water and Sanitation Agency put in suitable measures or programmes to ensure that the quality of water supplied to residents meets National and International Standards.
References
Ackah M, Agyemang O, Anim AK, et al. 2011. Assessment of groundwater quality for drinking and irrigation:
the case study of Teiman-Oyarifa Community, Ga East Municipality, Ghana. Proceedings of the International Academy of Ecology and Environmental Sciences, 1(3-4): 186-194
Adriogué HJ, Wesson DE. 1994. Blackwell’s Basics of Medicine: Potassium. Blackwell Scientific Publications, Boston, MA, USA
APHA. 1998. Standard Method for the Examination of Water and Wastewater (20th ed). American Public Health Association, Washington, USA
Barati AH, Maleki A, Alasvand M. 2010. Multitrace elements level in drinking water and the prevalence of
multi-chronic arsenical poisoning in residents in the west area of Iran. Science of the Total Environment, 408(7): 1523-1529
Delpla I, Jung AV, Baures E, et al. 2009. Impacts of climate change on surface water quality in relation to
drinking water production. Environmental International, 35: 225-1233 Ghana Web- Water Supply and Sanitation in Ghana. Ghana.
Greenhalgh. 2001. Healthy Living-water’. BBCHealth. UK.
Lewis RJ. 1997. Hawley’s Condensed Chemical Dictionary (13th ed). Van Nostrand Reinhold, New York, USA
Mora A, Mac-Quhae C, Calzadilland M, et al. 2009. Survey of trace metals in drinking water supplied to rural populations in the eastern Llanos of Venezuela. Journal of Environmental Management, 90: 752-759
Nkono NA, Asubiojo OI. 1997. Trace elements in bottled and soft drinks in Nigeria-a preliminary study. Science of the Total Environment, 208(3): 161-163
Sayyed MRG, Wagh GS. 2011. An assessment of groundwater quality for agricultural use: a case study from
IAEES www.iaees.org
Tiwari RN. 2011. Assessment of groundwater quality and pollution potential of Jawa Block Rewa District, Madhya Pradesh, India. Proceedings of the International Academy of Ecology and Environmental Sciences,
1(3-4): 202-212
Wasserman GA, Liu X, Parvez F, et al. 2006. Water manganese exposure and children’s intellectual function in Araihazar, Bangladesh. Environmental Health Perspectives, 114: 124-129
Wateraid. 2008. National Water Sector Assessment. Ghana. WHO. 2003. Guidelines for drinking-water quality. 23(11): 145-196
WHO. 2004. Guidelines for Drinking-water Quality. Vol 1: Recommendations (3rd ed). Geneva, Switzerland WHO. 2006. Guidelines for drinking-water quality-first addendum to 3rd ed. Vol. 1: Recommendations.