Artigo
*e-mail: [email protected]
DETERMINATION OF CHEMICAL ELEMENTS IN AFRICANIZED Apis mellifera (HYMENOPTERA: APIDAE)
HONEY SAMPLES FROM THE STATE OF PIAUÍ, BRAZIL
Geni da Silva Sodré
Universidade Federal da Bahia, Salvador - BA, Brasil Luís Carlos Marchini*
Departamento de Entomologia, Fitopatologia e Zoologia Agrícola, Escola Superior de Agricultura “Luíz de Queiroz”, Universidade de São Paulo, Av. Pádua Dias, 11, 13418-900 Piracicaba – SP, Brasil
Orgeda Luiza Araújo Domingues Zucchi
Departamento de Física e Química, Faculdade de Ciências Farmacêuticas de Ribeirão Preto, Universidade de São Paulo, Ribeirão Preto – SP, Brasil
Virgilio Franco Nascimento Filho
Centro de Energia Nuclear na Agricultura, Universidade de São Paulo, Piracicaba – SP, Brasil Ivani Pozar Otsuk and Augusta Carolina de Camargo Carmello Moreti
Instituto de Zootecnia, Agência Paulista de Tecnologia dos Agronegócios, Secretaria Estadual de Abastecimento, Nova Odessa - SP, Brasil
Recebido em 28/6/06; aceito em 30/8/06; publicado na web em 27/4/07
Honey is a food used since the most remote times, appreciated for its characteristic flavor, considerable nutritional value and medicinal properties; however, little information exists about the presence of chemical elements in it. The objectives of this work were to determine the chemical elements present in 38 honey samples, collected directly from beekeepers from the State of Piauí, Brazil and to verify whether they presented any contamination. The chemical elements were determined by means of Total Reflection X-ray Fluorescence. The means of three replicates were: K (109.671 ± 17.487), Ca (14.471 ± 3.8797), Ti (0.112 ± 0.07), Cr (0.196 ± 0.11), Mn (0.493 ± 0.103), Fe (1.722 ± 0.446), Co (0.038), Ni (0.728 ± 0.706), Cu (0.179 ± 0.0471), Zn (0.967 ± 0.653), Se (not detected), Br (not detected), Rb (0.371 ± 0.097), Sr (0.145 ± 0.45), Ba (11.681), Hg (not detected), and Pb (0.863) µg g-1.
Keywords: honey; africanized honey bee; chemical elements.
INTRODUCTION
Different chemical elements are normally found in honey; however, at high rates they are considered pollutants. Honey can become contaminated with such pollutants by means of the air, soil, and water. Therefore, analyzing chemical elements in this product can provide information with regard to its quality as food or with respect to environmental pollution1.
Accidental honey contamination comes from several sources, such as: residues of drugs used in bee disease treatment, which are administered orally, mixed with a sugar syrup and pesticide residues, particularly organochlorine and organophosphorus insecticides2. Landfills visited by bees can be sources of honey contamination by chemical pollutants.
Among the most dangerous pollutants, toxic chemical elements have been prioritized in studies. The most important are: cadmium, mercury, lead, copper, zinc, and nickel, which are present at low concentrations in the essential functions of living systems, but may become toxic when found above normal levels, depending on the type of organism exposed3 . The same author has mentioned that a particu-lar property of toxic chemical elements is that they are continually emitted from natural sources in the terrestrial and marine environments. Tong et al.4 reported that sources of air and water pollution by toxic chemical elements and other chemical elements include industries, mining, energy generation, and automobile exhaust. According to the above mentioned authors, mining pollution in a
particular site may be limited to one or other chemical element, but contamination by industries or from energy generation includes a large number of toxic chemical elements or a combination of these. Intolerable limits of elements emitted from fuel oil or other urban traffic sources include: aluminum, calcium, copper, iron, lead, magnesium, silicon, barium, cadmium, chromium, nickel, palladium, platinum, and others which in certain regions are detrimental to health. Toxic chemical elements form the only group of non-biodegradable environmental pollutants, reaching man by means of foods and consumption water. Although a fraction of the ingested amount is excreted, they possess a pronounced tendency for accumulation in man’s vital organs, progressively exerting a toxic action for long periods, which also depends on their total accumulated dose, which in turn varies as a function of exposure time5.
Scientific papers using bees and their products, including analysis of chemical elements in order to monitor environmental pollution have been developed in several countries. Since 1970, honey has been proposed as an environmental indicator for pollution evaluation in areas where hives are installed6.
EXPERIMENTAL
Thirty-eight samples of honey produced by Apis mellifera L., 1758 (Hymenoptera: Apidae) were collected in the period from February to August 2002, directly from beekeepers of different municipalities in the State of Piauí (Pimenteiras 2 samples; Picos 35 samples; Socorro do Piauí 1 sample).
The analyses for honey chemical elements were carried out at the Apiculture Laboratory of “Departamento de Entomologia, Fitopatologia e Zoologia Agrícola of Escola Superior de Agricul-tura Luiz de Queiroz”, Campus of “Universidade de São Paulo” (ash determination) and at the Nuclear Instrumentation Laboratory of “Centro de Energia Nuclear na Agricultura/Universidade de São Paulo”, in Piracicaba, State of São Paulo, Brazil.
Initially, honey ash was obtained by burning approximately 10 g of the sample in a porcelain crucible by calcination in a muffle at 550oC until constant weight; ash percentage was thus calculated7. The ash samples were submitted to wet digestion8in an open system using HNO3/H2O2(t = 130 ± 5 °C). After obtaining a clear solution, the volume was completed to 10 mL with deionized water. Ten µL Ga (internal standard, 1000 µg mL-1) were added to a volu-me of 1 mL of this solution. A 20 µL aliquot was pipetted onto the center of a Lucite disc (3 cm in diameter) and dried under the action of infrared light. The samples were prepared with three replicates and detected in an X-ray spectrometer for 300 s.
Data analysis
The data were processed using SAS9 ; the means (three replicates), confidence interval, and multivariate analysis were thus obtained.
Analysis of principal components was used to evaluate the importance of each chemical element studied on total available variation10. This technique is based on the standardization and rotation of orthogonal axes (chemical elements), generating a new set of coordinates (principal components) not correlated among themselves11. Highly correlated characters were discarded, using the criterion proposed by Joliffe12, disregarding the variable with the highest coefficient in each component with an eigenvalue lower than 0.70.
The mean Euclidean distance and the UPGMA method (unweighted pair-group average) from the standardized data were used in the cluster analysis13.
RESULTS AND DISCUSSION
The values corresponding to the chemical element concentrations analyzed in 38 samples of honey produced by Apis mellifera, from different municipalities in the State of Piauí are presented in Table 1 and the botanical origin of them, in the Table 2.
Most mean values for chemical elements obtained in honey samples from the State of Piauí conform to Brazilian law14,15 (Tables 1 and 3). However, samples that do not conform to Brazilian law (samples nos. 4, 18, 24, 29, and 37) can be observed in Table 1.
In the present study, a variation from 0.038 to 0.412 µg g-1 was verified for the element Cr, and it was observed that 13.15% of samples (samples numbers. 4, 18, 24, 29, and 37) are above the established value, since Brazilian law has set a maximum value of 0.10µg g-1. Morse and Lisk16 analyzed honey samples from several different countries and verified Cr values ranging from 0.843 to 2.67µg g-1; Caroli et al.6,17, on the other hand, found in Italian honeys, values between 1.03 and 3.93 µg g-1, which are well above those found in the present study.
For element Ni, a value of 7.19 µg g-1 was verified in one sample (sample number 24) (2.63% over the total), which is therefore above
the maximum allowed by law, 5 µg g-1 at most. A maximum value of 7 µg g-1 was verified by Kump et al.18 in Slovenia honeys, similarly to the value verified in the present study.
The high Cr, Ni, and Pb concentrations in the analyzed samples may indicate a possible environmental contamination according to papers by Tong et al.4 in U.S.A., Merin et al.19 in Israel and Braziewiez et al.20 in Poland. According to Morse and Lisk16, the presence of high contents of Cd, Cr, Co, Fe, Ni, Zn, and Pb in honey samples of several nations, may have as their source a galvanized steel container used in the processing and storage of this product. Tong et al.4 observed that the U.S.A. honeys that came into contact with metal containers during processing showed high zinc contents.
Cu was found at a mean value of 0.179 µg g-1 (0.007 to 0.908 µg g-1). The value established by Brazilian law for this element is 10.00 µg g-1 maximum; thus, all samples analyzed are in conformity with the law. Values near those in the present study were verified by Marchiniet al.21 in honey samples from the State of São Paulo; that author obtained values from 0.1 to 2.0 µg g-1 for wild flower honey samples. In turn, Nanda et al.22 worked with honey of different floral sources from India, and verified Cu values ranging from 1.74 to 2.9 µg g-1, well above those in the present study.
The following values were obtained for the chemical elements K, Ca, Ti, Mn, Fe, Co, Br, Rb, Sr, Ba, and Hg, which are not covered by Brazilian law: K was the chemical element with the highest amount as compared with other elements. The mean value found was 109.671 µg g-1, varying from 2.180 to 204.77 µg g-1. Yilmaz and Yavuz23 analyzed honey samples from Turkey and observed a mean value of 296 µg g-1 for K, while Nanda et al.22 verified values varying from 489.52 to 932.56 µg g-1 in Indian honey, well above those observed in the Piauí samples.
An average of 14.471 µg g-1(0.385 to 76.759 µg g-1) was observed for element Ca, which ranked second in amount. Marchini et al.21 found higher values in honey from the State of São Paulo; Ca values varied from 55 to 301 µg g-1 for Eucalyptus flower honey, and from 1 to 202 µg g-1 for wild flower honey.
Element Ti was verified in 8 of the samples analyzed (3, 5, 14, 24, 25, 26, 28, and 29) and a mean value of 0.112 µg g-1 was observed (0.007 to 0.266 µg g-1). Tong et al.4 analyzed U.S.A. honey samples collected near mines, industries and highways, and verified Ti values ranging from 0.04 to 3.1 µg g-1; therefore, they obtained values well above those observed in the present study.
The mean amount of element Mn was 0.493 µg g-1 (0.014 to 1.434 µg g-1). Salinas et al.24 analyzed honey samples from Spain and determined a mean Mn value of 0.8 µg g-1; this mean is almost twice as high as that verified for the samples under study.
Fe had a mean value of 1.722 µg g-1 (0.067 to 7.053 µg g-1). Marchiniet al.21 verified values varying from 2.1 to 9.0 µg g-1 in Eucalyptus flower honey samples from the State of São Paulo; these values were a little higher than those verified in the present work. The element Co was verified in two samples (5.26%), with values of 0.037 µg g-1 (sample 14) and 0.039 µg g-1 (sample 24). A research developed by Morse and Lisk16 with honey samples from different countries found Co values varying from 0.456 to 0.770 µg g-1; these were therefore higher than those verified for Piauí samples.
The mean amount of Rb was 0.371 µg g-1(0.007 to 1.528 µg g-1). Iskander25 verified Rb values varying from 0.88 to 0.97 µg g-1, while Latorreet al.26 analyzed honey samples from Spain and evidenced a mean value of 1.5 µg g-1, near the upper limit of the amount observed in this work.
honey samples near mines, industries, and highways.
Ba was verified in a single sample (sample no. 2) (2.63% from total) (11.681 µg g-1). Lower values than those verified in this work were observed by Lasceve and Gonnet27 (0.005 to 0.4 µg g-1) in honey samples of France and Hungary.
Cluster analysis for chemical elements
In the principal components cluster analysis for 38 honey samples from the State of Piauí and for 14 chemical elements (Table 1), 12 were selected and 2 (Ni and Zn) were discarded, since they were highly correlated.
Variance estimate results (eigenvalues) are presented in Table 4. From Table 4 it can be observed that the first component concentrated 30.75% of total variance, the second 47.90%, the third 62.32%, and the fourth 76.41%. It is noted that four principal components were required to explain 70% of total available variance among chemical elements, and thus considerable variance
dispersion can be verified in the material studied.
Figure 1 show a phenogram prepared from the mean Euclidean distance and the UPGMA method, involving the 38 honey samples and chemical elements.
The criterion adopted to define groups was the linkage distances graph in the successive cluster analysis steps (Figure 2). This method is based on the identification of a plateau in the vertical direction, which means that many groups were formed at the same linkage distance; this distance is an optimal cutoff point on the phenogram and determines the number of groups formed. The cutoff point selected in this work was 18, represented by the horizontal line in Figure 1 and by the arrow in Figure 2.
From the phenogram (Figure 1) of samples studied, it can be observed that 9 groups were formed. Group 1 has 1 sample (Number 4); group 2 has 2 samples (Numbers. 32 and 27); group 3 has 2 samples (Numbers. 31 and 10); group 4 has 4 samples (Numbers 7, 16, 11, and 3); group 5 has 4 samples (Numbers. 33, 17, 30, and 14); group 6 has 12 samples (Numbers 35, 13, 37, 6, 5, 36, 34, 18, Table 1. Mean values (µg g-1) of chemical elements in 38 samples of Apis mellifera honey from different municipalities of the State of Piauí, Brazil
Sample K Ca Ti Cr Mn Fe Co Ni Cu Zn Se Br Rb Sr Ba Hg
1 40.145 3.874 nd nd 0.182 0.513 nd 0.021 0.055 0.206 nd nd 0.230 nd nd nd
2 131.354 11.997 nd nd 0.568 3.862 nd nd 0.082 10.756 nd nd 0.686 0.537 11.681 nd
3 159.004 18.775 0.266 nd 0.725 2.694 nd nd 0.125 0.683 nd nd 0.802 0.207 nd nd
4 163.979 76.759 nd 0.110 0.865 1.394 nd nd 0.241 0.487 nd nd 0.589 0.108 nd nd
5 144.347 21.208 0.242 nd 1.434 4.143 nd nd 0.209 0.679 nd nd 0.614 0.261 nd nd
6 140.359 16.698 nd nd 0.661 1.328 nd nd 0.258 0.398 nd nd 0.466 0.166 nd nd
7 161.322 30.020 nd nd 0.921 3.777 nd 0.144 0.311 0.663 nd nd 0.471 0.219 nd nd
8 58.209 12.425 nd nd 0.388 0.728 nd nd 0.130 3.907 nd nd 0.218 0.134 nd nd
9 123.960 10.949 nd nd 0.331 1.169 nd 3.241 0.908 6.838 nd nd 0.197 nd nd nd
10 174.743 18.663 nd nd 0.766 4.636 nd 0.075 0.254 1.387 nd nd 0.348 0.138 nd nd
11 163.952 19.569 nd nd 0.445 7.053 nd nd 0.228 0.783 nd nd 0.703 0.265 nd nd
12 46.870 9.587 nd nd 0.345 1.306 nd nd 0.163 0.356 nd nd 0.142 0.127 nd nd
13 138.434 19.627 nd nd 0.773 2.592 nd nd 0.193 0.490 nd nd nd nd nd nd
14 103.285 14.102 0.197 nd 0.371 2.003 0.037 0.021 0.183 0.241 nd nd 0.385 0.110 nd nd
15 123.649 15.680 nd nd 0.685 2.468 nd nd 0.336 0.634 nd nd 0.648 0.182 nd nd
16 152.359 17.278 nd nd 0.613 1.568 nd 0.061 0.262 0.434 nd nd 0.320 0.080 nd nd
17 101.229 10.634 nd nd 0.770 1.239 nd 0.021 0.062 0.192 nd nd 0.332 0.057 nd nd
18 128.453 18.959 nd 0.181 0.849 2.245 nd 0.163 0.244 0.348 nd nd 0.303 nd nd nd
19 123.090 11.783 nd nd 0.575 1.356 nd 0.038 0.107 0.681 nd nd 0.310 0.117 nd nd
20 87.802 9.684 nd nd 0.317 1.019 nd 0.102 0.140 0.918 nd nd 0.338 nd nd nd
21 50.543 6.658 nd nd 0.212 0.677 nd nd 0.078 0.171 nd nd 0.109 nd nd nd
22 69.546 6.816 nd 0.038 0.160 0.536 nd 0.030 0.053 0.425 nd nd 0.166 nd nd nd
23 82.259 13.219 nd nd 0.471 0.931 nd nd 0.133 0.395 nd nd 0.303 nd nd nd
24 12.398 2.149 0.035 0.412 0.062 0.398 0.039 7.191 0.094 0.032 nd nd 0.035 nd nd nd
25 21.237 3.361 0.058 nd 0.085 0.567 nd 0.337 0.041 0.069 nd nd 0.094 0.032 nd nd
26 8.862 1.687 0.028 nd 0.053 0.355 nd 0.006 0.029 0.085 nd nd 0.034 0.026 nd nd
27 204.777 22.212 nd nd 1.318 1.954 nd nd 0.104 0.801 nd nd 0.427 nd nd nd
28 2.180 0.385 0.007 nd 0.014 0.067 nd nd 0.007 0.010 nd nd 0.007 0.006 nd nd
29 31.736 4.309 0.061 0.114 0.151 0.846 nd 1.408 0.078 0.078 nd nd 0.144 0.054 nd nd
30 106.820 13.988 nd nd 0.479 1.698 nd 0.122 0.257 0.391 nd nd 0.185 nd nd nd
31 183.062 14.435 nd nd 0.296 0.862 nd nd 0.145 0.333 nd nd 0.423 nd nd nd
32 203.133 19.678 nd nd 0.467 2.027 nd 0.091 0.208 0.310 nd nd 0.433 nd nd nd
33 113.789 9.567 nd nd 0.258 1.427 nd nd 0.070 0.326 nd nd 0.313 nd nd nd
34 129.765 11.836 nd nd 0.341 1.439 nd 0.102 0.269 nd nd nd 1.528 0.136 nd nd
35 138.828 11.846 nd nd 0.451 1.724 nd 0.026 0.160 0.358 nd nd 0.456 0.136 nd nd
36 132.732 13.036 nd nd 0.618 0.875 nd 0.036 0.224 0.634 nd nd 0.461 0.147 nd nd
37 140.107 16.643 nd 0.322 0.399 1.313 nd 2.669 0.222 0.141 nd nd 0.373 0.094 nd nd
38 69.169 9.801 nd nd 0.303 0.642 nd 0.112 0.125 0.127 nd nd 0.147 nd nd nd
Table 2. Botanical origin of 38 Apis mellifera honey samples from different municipalities in the State of Piauí, Brazil
Sample Botanical origin
Scientific name Popular name
1 Mimosa verrucosa Jurema
2 Mimosa verrucosa Jurema
3 Piptadeniasp. Angico-de-bezerro
4 Piptadeniasp. Angico-de-bezerro
5 Piptadeniasp. Angico-de-bezerro
6 Piptadeniasp. Angico-de-bezerro
7 Piptadeniasp. Angico-de-bezerro
8 Piptadeniasp. Angico-de-bezerro
9 Mimosa caesalpineaefolia Sansão-do-campo
10 Piptadeniasp. Angico-de-bezerro
11 Mimosa caesalpineaefolia Sansão-do-campo 12 Salvia sp.+Tibouchina Salvia + Quaresmeira
sp.+Croton sp. + Marmeleiro
13 Piptadeniasp. Angico-de-bezerro
14 Piptadeniasp. Angico-de-bezerro
15 Piptadeniasp. Angico-de-bezerro
16 Piptadeniasp. Angico-de-bezerro
17 Piptadeniasp. Angico-de-bezerro
18 Piptadeniasp. Angico-de-bezerro
19 Piptadeniasp.+ Angico-de-bezerro +
Borreria verticillata Vassourinha-de-botão
20 Mimosa verrucosa Jurema
21 Piptadeniasp. Angico-de-bezerro
22 Piptadeniasp. Angico-de-bezerro
+Richardia sp. + Poaia
23 Piptadeniasp. Angico-de-bezerro
24 Piptadeniasp. Angico-de-bezerro
25 Croton urucurana Sangra d’água
26 Piptadeniasp. Angico-de-bezerro
27 Piptadeniasp. Angico-de-bezerro
28 Tibouchina sp.+ Quaresmeira +
Mimosa caesalpineaefolia Sansão-do-campo
29 Polifloral
30 Piptadeniasp. Angico-de-bezerro
31 Piptadeniasp. Angico-de-bezerro
32 Piptadeniasp. Angico-de-bezerro
33 Piptadeniasp. Angico-de-bezerro
34 Piptadeniasp. Angico-de-bezerro
35 Piptadeniasp. Angico-de-bezerro
36 Piptadeniasp. Angico-de-bezerro
37 Piptadeniasp. Angico-de-bezerro
38 Piptadeniasp. Angico-de-bezerro
Table 3. Values established by Brazilian law, mean value, confi-dence interval (5%), and minimum and maximum values for chemi-cal elements found in 38 Apis mellifera honey samples from differ-ent municipalities in the State of Piauí, Brazil
Chemical Brazilian Mean Minimum Maximum
Elements Law14,15 µg g-1
K — 109.671±17.487 2.180 204.777
Ca — 014.471±3.8797 0.385 76.759
Ti — 000.112±0.07 0.007 0.266
Cr < 0.1015 000.196±0.11 0.038 0.412
Mn — 000.493±0.103 0.014 1.434
Fe — 001.722±0.446 0.067 7.053
Co — 0.038 0.037 0.039
Ni < 5.0015 000.728±0.706 0.006 7.191
Cu < 10.0014 000.179±0.0471 0.007 0.908
Zn < 50.0015 000.967±0.653 0.010 10.756
Se < 0.3015 nd nd nd
Br — nd nd nd
Rb — 000.371±0.097 0.007 1.528
Sr — 000.145±0.045 0.006 0.537
Ba — 11.681* — —
Hg — nd nd nd
nd: not detected; * presence in only one sample
Table 4. Variance estimates (eigenvalues) and cumulative percent-age of total variance (%) obtained by principal components analy-sis, considering 38 honey samples from Piauí, Brazil and 12 chemi-cal elements
Principal components Eigenvalues % Accumulated
Y1 4.3045 30.75
Y2 2.4021 47.90
Y3 2.0185 62.32
Y4 1.9728 76.41
Figure 1. Phenogram obtained by cluster analysis, using mean Euclidean
distance and the UPGMA method for 38 Apis mellifera honey samples from the State of Piauí and 12 selected chemical elements
Figure 2. Linkage distance graph in successive clustering steps using the
mean Euclidean distance and the UPGMA method. The arrow indicates the cutoff distance in the phenogram which defines groups in Figure 1
15, 19, 9, and 2); group 7 has 4 samples (Numbers. 25, 28, 26, and 24), group 8 has 4 samples (Numbers 38, 22, 23, and 20), and group 9 has 5 samples (Numbers 21, 12, 29, and 1).
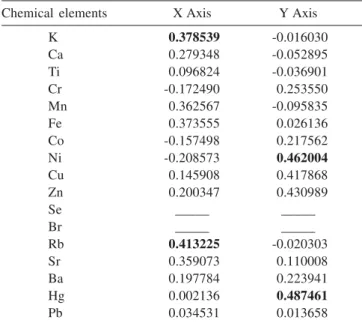
Of the chemical elements analyzed for each axis (Table 5), those that contributed the most for the formation of groups on the X axis were Rb and K, and Hg and Ni on the Y axis.
and K concentrations for the samples studied are distributed as follows: group 1 (163.97 µg g-1); group 2 (203.13 to 204.77 µg g-1); group 3 (174.74 to 183.06 µg g-1); group 4 (152.3 to 163.95 µg g-1); group 5 (101.22 to 113.78 µg g-1); group 6 (123.09 to 144.34 µg g-1); group 7 (2.18 to 21.23 µg g-1); group 8 (69.16 to 87.80 µg g-1), and group 9 (31.73 to 58.20 µg g-1).
In honey, K is the chemical element found at the highest concentration. Crane28 reported that honey contains more K than any other chemical element; this author also mentioned that the amount of K is 100 times higher than the amount of Fe.
CONCLUSION
Chemical elements with levels above those established by Brazilian law occurred in the analyzed samples for Cr (13.15% of samples) and Ni (2.63% of samples), thus disqualifying these samples. Elements K, Rb, and Hg must be studied in more detail and included in the legislation, since they have great influence on product quality. Table 5. Eigenvalues calculated for 38 honey samples from the State of Piauí, Brazil analyzed for chemical elements
Chemical elements X Axis Y Axis
K 0.378539 -0.016030
Ca 0.279348 -0.052895
Ti 0.096824 -0.036901
Cr -0.172490 0.253550
Mn 0.362567 -0.095835
Fe 0.373555 0.026136
Co -0.157498 0.217562
Ni -0.208573 0.462004
Cu 0.145908 0.417868
Zn 0.200347 0.430989
Se _____ _____
Br _____ _____
Rb 0.413225 -0.020303
Sr 0.359073 0.110008
Ba 0.197784 0.223941
Hg 0.002136 0.487461
Pb 0.034531 0.013658
REFERENCES
1. Nobre, A. L. da R.; Tese de Doutorado, Universidade de São Paulo, Brasil, 1990.
2. Louveaux, J.; Cahiers de Nutrition et de Diétetique1985,1, 57. 3. Nürnberg, H. W.; Pure Appl. Chem.1982,54, 853.
4. Tong, S. S. C.; Morse, R. A.; Bache, C. A.; Lisk, D. J.; Arch. Environ. Health1975,30, 329.
5. Nürnberg, H. W.; Analysis Chimie Acta1984,164, 1.
6. Caroli, S.; Forte, G.; Lamiceli, A. L.; Galoppi, B.; Talanta1999,50, 327. 7. Pregnolato, W.; Pregnolato, N. P., coords.;Normas analíticas do Instituto
Adolfo Lutz, 3a ed., Instituto Adolfo Lutz: São Paulo, 1985.
8. Ward, A. F.; Marciello, L. F.; Carrara, L.; Luciano, V. J.; Spectrosc. Lett.
1980,13, 803.
9. SAS Institute; SAS/STAT: user’s guide – version 6. 4, Ed. Cary, 1990. 10. Mardia, L. V.; Keni, J. T.; Bibby, J. M.; Multivariate analysis, Academic
Press: London, 1979.
11. Morrison, D. F.; Multivariate statistical methods, 2nd ed., Mc Grow Hill: Tokyo, 1981.
12. Joliffe, I. T.;Applicant Statistical1973,21, 21.
13. Cruz, C. D.; Regazzi, A. J. Modelos biométricos aplicados ao melhoramento genético, Universidade Federal de Viçosa: Viçosa, 1997. 14. http://e-legis.bvs.br/leisref/public/showAct.php?id=22, acessada em Agosto
2006.
15. http://e-legis.bvs.br/leisref/public/showAct.php?id=90#’, acessada em Agosto 2006.
16. Morse, R. A.; Lisk, D. J.;Am. Bee J.1980,120, 522.
17. Caroli, S.; Forte, G.; Alessandrelli, M.; Cresti, R.; Spagnoli, M.; D’Ilioss, S.; Pouwels, J.; Kramer, G. N.; Microchem. J.2000,67, 227.
18. Kump, P.; Necemer, M.; Snajder, J.; Spectrochim. Acta,Part B1996,51, 499.
19. Merin, U.; Bernstein, S.; Rosenthal, I. A.; Food Chem.1998,63, 241. 20. Braziewiez, J.; Fijal, I.; Czyewski, T.; Nucl. Instrum. Methods Phys. Res.,
Sect. A 2002,487, 231.
21. Marchini, L. C.; Moreti, A. C. C. C.; Otsuk, I. P.; Ciênc. Tecnol. Aliment.
2005,25, 8.
22. Nanda, V.; Sarkar, B. C.; Sharma, H. K.; Bawa, A. S.; J. Food Composition and Analysis2003,16, 613.
23. Yilmaz, H.; Yavuz, O.; Food Chem.1998,65, 475.
24. Salinas, F.; Montero de Espanha, F.; Osório, E.; Revista Espanhola de Ciencias y Tecnologia de Alimentos1994,34, 441.
25. Iskander, F. Y.; Sci. Total Environ.1996,192, 119.
26. Latorre, M. J.; Peña, R.; Pita, C.; Botana, A.; García, S.; Herrero, C.; Food Chem.1999,66, 263.
27. Lasceve, G.; Gonnet, M.; Apidologie1974,5, 201.