INUNDATION MAPPING – A HAZARD STUDY BASED ON THE DECEMBER 26, 2004 TSUNAMI ALONG THE KARAIKAL COAST OF INDIA
K. Chittibabu & R. Baskaran* Department of Geology,
National College, Trichirapalli-01, India.
Department of Industries and Earth Sciences, Tamil University,
Thanjavur-10, India.
*e-mail: [email protected]
ABSTRACT
A study of tsunami impact was undertaken along India’s Karaikal coast from Poovam in Karaikal to Nagore, Nagapatinam. An integrated approach was adopted for the preparation of thematic maps on land use, land cover and coastal geomorphology using multispectral remote sensing data. RTK GPS instruments were used for the collection of topographic data with contour intervals of 0.5m. The GIS tool was used to incorporate the elevation data, the extent of tsunami inundation and the thematic maps derived from remote sensing data. The present study highlights the most vulnerable areas of tsunami inundation and provides demarcations of suitable sites for rehabilitation.
1. INTRODUCTION
Along the coast of Tamilnadu, the inland inundation from the December 26, 2004 tsunami varied from 300-900 meters, while run-up heights ranged from 3-7 m. (Kumar et al., 2008). The waves struck the Karaikal coastal region, flooding fishing villages and causing the loss of more than 500 people. The maximum tsunami run up elevation was 5.2m in this region. At the village of Akkaravatam the maximum inland inundation was about 2.1 km and the maximum tsunami height was about 7m. It is believed that the local bathymetry resulted in wave convergence and the observed high amplification of the tsunami at this location – which emphasizes the significance of coastal geomorphology and bathymetry in the variation of run up heights and inundation (Jay et al., 2005).
Based on actual data prior to 1968 (Gonnert et al, 2001), a classification of the coast for storm surges of different heights (A: <2m; 2-5; C:>5m) was made. Along the coastal belt north of latitude 20oN where the cyclones occur more frequently, maximum surges occur in Sunderbans. The southeast coast of Karaikal is designated as “C” category. This is a region of maximum storm surge with amplitude of 0.3m and combined surge plus wind wave amplitude, totaling 1.3m.
There has been considerable research in determining the impact of tsunamis on coastal environments as well as the nature of inundation, run up heights, erosional and depositional effects and destruction along coasts. Alami and Tinti (1991) evaluated the tsunami hazard along the Moroccan coast by comparing tsunami data with the set of available earthquake data. Dawson (1994) suggested that the geomorphologic processes associated with tsunami run-up and backwashes are highly complex. Raval (2005) reported severe destruction along the coast of Nagapatinam, South India, primarily caused by its geographic setting, which enhances inundation. Mohan (2005) concluded that the elevated coastal dunes and the beach ridges along a coastline could act as barriers in minimizing inundation along the northern parts of the Tamilnadu coast. In the present paper, we describe our work on mapping the extent of inundation along the Karaikal coast and in finding a relationship between the extent of tsunami inundation and run-up height, with the help of field measurements, by using RTK-GPS and Leica Total Station and the co-ordinates and elevations of locations where evidence of tsunami was preserved.
2. STUDY AREA
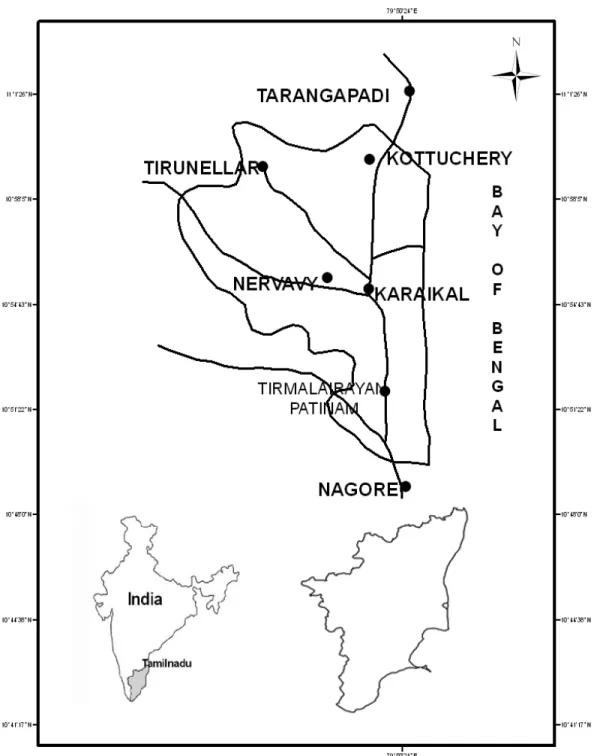
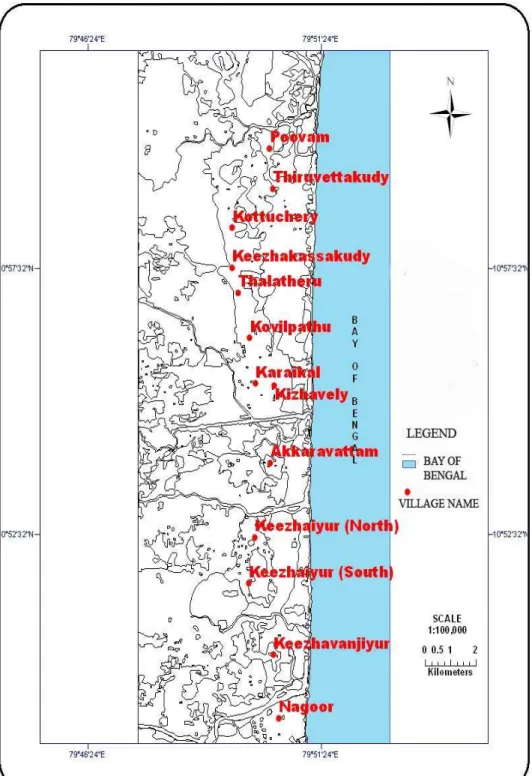
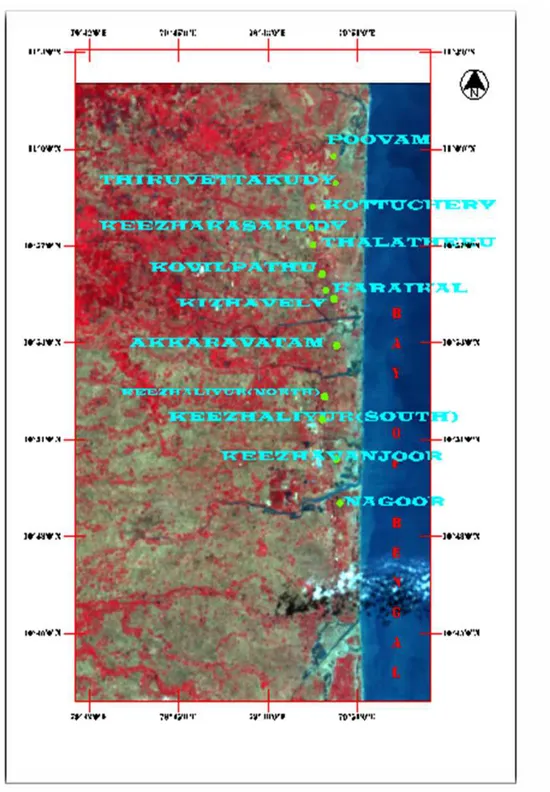
The study area (Fig. 1 & 2), covered 160 sq. km. along the coast of Karaikal, from the village of Poovam to Nagore. The study area is also illustrated with satellite imagery (Fig. 3).
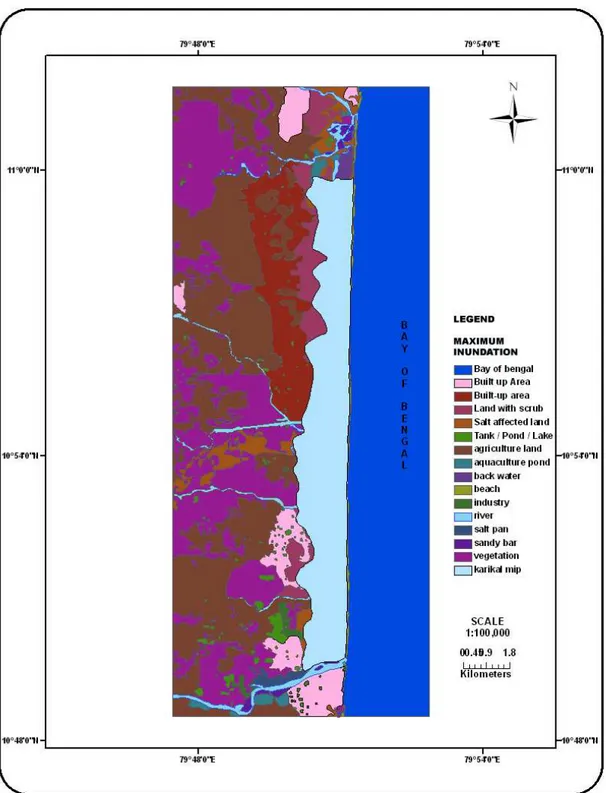
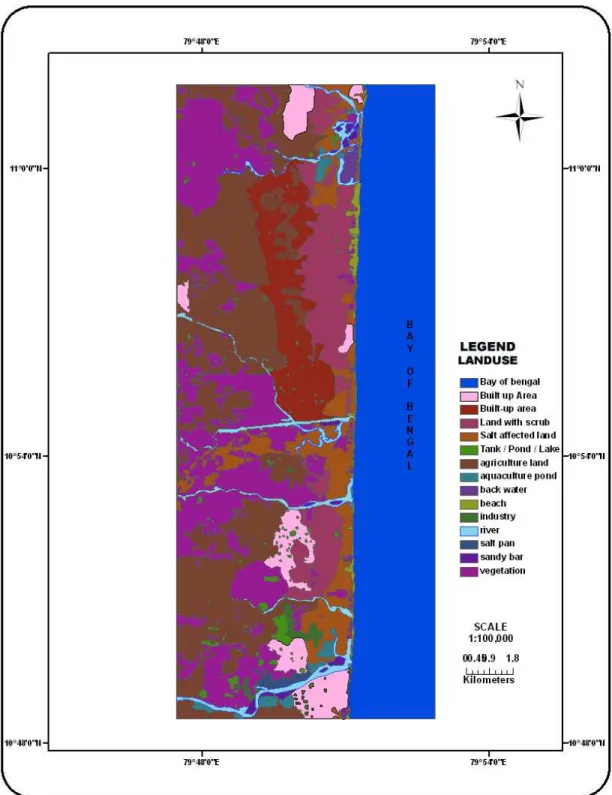
Major parts of the investigated coastal area consist of alluvium, beach dunes, tidal flats and sandy bars. The entire study area is occupied by coastal community settlements. Beach resorts, farmhouses, aquaculture ponds, theme parks, tourist spots, and artificial parks are mainly located on the southeast coast of Karaikal (Fig. 5). Fishing is the main occupation of people living in the suburban coastline, whereas in the urban coastline the inhabitants are also employed by industries and governmental and non-governmental organizations.
Fig. 1. Index Map of the Study Area.
Fig 2. Map of Locations of the Study Area.
Fig. 3. Satellite Imagery of the Study Area.
3. METHODOLOGY
Inundation maps are depictions of coastal areas that identify regions, populations, and facilities that are at risk from tsunami attack. Emergency planners for disaster response and mitigation could use such maps. These maps require an assessment of local and far-field geologic hazards, and the calculation of potential coastal flooding. Detailed fieldwork was undertaken along the12 km coastal stretch from Poovam to Nagore to assess the extent of inundation (Fig. 4). Co-ordinates of the 10 inundation limits and the shoreline were measured using Magellan hand held GPS with a spatial resolution of 10 m. The inundation limit was identified using field evidence, such as withering of plants sensitive to salinity or presence of organic debris left by the tsunami waves. Watermarks on compound walls were rare and were used wherever available. The direction of propagation of tsunami was noted based on transported blocks of damaged compound brick walls or broken tree trunks. Also, examined was the geomorphologic set up of the region, such as the presence of dune ridges. For the preparation of land use/land cover maps, LISS III satellite data was used. ERDAS Imagine software was used for image processing. Land use/cover categories were mapped using such multi-spectral imagery. Geo-referencing with Ground Control Points (GCP) - such as road intersections - collected with Magellan GPS, refined the images (2005 IRS P6 LISS-III). Baseline maps of villages were scanned and geo-referenced using ARC GIS 9.1 and measuring co-ordinates (Lat/Long; WGS 84) of known survey monuments. Village boundary stones were preferentially used for GCP. At least six GCP readings were taken for each village and thus the RMS error was kept minimum; points that did not correspond properly were deleted. The village maps were overlaid on the satellite image and the correspondence of features present was confirmed. The marginal water bodies and roads depicted on the maps were useful for the accuracy of the recording process. The rectified village maps were digitized using ARC GIS 9.1, GIS package in the Integrated Coastal and Marine Area Management (ICMAM) Project Directorate of the Ministry of Earth Sciences, Government of India, in Chennai. Ground truth information collected during elevation mapping was used to validate these details.
4. LAND USE/COVER MAP (POOVAM TO NAGORE).
1. Tsunami inundation limits and run-up level mapping along the study area; 2. Transfer of inundation points over a geo-referenced satellite imagery;
3. Elevation mapping for the preparation of 0.5 km interval contour data using RTK GPS (Real – Time Kinematic GPS) along the study area at different transects;
4. Post-tsunami remote sensing data (LISS-III) for land use/cover mapping using ERDAS package;
5. Preparation of larger scale (1:50000) action plan maps by incorporating all the above thematic parameters and cadastral maps in a GIS environment.
A tsunami inundation map, representing a source and a community-specific “credible worst case scenario”, is a powerful planning and hazard mitigation tool (Gonzalez et al., 2002).
Fig. 4. Inundation Map from Poovam to Nagore.
Fig 5. Land Use/Cover Map (Poovam to Nagore).
Such a program of mapping tsunami inundation is of great usefulness to emergency managers. Modeling tsunami inundation is required to properly assess the risk (Groat, 2005). With the growth of population in coastal areas, there is an increased need for better scientific understanding of earthquake and tsunami hazards. Simple maps of expected tsunami paths and travel times, based on crude bathymetry, have been of important operational value in developing a tsunami-warning infrastructure (Mofjeld et al, 2004). Table 1 illustrates the tsunami inundation limits in meters and the coordinates of latitude and longitude of specific locations of the study area, in reference to the high tide datum data provided by the Government of Tamil Nadu. The inundation limits have been plotted on base map top sheets (1:25,000) of the Survey of India (SOI). Figure 3 shows the tsunami inundation limits for a coastal area, which extends from Poovam to Nagore.
Table 1: Tsunami inundation limits and area of submergence. Sl. no, name of the village, maximum inundation limit (in km), minimum inundation (in km).
Science of Tsunami Hazards, Vol. 28, No. 1, page 83 (2009)
S.No Village Name Max (in
Km)
Min (in Km)
1. Thiruvettakudi 1.50 0.93
2. Kottucherry 1.48 1.18
3. Kilakasakudi 1.48 1.05
4. Thalatheru 1.54 0.88
5. Kovilpathu 1.70 1.17
6. Kizhavely 1.75 1.14
7. Akkaravattam 2.09 ----
8. Keezhaliyur North 1.98 1.27
9. Keezhaliyur South 1.97 1.29
5. RESULTS AND DISCUSSION
Maximum inundation is shown for the following villages: Akkaravatam (2.09), North Keezhaliyur (1.98m) and South Keezhaliyur (1.97m). In these villages the predominant landform is mud flat with low elevation. Furthermore two rivers and a canal border the village of Akkaravatam. In the northern part of the study area from Keezhalavely to Thiruvettakudi villages, the area is partially covered by beach ridges and plains parallel to the shoreline. Hence inundation was minimum as in Thiruvettakudi village (0.93m) due to the presence of a major ridge parallel to the shoreline.
REFERENCES
Alami, S. O. E., Tinti, S., A (1991) Preliminary evaluation of the tsunami hazards in the Moroccan coasts, Sci. Tsu. Haz., 9(1), 31–38.
Besana, G. M., Ando, M., and Mirabueno, M. H., (2004) The may 17, 1992 event: tsunami and coastal effects in eastern mindanao, Philippines, Sci. Tsu. Haz., 22(2), 61–68.
Chadha, R. K., Latha, G., Yeh, H., Peterson, C., and Katada, T. (2005) : The tsunami of the great Sumatra earthquake of M 9.0 on 26 December, 2004 – impact on the east coast of India, Cur. Sci., 88, 1297–1301.
Dawson, A. G. (1994): Geomorphological effects of tsunami run-up and backwash, Geomorpho., 10(1–4), 83–94.
Gonzalez, F. I., Titov, V., Mofjeld, H., and Venturato, A. (2002): The NTHMP Inundation Mapping Program, Second Tsu.Symp., Hawaii, 15, 52p.
Groat, C. G.: Statement of Charles G. Groat, Director, US Geological Survey US Department of the Interior before the Committee on Science US House of Representatives,.
Gupta, H. K. (2005): A note on the 26th December 2004 Great Sumatra earthquake, J. Geol. Soc. India., 66, 247–248, 2005.
Harinarayana, T. and Hirata, N ( 2005): Destructive Earth quake and Disastrous Tsunami in the Indian Ocean, What Next?, Gond. Res., 8(2),246–257.
Houston, J. R. (1974): Tsunami predictions for Southern California coastal communities, USA, Proceedings, IUGG Tsunami Symposium, Wellington, New Zealand.
Houston, J. R. and Garcia, A. W. (1974): Type-16 flood insurance study, tsunami predictions for Southern California, Waterways Experiment Station, Technical Report H-7: 3, Vicksburg.
Houston, J. R. (1980): Tsunami elevation predictions for American Samoa, WES Technical Report No. HL-80, 16.
Houston, J. R. and Garcia, A. W. (1978): Type 16 Flood Insurance Study: Tsunami Predictions for the West Coast of the Continental United States: US Army Engineer Waterways Experiment Station, Technical Report H-78, 26.
Imamura, F. (2008): Risk Evaluation and Real Time Information for Tsunami Disaster Mitigation. Proc. Workshop on Wave, Tide www.nat-hazards-earth-syst-sci.net/8/617/2008/ Nat. Hazards Earth Syst. Sci., 8, 617–626.
Janaka j. (2006) Wijetunge Tsunami on 26 december 2004: spatial distribution of tsunami height and the extent of inundation in sri lanka. Sci Tsu Haz Vol. 24, No. 3, page 225.
Mofjeld, H. O., Gonz´alez, F. I., Titov, V. V., Venturato, A. J., and Newman, J. C. (2004): Effects of tides on maximum tsunami wave heights: Probability distributions, Journ. of Atmos. and Ocean. Tech., 24(1), 117.
Mohan, V.: December 26, 2004 tsunami: A field assessment in Tamil Nadu, in: Tsunami: The Indian Context, edited by: Ramasamy,
Murthy, P.G.K.(2002), An in sight into internal waves in the seas around India, proc. ICONS 2002,Int.Conf., on Sonar-sensors and systems, pp.525-532.
Murthy. K. S. R, Subrahmanyam. A. S, Murty. G. P. S, Sarma. K. V. L. N. S, Subrahmanyam. V, Mohana Rao. K, Suneetha Rani. P, Anuradha. A, Adilakshmi. B. and Sri Devi.( 2006) T.Factors guiding tsunami surge at the Nagapattinam–Cuddalore shelf, Tamil Nadu, east coast of India current science, vol. 90, no. 11, 10.
Raval, U. (2005): Some factors responsible for the devastation in Nagapattinam region due to tsunami of 26 December 2004, J. Geol. Soc. India., 65(5), 647–649.
Satheesh Kumar,.C, Arul Murugan .P, Krishnamurthy R. R, Prabhu Doss Batvari. B, Ramanamurthy. M. V, Usha. T, and Pari. Y. (2008) Nat. Hazards Earth Syst. Sci., 8, 617–626, www.nat-hazards-earth-syst-sci.net/8/617/2008.
Smith, S. E., Williams, D. G., and Johnson, N. A. (1997): Nurtured by Knowledge: learning to do participatory action-research, The Apex Press, Ottawa, Canada.
Sundar, V. and Sundaravadivelu, R. (2005): Layout of Groin field shoreline changes (Kurumbanai, Vaniyakudi and Simoncolony), Proceedings of Coastal problems and Solutions, IIT Madras, Chennai.