ABSTRACT:Objective: To identify the prevalence of hypertension and evaluate the independent efect of central obesity on this outcome in adults living in the municipality of Ribeirão Preto, São Paulo State, Brazil. Methods: Cross-sectional population-based epidemiological study using three stage cluster sampling. The variability introduced in the third stage was corrected by attributing probability weights, resulting in a weighted sample of 2,471 participants. Hypertension was deined according to the disease history, the use of anti-hypertensive drugs or the mean of three consecutive measures, in mm/Hg, ≥ 140 for systolic and ≥ 90 for diastolic blood pressure. Prevalence of hypertension was estimated according to anthropometric, sociodemographic, behavioral and dietetic variables, as well as biochemical dosages and medication use. Crude and adjusted prevalence ratios for central obesity indices were estimated using Poisson regression. All the estimates were calculated taking into account the sampling design efect. Results: The results showed high prevalence of hypertension: 32.8 (males) and 44.5% (females). In the inal models, central obesity indexes were consistently associated with the outcome, in both genders. Conclusion: The results pointed out the need of planning health promotion and prevention, in order to control hypertension and central obesity aiming to reduce end-point events like coronary heart disease and stroke.
Keywords: Hypertension. Central Obesity. Cross-sectional Studies. Adults. Epidemiology. Public Health.
The independent efect of central obesity on
hypertension in adults living in Ribeirão Preto,
SP, 2007. EPIDCV Project
O efeito independente da obesidade central sobre a hipertensão arterial em
adultos residentes em Ribeirão Preto, SP, 2007. Projeto EPIDCV
Suzana Alves de MoraesI, Michele Vantini ChecchioII, Isabel Cristina Martins de FreitasIII ORIGINAL ARTICLE / ARTIGO ORIGINAL
IDepartment of Maternal-Infant and Public Health, Nursing school of Ribeirão Preto, Universidade de São Paulo – Ribeirão Preto
(SP), Brazil.
IIGraduate Program in Public Health Nursing, Nursing school of Ribeirão Preto, Universidade de São Paulo – Ribeirão Preto (SP), Brazil.
IIIPostdoctoral Program in Epidemiology, Center for Epidemiology, Universidade de São Paulo – Ribeirão Preto (SP), Brazil. Corresponding author: Suzana Alves de Moraes. Campus Universitário-USP – Avenida Bandeirantes, 3900, CEP: 14040-902, Ribeirão Preto, SP, Brasil. E-mail: [email protected]
INTRODUCTION
Along the demographic, epidemiological and nutritional transitions, changes in the age structure, the pattern of morbidity and mortality and the inversion of undernutrition towards overweight , respectively, resulted in an increased prevalence of chronic outcomes such as high blood pressure (HBP), already considered a public health problem in developed and developing countries1,2.
According to the World Health Organization (WHO), hypertension afects nearly one billion people and is responsible for nine million deaths per year worldwide, and is considered a major risk factor for cardiovascular disease. In 2008, about 40% of adults aged over 25 were diagnosed as hypertensive, registering prevalence of greater magnitude in regions of Africa (46%), while in the Americas, Europe, Asia and Oceania, the prevalence ranged between 35 and 40%2.
Among the factors associated with hypertension, sociodemographic determinants, behavioral factors, cardiovascular risk factors and nutritional status have been described in the literature3-5. Evidences about the relevance of central obesity as a risk factor for
hypertension adds up to these results6-9.
Panagiotakos et al.6, in a cohort study with a five years follow-up (ATTICA Study –
2001-2006), revealed that waist circumference and the waist/height and waist/hip ratios remained independently associated with the incidence of hypertension, even after RESUMO:Objetivo: Identificar a prevalência de hipertensão arterial e o efeito independente da obesidade central sobre este desfecho, em adultos residentes em Ribeirão Preto, SP. Métodos: Estudo epidemiológico transversal de base populacional, com amostragem desenvolvida em três estágios. A variabilidade introduzida no terceiro estágio foi corrigida pela atribuição de pesos, originando amostra ponderada de 2.471 participantes. A hipertensão foi definida segundo o histórico da doença, uso de medicação anti-hipertensiva ou médias de três medidas consecutivas, em mm/Hg, sendo ≥ 140 para a sistólica e ≥ 90 para a diastólica. Prevalências de hipertensão foram estimadas, segundo variáveis antropométricas, sociodemográficas, comportamentais, dietéticas, dosagens bioquímicas e uso de medicamentos. Razões de prevalências brutas e ajustadas para os indicadores de obesidade central foram obtidas utilizando-se regressão de Poisson. Todas as estimativas foram calculadas levando-se em consideração o efeito de desenho amostral. Resultados: Observou-se elevada prevalência de hipertensão: 32,8 (sexo masculino) e 44,5% (sexo feminino). Nos modelos finais, os indicadores de obesidade central permaneceram consistentemente associados ao desfecho, em ambos os sexos. Conclusão: Os resultados do estudo impõem a necessidade de planejamento de medidas de promoção e prevenção em saúde, direcionadas para o controle da hipertensão arterial e da obesidade central, com vistas à redução de eventos finais como a doença isquêmica do coração e os acidentes vasculares cerebrais.
adjustment for concurrent sociodemographic, behavioral, dietary and inflammatory factors.
Results from the National Health and Nutrition Examination Survey (NHANES 2007 – 2010)7 revealed that, in 2010, participants who had altered waist circumference
and body mass index (BMI) ≥ 30, when compared to those with normal values for both
indexes showed adjusted odds ratios equal to 3.23 (95%CI 2.63 – 3.96).
Lately, along with the classical studies of association, has outgrown the interest in evaluating the precision of anthropometric indexes in the diagnosis of hypertension. Lee et al.8, in a meta-analysis that included ten studies in which the authors applied
Receiving Operating Characteristic Curves (ROC), concluded, based on the analysis of random effects, that, for both sexes, the waist circumference, the waist/height and waist/hip ratios, in relation to hypertension, showed areas under the curves of greater magnitude (0.67 to 0.73) when compared to the body mass index (0.64 to 0.69). Similar results were reported by Silva et al.9 in a cross-sectional study carried
out in Florianópolis, SC, Brazil, where the authors found that the waist/height ratio in both sexes showed areas under the ROC curves ≥ 0.70.
Notwithstanding the importance of systemic arterial hypertension, its participation in the triad of the major risk factors for ischemic heart disease10 and its deleterious consequences
for health as a whole, much of the knowledge about its prevalence, distribution and associated factors in Brazil focuses primarily on capital or metropolitan areas of the South and Southeast, with scarce or no epidemiological population-based studies carried out in the municipalities of the country.
Within this perspective, the present study aimed to estimate the prevalence of hypertension and investigate the independent efect of central obesity on this outcome in a representative sample of adults living in Ribeirão Preto, SP, Brazil, in 2007.
MATERIALS AND METHODS
STUDY DESIGN AND SAMPLING PROCESS
Cross-sectional population-based epidemiological study carried out in Ribeirão Preto, SP, Brazil, between 2007 and 2008, being part of the project entitled “Prevalence of cardiovascular diseases and the identification of associated factors among adults living in Ribeirão Preto, SP – EPIDCV Project”. The sampling process was developed in three stages and the accuracy of the estimates, calculated on a sample of 1,205 individuals. The response rate was equivalent to 81.2%, satisfactory in cross-sectional studies11 and, in all, 1,133 individuals of both sexes and with 30 years or more attended
draw was corrected by assigning weights and use of specific commands, defining the census sectors as primary sampling unit (PSU) and the weighting variable (w12) as product of the sampling weights w1 and w2 which resulted in a weighted sample (nw) of 2,471 participants12. Further details about the sampling process and formulas for
obtaining the fractions w1 and w2 are contained in previous publications10.
DEPENDENT VARIABLE: SYSTEMIC ARTERIAL HYPERTENSION
Hypertension was defined according to prior history diagnosed by a physician, the use of antihypertensive medication or blood pressure ≥ 140 mm/Hg for systolic
pressure and ≥ 90 mm /Hg for the diastolic pressure13, considering, respectively, the
three consecutive measurements average (portable sphygmomanometers Geratherm Medical AG, Geschwenda, Germany). The variable was generated as dichotomous (yes/no).
MAIN INDEPENDENT VARIABLES
1. Nutritional status (as measured by the body mass index and classiied into three categories14: “euthroic”, “overweight” and “obese”);
2. Central obesity, assessed by four indicators:
• waist circumference, classiied dichotomously adopting speciic cutof, according to sex, recommended by the International Diabetes Federation (IDF)15;
• waist-height ratio;
• waist-hip ratio; and
• conicity index16, these last three according to theirs respectives tertiles.
The weight in kilograms was measured in portable electronic scales from Tanita (BF 680 model) and the height, in centimeters, in wall stadiometers (SECA, Hamburg, Germany), adopting the techniques recommended by Habicht and Butz17. The waist circumference and
hip circumference (in cm) were measured with inelastic tape (SECA, Hamburg, Germany). Waist circumference was located on the minor curvature located between the costal margin and the iliac crest, whereas hip circumference had as a referral point the greatest protuberance of the buttocks (side view). The conicity index (C index) was calculated according to the following equation16:
Index C = Waist circumference (m)
0.109 Body weight (kg)
ADJUSTMENT VARIABLES
• Sociodemographic: sex (both sexes); age (classiied into intervals of ten years); education (number of years of formal schooling); insertion in the labor market (the week before the interview) and individual income (referring to the month preceding the interview), classiied, respectively, as no/yes, according to tertiles of the distribution, and marital status (deined according to the presence/absence of a partner, regardless of formal union).
• Behavioral: smoking time (classiied according to tertiles of the distribution, being the irst tertile the reference category); risk zones of alcohol addiction (classiied into four categories according to the cutof recommended by the Alcohol Use Disorder Identification Test Questionnaire – AUDIT18) and daily average of sitting time
(obtained through the application of the short version of the International Physical Activity Questionnaire – IPAQ19 and subsequently classiied according to tertiles of
the distribution).
• Dietary: total energy of diet (kcal/day); daily consumption of sodium and cholesterol (grams/day) estimated using a Food Frequency Questionnaire (FFQ) containing 128 items20. The calculation of the respective amounts of micronutrients and total calories
was made in the NUTWin software, by using speciic tables, considering the centesimal composition of each food, the type of preparation and their household measures. All nutrients were adjusted to the total energy of the diet using the residual method proposed by Willet21.
• Biochemical dosages: ultrasensitive C-reactive protein – us-CRP (in mg/dL; classiied as normal: ≤ 0.5 mg/dL, and altered: > 0.5 mg/dL) and plasma ibrinogen (in mg/
dL; classiied according to the cutof corresponding to the tertiles of the distribution). The measurements were obtained after 12 hours fasting, in a Reference Laboratory with Certiicate of Proiciency in Essays.
• Use of medicines: number of medicines taken during the ifteen days prior to the interviews (classiied into four categories: “none”, “1 – 2”, “3 – 4” and “≥ 5”).
PROCESSING OF DATA
Data were collected through structured interviews in the eligible households by a team of trained interviewers. Before inal typing, proceeded from double data entry, the quality control of the information was assessed by replication of 12.5% of the interviews, applying the Kappa statistic for evaluation of reproducibility, which reached values greater than 0.80.
STATISTICAL ANALYSIS OF THE DATA
speciic categories of the sociodemographic, behavioral, anthropometric, dietary, biochemical dosages and medicines taken variables. In the descriptive phase of the study, global associations between the above factors and the outcome were tested by “F” statistics, considering α = 0.0522. In
the analytical phase, it was used Poisson’s regression to obtain prevalence ratios (PR)23, estimated
by point and by interval. Initially, the PR were estimated in univariate models containing each of the independent variables and the outcome, selecting for subsequent models variables with p -values ≤ 0.25 for the Wald’s statistic. Subsequently, partial adjustment models, stratiied
by sex, were built, including, separately, each of the main variables, adjusted for the subset of variables in each group: sociodemographic, behavioral, dietary, biochemical dosages and medicines taken variables. At this stage (partial models), the variables that presented p-values < 0.10 for the Wald statistics were selected for the inal models. In the inal models, stratiied by sex, remained the main variables adjusted for those variables provided by partial models which presented p-values <0.05 after simultaneously adjusted. Estimates were calculated taking into account the sampling design12, using the survey module in Stata
software (version 10.1).
ETHICAL CONSIDERATIONS
The EPIDCV project was approved by the Research Ethics Committee of the School of Nursing of Ribeirão Preto, Universidade de São Paulo and iled under the nº 0725/2006. All participants signed a consent form, as recommended by Resolution nº 196/96 of the National Health Council.
RESULTS
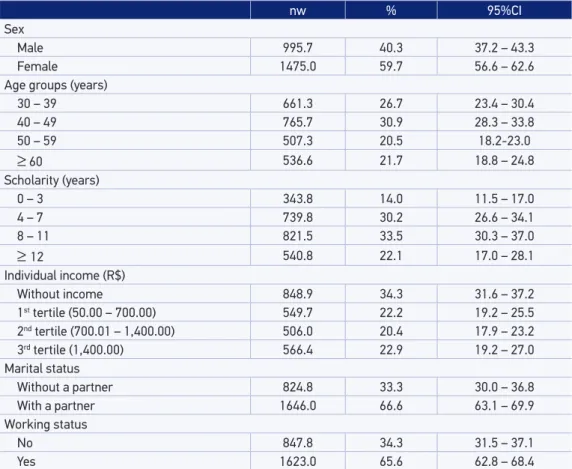
The Table 1 shows the characteristics of the sample according to sociodemographic variables. The design efect (def ) was equivalent to 1.34257.
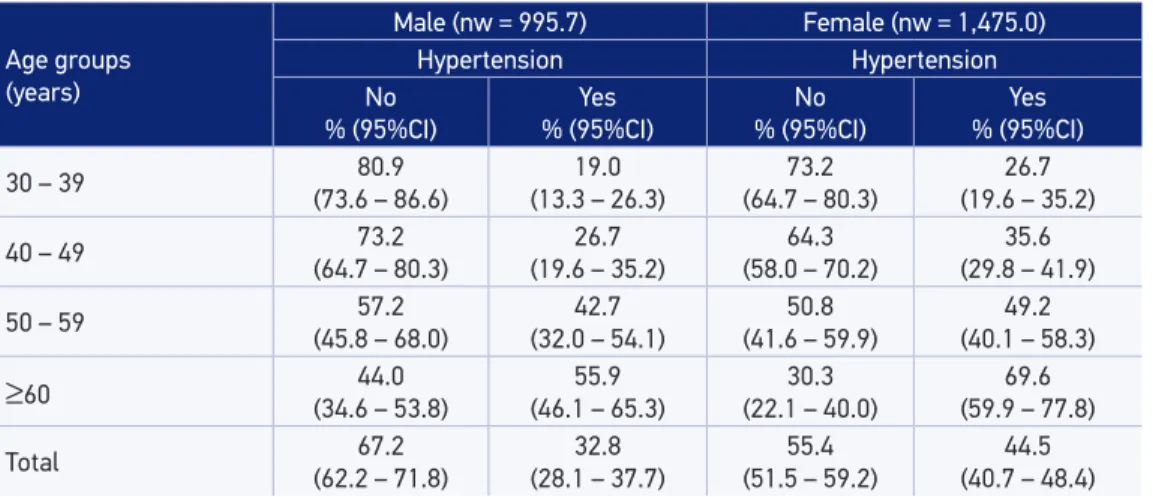
In Table 2, the crude prevalences of hypertension in male and female corresponded, respectively, to 32.8 and 44.5%, with a linear gradient according to age in males, and in females, greater magnitude in all categories of age compared to males.
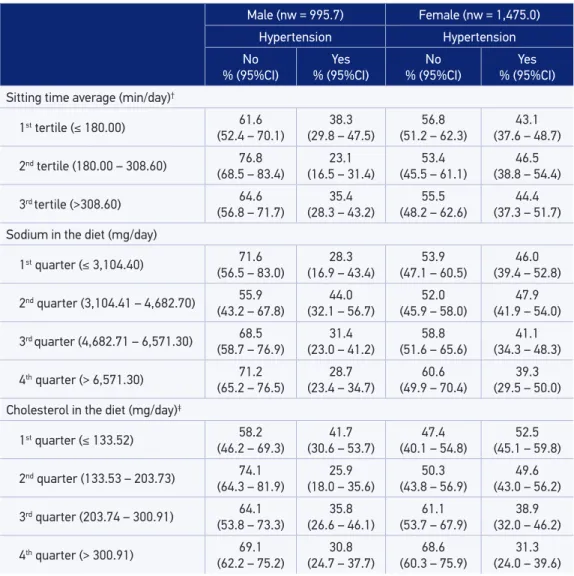
in the intermediate quarters. Among women, there was an inverse relationship between the consumption of cholesterol in diet and the prevalence of hypertension, although this relationship has not been observed in men.
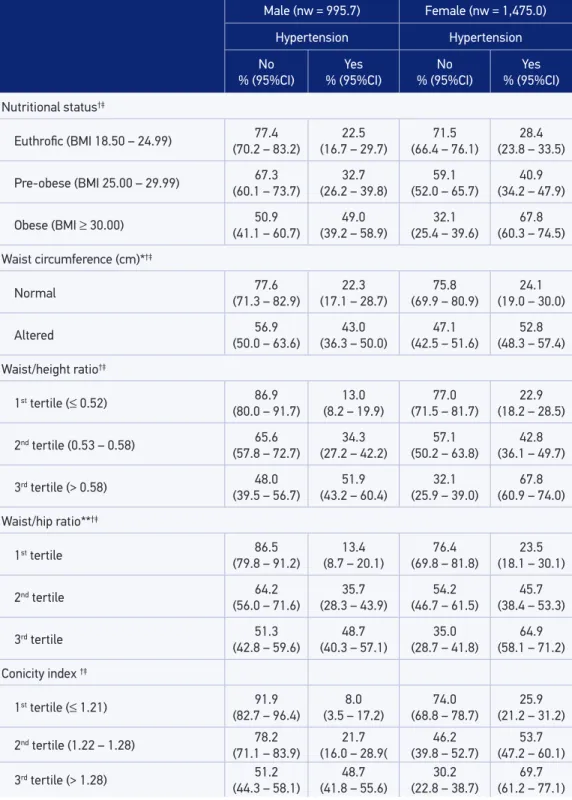
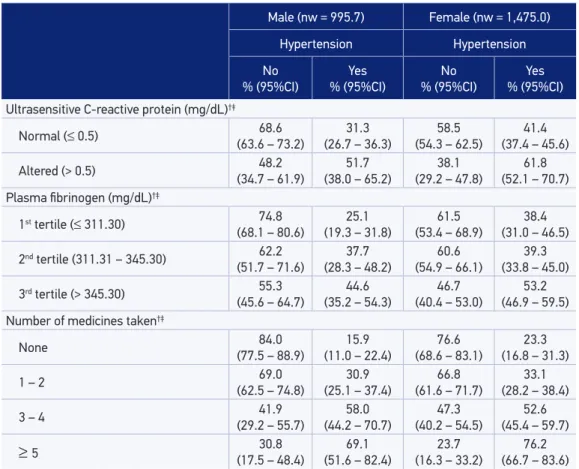
In Table 4, for both sexes, the prevalence of hypertension increased according to exposure levels of anthropometric variables being indicative of linear gradient (variables with more than two categories), and in those with altered waist circumference the prevalence of hypertension corresponded to almost the double (male) or more than the double (female), in relation to the respective reference categories. Regarding biochemical dosages, in both sexes, the prevalence of hypertension had direct relation with the fibrinogen tertiles, indicating linear gradient. Still, in both sexes, the respective prevalence of hypertension was higher among those who had higher levels of us-CRP. Regarding the number of medicines taken in the 15 days preceding the interviews, the prevalence of hypertension in both sexes showed a direct relation with exposure levels and indication of linear gradient.
nw % 95%CI
Sex
Male 995.7 40.3 37.2 – 43.3
Female 1475.0 59.7 56.6 – 62.6
Age groups (years)
30 – 39 661.3 26.7 23.4 – 30.4
40 – 49 765.7 30.9 28.3 – 33.8
50 – 59 507.3 20.5 18.2-23.0
≥ 60 536.6 21.7 18.8 – 24.8
Scholarity (years)
0 – 3 343.8 14.0 11.5 – 17.0
4 – 7 739.8 30.2 26.6 – 34.1
8 – 11 821.5 33.5 30.3 – 37.0
≥ 12 540.8 22.1 17.0 – 28.1
Individual income (R$)
Without income 848.9 34.3 31.6 – 37.2
1st tertile (50.00 – 700.00) 549.7 22.2 19.2 – 25.5
2nd tertile (700.01 – 1,400.00) 506.0 20.4 17.9 – 23.2
3rd tertile (1,400.00) 566.4 22.9 19.2 – 27.0
Marital status
Without a partner 824.8 33.3 30.0 – 36.8
With a partner 1646.0 66.6 63.1 – 69.9
Working status
No 847.8 34.3 31.5 – 37.1
Yes 1623.0 65.6 62.8 – 68.4
Table 1. Study population characteristics. Ribeirão Preto, SP, Brazil, 2007. EPIDCV Project.
Age groups (years)
Male (nw = 995.7) Female (nw = 1,475.0)
Hypertension Hypertension
No % (95%CI)
Yes % (95%CI)
No % (95%CI)
Yes % (95%CI)
30 – 39 80.9
(73.6 – 86.6)
19.0 (13.3 – 26.3)
73.2 (64.7 – 80.3)
26.7 (19.6 – 35.2)
40 – 49 73.2
(64.7 – 80.3)
26.7 (19.6 – 35.2)
64.3 (58.0 – 70.2)
35.6 (29.8 – 41.9)
50 – 59 57.2
(45.8 – 68.0)
42.7 (32.0 – 54.1)
50.8 (41.6 – 59.9)
49.2 (40.1 – 58.3)
≥60 (34.6 – 53.8)44.0 (46.1 – 65.3)55.9 (22.1 – 40.0)30.3 (59.9 – 77.8)69.6
Total 67.2
(62.2 – 71.8)
32.8 (28.1 – 37.7)
55.4 (51.5 – 59.2)
44.5 (40.7 – 48.4)
nw: weighted sample; 95%CI: conidence interval of 95%.
Table 2. Prevalence and conidence intervals for hypertension according gender and age. Ribeirão
Preto, SP, Brazil, 2007. EPIDCV Project.
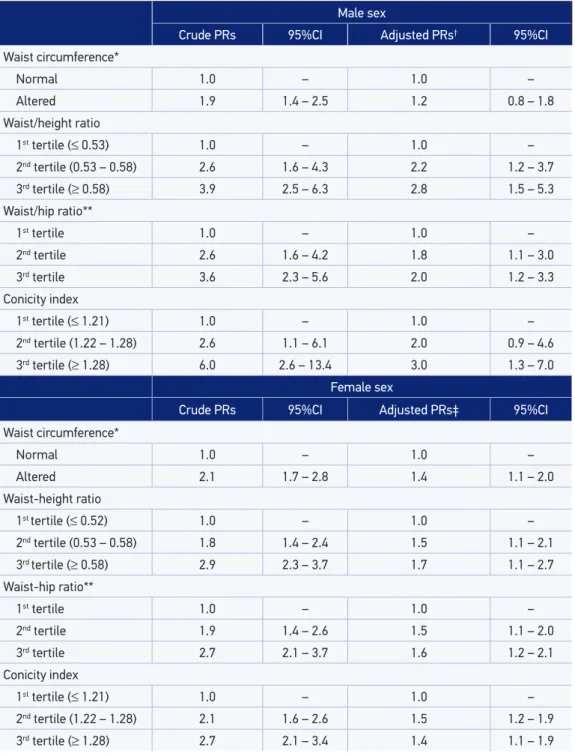
In Table 5, the inal models are presented, stratiied by sex, highlighting the independent efect of central obesity indicators: waist circumference, waist/height and waist/hip ratios and the Conicity index that showed prevalence ratios statistically signiicant in both sexes (p < 0.05), except for waist circumference (male gender) corresponding prevalence ratios that did not reach statistical signiicance.
DISCUSSION
The main indings of the study revealed a high prevalence of hypertension in both sexes, especially among women, and directly related to exposure levels of all anthropometric indexes. All central obesity indexes remained in the inal models, in both sexes.
Methodological rigour with which there were conducted all steps of the EPIDCV Project and the high response rate (> 80%) lends credibility to the results and strengthen its internal validity, not seeming, therefore, resulting from systematic bias. The losses resulting from changes of address or refusals (18.3%) did not seem associated with central obesity (main variables) or hypertension (outcome).
Passos et al.24, in a systematic review that included 13 population-based studies carried
out in Brazil between 1990 and 2003, observed prevalences of hypertension ≥ 25% in
municipalities of the state of São Paulo, Brazil: Cotia – population aged between 20 – 88 years (44.4%); Catanduva – population ≥ 18 years (31.5%) and Bauru – population 41 – 79 years
Male (nw = 995.7) Female (nw = 1,475.0) Hypertension Hypertension No % (95%CI) Yes % (95%CI) No % (95%CI) Yes % (95%CI) Schoolarship (years)†
0 – 3 63.5
(51.7 – 73.9)
36.4 (26.0 – 48.2)
32.0 (22.5 – 43.4)
67.9 (56.5 – 77.4)
4 – 7 61.0
(51.6 – 69.6)
38.9 (30.3 – 48.3)
53.2 (46.1 – 60.2)
46.7 (39.7 – 53.8)
8 – 11 71.1
(63.9 – 77.4)
28.8 (22.5 – 36.0)
60.2 (52.6 – 67.2)
39.8 (32.7 – 47.3)
≥12 (61.5 – 80.6)72.0 (19.3 – 38.4)27.9 (57.9 – 78.6)69.2 (21.3 – 42.0)30.7
Marital status
Without a partner 62.3 (52.5 – 71.2)
37.6 (28.7 – 47.4)
58.3 (52.1 – 64.3)
41.6 (35.6 – 47.8)
With a partner 68.9
(63.3 – 73.9)
31.1 (26.0 – 36.6)
53.6 (48.7 – 58.4)
46.3 (41.5 – 51.2) Working status†‡
No 41.6
(30.6 – 53.6)
58.3 (46.3 – 69.3)
45.5 (39.1 – 52.0)
54.4 (47.9 – 60.8)
Yes 72.6
(67.7 – 77.0)
27.3 (22.9 – 32.2)
63.7 (58.1 – 69.0)
36.2 (30.9 – 41.8) Smoking time (years)†
Not smoker 71.6
(64.7 – 77.7)
28.3 (22.2 – 35.2)
54.4 (49.3 – 59.5)
45.5 (40.4 – 50.6)
1st tertile (1 – 13) 74.4
(63.1 – 83.2)
25.5 (16.7 – 36.8)
56.5 (44.8 – 67.5)
43.4 (32.4 – 55.1)
2nd tertile (14 – 25) 57.5
(45.1 – 69.0)
42.4 (30.9 – 54.8)
62.1 (51.3 – 71.8)
37.8 (28.1 – 48.6)
3rd tertile (> 25) 60.1
(49.2 – 70.2)
39.8 (29.7 – 50.8)
52.2 (42.5 – 61.8)
47.7 (38.1 – 57.4)
AUDIT – degrees of dependence
No dependence (0 – 7) 67.7 (61.7 – 73.3)
32.2 (26.7 – 38.2)
54.0 (49.8 – 58.2)
45.9 (41.7 – 50.1)
1st degree (8 – 15) 69.7
(60.6 – 77.5)
30.2 (22.4 – 39.3)
71.2 (58.8 – 81.0)
28.8 (18.9 – 41.1)
2nd degree (16 – 19) 60.6
(39.8 – 78.6)
39.0 (21.3 – 60.1)
43.5 (15.4 – 76.6)
56.4 (23.4 – 84.5)
3rd degree (20 – 40) 52.5
(33.7 – 70.5)
47.5 (29.4 – 66.2)
61.4 (31.5 – 84.6)
38.5 (15.4 – 68.4)
Table 3. Prevalence and confidence intervals for hypertension according to gender, socio-demographic, behavioral and nutrition-related factors. Ribeirão Preto, SP, Brazil, 2007.
EPIDCV Project.
Table 3. Continuation.
Male (nw = 995.7) Female (nw = 1,475.0)
Hypertension Hypertension No % (95%CI) Yes % (95%CI) No % (95%CI) Yes % (95%CI)
Sitting time average (min/day)†
1st tertile (≤ 180.00) 61.6
(52.4 – 70.1)
38.3 (29.8 – 47.5)
56.8 (51.2 – 62.3)
43.1 (37.6 – 48.7)
2nd tertile (180.00 – 308.60) 76.8
(68.5 – 83.4)
23.1 (16.5 – 31.4)
53.4 (45.5 – 61.1)
46.5 (38.8 – 54.4)
3rd tertile (>308.60) 64.6
(56.8 – 71.7)
35.4 (28.3 – 43.2)
55.5 (48.2 – 62.6)
44.4 (37.3 – 51.7)
Sodium in the diet (mg/day)
1st quarter (≤ 3,104.40) 71.6
(56.5 – 83.0)
28.3 (16.9 – 43.4)
53.9 (47.1 – 60.5)
46.0 (39.4 – 52.8)
2nd quarter (3,104.41 – 4,682.70) 55.9
(43.2 – 67.8)
44.0 (32.1 – 56.7)
52.0 (45.9 – 58.0)
47.9 (41.9 – 54.0)
3rd quarter (4,682.71 – 6,571.30) 68.5
(58.7 – 76.9)
31.4 (23.0 – 41.2)
58.8 (51.6 – 65.6)
41.1 (34.3 – 48.3)
4th quarter (> 6,571.30) 71.2
(65.2 – 76.5)
28.7 (23.4 – 34.7)
60.6 (49.9 – 70.4)
39.3 (29.5 – 50.0)
Cholesterol in the diet (mg/day)‡
1st quarter (≤ 133.52) 58.2
(46.2 – 69.3)
41.7 (30.6 – 53.7)
47.4 (40.1 – 54.8)
52.5 (45.1 – 59.8)
2nd quarter (133.53 – 203.73) 74.1
(64.3 – 81.9)
25.9 (18.0 – 35.6)
50.3 (43.8 – 56.9)
49.6 (43.0 – 56.2)
3rd quarter (203.74 – 300.91) 64.1
(53.8 – 73.3)
35.8 (26.6 – 46.1)
61.1 (53.7 – 67.9)
38.9 (32.0 – 46.2)
4th quarter (> 300.91) 69.1
(62.2 – 75.2)
30.8 (24.7 – 37.7)
68.6 (60.3 – 75.9)
31.3 (24.0 – 39.6)
nw: weighted sample; 95%CI: conidence interval of 95%. †p < 0.05 for F statistic (male gender). ‡p < 0.05 for F statistic
(female gender).
cross-sectional studies carried out in Tubarão, SC, Brazil,25 with participants ≥ 18 years and
in Lages, SC, Brazil,26 with participants between 20-59 years old, detected, respectively,
prevalence of hypertension of 40 and 31.1% (male gender) and 33.6 and 38.1% (female gender). The above results, although not representative of the country as a whole, indicate that hypertension is already shaping up as a public health problem since the 1990s.
Continue... Table 4. Prevalence and conidence intervals for hypertension according to gender, anthropometric and inlammation-related factors and use of medicines. Ribeirão Preto, SP, Brazil, 2007. EPIDCV Project.
Male (nw = 995.7) Female (nw = 1,475.0)
Hypertension Hypertension No % (95%CI) Yes % (95%CI) No % (95%CI) Yes % (95%CI)
Nutritional status†‡
Euthroic (BMI 18.50 – 24.99) (70.2 – 83.2)77.4 (16.7 – 29.7)22.5 (66.4 – 76.1)71.5 (23.8 – 33.5)28.4
Pre-obese (BMI 25.00 – 29.99) 67.3 (60.1 – 73.7)
32.7 (26.2 – 39.8)
59.1 (52.0 – 65.7)
40.9 (34.2 – 47.9)
Obese (BMI ≥ 30.00) 50.9 (41.1 – 60.7)
49.0 (39.2 – 58.9)
32.1 (25.4 – 39.6)
67.8 (60.3 – 74.5)
Waist circumference (cm)*†‡
Normal 77.6
(71.3 – 82.9)
22.3 (17.1 – 28.7)
75.8 (69.9 – 80.9)
24.1 (19.0 – 30.0)
Altered 56.9
(50.0 – 63.6)
43.0 (36.3 – 50.0)
47.1 (42.5 – 51.6)
52.8 (48.3 – 57.4)
Waist/height ratio†‡
1st tertile (≤ 0.52) 86.9
(80.0 – 91.7)
13.0 (8.2 – 19.9)
77.0 (71.5 – 81.7)
22.9 (18.2 – 28.5)
2nd tertile (0.53 – 0.58) 65.6
(57.8 – 72.7)
34.3 (27.2 – 42.2)
57.1 (50.2 – 63.8)
42.8 (36.1 – 49.7)
3rd tertile (> 0.58) 48.0
(39.5 – 56.7)
51.9 (43.2 – 60.4)
32.1 (25.9 – 39.0)
67.8 (60.9 – 74.0)
Waist/hip ratio**†‡
1st tertile 86.5
(79.8 – 91.2)
13.4 (8.7 – 20.1)
76.4 (69.8 – 81.8)
23.5 (18.1 – 30.1)
2nd tertile 64.2
(56.0 – 71.6)
35.7 (28.3 – 43.9)
54.2 (46.7 – 61.5)
45.7 (38.4 – 53.3)
3rd tertile 51.3
(42.8 – 59.6)
48.7 (40.3 – 57.1)
35.0 (28.7 – 41.8)
64.9 (58.1 – 71.2)
Conicity index †‡
1st tertile (≤ 1.21) 91.9
(82.7 – 96.4)
8.0 (3.5 – 17.2)
74.0 (68.8 – 78.7)
25.9 (21.2 – 31.2)
2nd tertile (1.22 – 1.28) 78.2
(71.1 – 83.9)
21.7 (16.0 – 28.9(
46.2 (39.8 – 52.7)
53.7 (47.2 – 60.1)
3rd tertile (> 1.28) 51.2
(44.3 – 58.1)
48.7 (41.8 – 55.6)
30.2 (22.8 – 38.7)
Table 4. Continuation.
Male (nw = 995.7) Female (nw = 1,475.0)
Hypertension Hypertension No % (95%CI) Yes % (95%CI) No % (95%CI) Yes % (95%CI)
Ultrasensitive C-reactive protein (mg/dL)†‡
Normal (≤ 0.5) 68.6
(63.6 – 73.2)
31.3 (26.7 – 36.3)
58.5 (54.3 – 62.5)
41.4 (37.4 – 45.6)
Altered (> 0.5) 48.2
(34.7 – 61.9)
51.7 (38.0 – 65.2)
38.1 (29.2 – 47.8)
61.8 (52.1 – 70.7)
Plasma ibrinogen (mg/dL)†‡
1st tertile (≤ 311.30) 74.8
(68.1 – 80.6)
25.1 (19.3 – 31.8)
61.5 (53.4 – 68.9)
38.4 (31.0 – 46.5)
2nd tertile (311.31 – 345.30) 62.2
(51.7 – 71.6)
37.7 (28.3 – 48.2)
60.6 (54.9 – 66.1)
39.3 (33.8 – 45.0)
3rd tertile (> 345.30) 55.3
(45.6 – 64.7)
44.6 (35.2 – 54.3)
46.7 (40.4 – 53.0)
53.2 (46.9 – 59.5)
Number of medicines taken†‡
None 84.0
(77.5 – 88.9)
15.9 (11.0 – 22.4)
76.6 (68.6 – 83.1)
23.3 (16.8 – 31.3)
1 – 2 69.0
(62.5 – 74.8)
30.9 (25.1 – 37.4)
66.8 (61.6 – 71.7)
33.1 (28.2 – 38.4)
3 – 4 41.9
(29.2 – 55.7)
58.0 (44.2 – 70.7)
47.3 (40.2 – 54.5)
52.6 (45.4 – 59.7)
≥ 5 (17.5 – 48.4)30.8 (51.6 – 82.4)69.1 (16.3 – 33.2)23.7 (66.7 – 83.6)76.2
nw: weighted sample; 95%CI: conidence interval of 95%; BMI: body mass index; *Cutof: male ≥ 94 cm and female ≥
80 cm according to Albert et al.17, **Cutofs for males: 1st tertile (≤ 0.89); 2nd tertile ((0.90 – 0.95);
3rd tertile (> 0.95); Female: 1st tertile (≤ 0.79); 2nd tertile (0.80 – 0.86); 3rd tertile (> 0.86).†p < 0.05 for the F statistic -
(male gender); ‡p < 0.05 for the F statistic (female gender).
pointed out prevalence of obesity of greater magnitude in females than males in all age groups. Two other cross-sectional population-based studies conducted in Ribeirão Preto in the same period indicated, respectively, that women under 50 had higher daily sitting time average28 and lower adherence to recommended consumption of fruit and
vegetables29. These results, taken together, justify prevalence of greater magnitude of
hypertension among women in the municipality, including the younger ones.
Projections of Kearney et al.30 for the period 2000 to 2025 determine for the world as a
whole, that the prevalence of hypertension will increase by 9% in males and 13% in females. Certainly, the cumulative efect of this and other chronic events, facing the population aging, on one hand, and the highest survival rates among women compared to men, on the other, may explain these diferences.
Male sex
Crude PRs 95%CI Adjusted PRs† 95%CI
Waist circumference*
Normal 1.0 – 1.0 –
Altered 1.9 1.4 – 2.5 1.2 0.8 – 1.8
Waist/height ratio
1st tertile (≤ 0.53) 1.0 – 1.0 –
2nd tertile (0.53 – 0.58) 2.6 1.6 – 4.3 2.2 1.2 – 3.7
3rd tertile (≥ 0.58) 3.9 2.5 – 6.3 2.8 1.5 – 5.3
Waist/hip ratio**
1st tertile 1.0 – 1.0 –
2nd tertile 2.6 1.6 – 4.2 1.8 1.1 – 3.0
3rd tertile 3.6 2.3 – 5.6 2.0 1.2 – 3.3
Conicity index
1st tertile (≤ 1.21) 1.0 – 1.0 –
2nd tertile (1.22 – 1.28) 2.6 1.1 – 6.1 2.0 0.9 – 4.6
3rd tertile (≥ 1.28) 6.0 2.6 – 13.4 3.0 1.3 – 7.0
Female sex
Crude PRs 95%CI Adjusted PRs‡ 95%CI
Waist circumference*
Normal 1.0 – 1.0 –
Altered 2.1 1.7 – 2.8 1.4 1.1 – 2.0
Waist-height ratio
1st tertile (≤ 0.52) 1.0 – 1.0 –
2nd tertile (0.53 – 0.58) 1.8 1.4 – 2.4 1.5 1.1 – 2.1
3rd tertile (≥ 0.58) 2.9 2.3 – 3.7 1.7 1.1 – 2.7
Waist-hip ratio**
1st tertile 1.0 – 1.0 –
2nd tertile 1.9 1.4 – 2.6 1.5 1.1 – 2.0
3rd tertile 2.7 2.1 – 3.7 1.6 1.2 – 2.1
Conicity index
1st tertile (≤ 1.21) 1.0 – 1.0 –
2nd tertile (1.22 – 1.28) 2.1 1.6 – 2.6 1.5 1.2 – 1.9
3rd tertile (≥ 1.28) 2.7 2.1 – 3.4 1.4 1.1 – 1.9 Table 5. Crude and adjusted prevalence ratios and conidence intervals for central obesity according
to gender. Final Models. Ribeirão Preto, SP, Brazil, 2007. EPIDCV Project.
95%CI: conidence interval of 95%; PR: prevalence ratios. *Cutof: male ≥ 94 cm and female ≥ 80 cm according to Albert
et al.17; **Cutof for males: 1st tertile (≤ 0.89); 2nd tertile (0.90 – 0.95); 3rd tertile (> 0.95); Female: 1st tertile (≤ 0.79);
2nd tertile (0.80 – 0.86); 3rd tertile (> 0.86). †PR adjusted for: age groups, working condition, daily sitting time average,
nutritional status and number of medicines taken. ‡PR adjusted for: age groups, schoolarship, marital status, cholesterol
among those in higher levels of education, which favors the adoption of habits related to healthy practices and protect against this outcome.
Several authors31-33 have investigated associations between behavioral factors and
hypertension and have proven deleterious efects arising from alcohol abuse31, sedentary
behavior32 and excessive sodium intake33. In the present study, however, it was not possible
to identify associations between these factors and hypertension. The reverse causality bias inherent to cross-sectional studies may have masked, at least in part, these associations, having been identiied, for example, prevalence of hypertension of lower magnitude among men ranked in the top tertile of sitting time, and lower prevalence of the outcome among women classiied in the last quarter of sodium and cholesterol consumption. Other examples of reverse causality bias were observed in both sexes for the variables “smoking time” and “AUDIT risk zones” one may suppose that, just because they are hypertensive, possible recommendations regarding changing habits such as smoking and alcohol consumption may have resulted in greater concentration of hypertensive in the levels of lower exposure of these variables. In the exploratory analysis of this study, another example of reverse causality was represented by physical activity. The short version of the International Physical Activity Questionnaire – IPAQ19 allows, beyond the sitting time, calculating the physical activity
patterns, according to intensity (mild, moderate and vigorous) and also according to the metabolic waste expressed in mets*min*week-1. The presence of reverse causality between
these two components of physical activity and hypertension, however, limited inferences about the association found, thus opting for “sitting time”, less susceptible to this bias.
It is considered appropriate to highlight that although the us-CRP and plasma ibrinogen variables have presented global associations with the outcome, in both sexes, and the prevalence of hypertension have shown a dose-response relation to ibrinogen levels, results that are compatible with those of other authors34,35, both variables did not remain in the inal models. Variables with
strong efect on blood pressure, such as central obesity anthropometric indexes, may have reduced the inluence of these biochemical markers of inlammation on hypertension. These indings were corroborated by Lakoski et al.34 in the cohort of the Multi-Ethnic Study of Atheroeclerosis
(MESA), in which the authors found that the efect of proteins related to inlammation such as Interleukin 6, us-CRP and plasma ibrinogen on hypertension was attenuated after inclusion in the multivariate models of powerful predictors of hypertension, as opposed to global and central obesity indexes, which remained consistently associated with the outcome.
In the present study, central obesity indexes were independently associated with hypertension, having been observed a linear gradient for the respective adjusted prevalence ratios in both sexes (inal models), evidencing also the efect of the Conicity index (CI) on hypertension, which has been little investigated in population-based studies. Epidemiological studies with cohort or cross-sectional design carried out in the United States34, Brazil36 and
ten European countries37 between 1993 and 2010 conirm the consistency of the association
between measures of central obesity and hypertension.
It is appropriate to emphasize, moreover, the results reported by Barquera et al.38
in the relation between sitting time and hypertension. Thus, this study confirms the relevance of the findings presented, as well as the inclusion of sitting time as a confounding variable in the multivariate models. Results from ongoing studies with data from the EPIDCV Project and in which multilevel structural equation models were applied should certainly clarify direct, indirect and reciprocal potential effects of individual and/or aggregated level variables on chronic outcomes, among which includes hypertension.
Among the main limitations of the study, stands out the cross-sectional design that carries the bias of reverse causality, as already mentioned. Another important limitation that reduces the comparative ability of these results is the lack of analytical population-based epidemiological studies on chronic outcomes with primary data collection in representative samples of Brazilian populations, and it is rare in cross-sectional studies, corrections for the sampling design efect when using cluster sampling techniques.
In a meta-analysis paper recently published which included 40 Brazilian articles with cohort and cross-sectional designs, for the period 1980 – 2010, Picon et al.39 investigated
the prevalence and trends of hypertension between 1980 and 2000. Results of this meta-analysis, in which the authors used random-effects models, revealed absolute decline of 6% in the prevalence of hypertension between 1980 (36.7%) and 2000 (30.7%) when taken into consideration some cross-sectional studies with adjusted results for the sampling design effect. However, plausible explanations for this decline are not clear, because are scarce in the country time series studies on the evolution of risk factors or on the prevalence and control of hypertension, limiting inferences that could support intervention measures.
The results of EPIDCV Project indicated high prevalence of hypertension in both sexes, especially among women, reairming that the municipality is already between the fourth and the ifth stage of the epidemiological transition, and recent results concerning the local population indicated that nutritional transition is being led by women27.
CONCLUSION
The study results impose the need to planning health promotion and prevention towards the control of hypertension and central obesity in order to reduce the inal events, such as ischemic heart disease and stroke.
ACKNOWLEDGMENTS
1. Caballero B, Popkin BM. Introduction. In: Caballero B, Popkin BM, editors. The nutrition transition: diet and disease in the developing world. London: Academic Press; 2002. p. 16-21.
2. World Health Organization. A global brief on hypertension: silent killer, global public health crisis. Geneva: WHO; 2013. (WHO/DCO/WHD/2013.2).
3. Jardim PCBV, Gondim MRP, Monego ET, Moreira HG, Vitorino PVO, Souza WKSB, et al. Hipertensão arterial e alguns fatores de risco em uma capital brasileira. Arq Bras Cardiol 2007; 88(4): 452-7.
4. Hartmann M, Dias-da-Costa JS, Olinto MTA, Pattussi MP, Tramontini A. Prevalência de hipertensão arterial sistêmica e fatores associados: um estudo de base populacional em mulheres no sul do Brasil. Cad Saúde Pública 2007; 23(8): 1857-66.
5. Barreto SM, Passos VM, Firmo JO, Guerra HL, Vidigal PG, Lima-Costa MF. Hypertension and clustering of cardiovascular risk factors in a community in southeast Brazil – the Bambuí health and ageing study. Arq Bras Cardiol 2001; 77(6): 576-81.
6. Panagiotakos DB, Chrysohoou C, Pitsavos C, Skoumas J, Lentzas Y, Katinioti A et al. Hierarquical analysis of anthropometric indices in the prediction of 5-year incidence of hypertension in apparently healthy adults: The ATTICA Study. Atherosclerosis 2009; 206(1): 314-20.
7. Ostchega Y, Hughes JP, Terry A, Fakhouri TH, Miller I. Abdominal obesity, body mass index, and hypertension in US Adults: NHANES 2007-2010. Am J Hypertens 2012; 25(12): 1271-78.
8. Lee CMY, Huxley RR, Wildman RP, Woodward M. Indices of abdominal obesity are better discriminators of cardiovascular risk factors than BMI: a meta-analysis. J Clin Epidemiol 2008; 61(7): 646-53.
9. S ilva DA, Petroski EL, Peres MA. Accuracy and measures of association of anthropometric indexes of obesity to identify the presence of hypertension in adults: a population-based study in Southern Brazil. Eur J Nutr 2013; 52(1): 237-46.
10. Moraes SA, Freitas ICM. Doença isquêmica do coração e fatores associados em adultos de Ribeirão Preto, SP. Rev Saúde Pública 2012; 46(4): 591-601.
11. Bland M. Sampling in Observational Studies. In: Introduction to Medical Statistics. New York: Oxford University Press Inc; 2000. p. 26-46.
12. Silva NN. Amostragem probabilística: um curso introdutório. 2 ed. São Paulo: EDUSP 2001. 120 p.
13. Sociedade Brasileira de Cardiologia/Sociedade Brasileira de Hipertensão/Sociedade Brasileira de Nefrologia. VI Diretrizes Brasileiras de Hipertensão. Arq Bras Cardiol 2010; 95 (1 Suppl 1):1-51.
14. World Health Organization. Obesity: prevent and managing the global epidemic. Report of a WHO Consultation. Geneva: WHO; 2000. (WHO Technical Report Series 894) .
15. Alberti G, Zimmet P, Shaw J, Grundy SM. The IDF consensus worldwide definition of the metabolic syndrome. Brussels: Inter national Diabetes Federation; 2006.
16. Valdez R. A simple model-based index of abdominal adiposity. J Clin Epidemiol 1991; 44(9): 955-6.
17. Habicht JP, Butz WP. Measurement of health and nutrition effects of large-scale nutrition intervention projects. In: Klein RE. Evaluation of the impact of nutrition and health programs.New York: Plenum Press; 1979. p. 133-89.
18. Babor TF, Rig g ins-Biddle JC, Saunders JB, Monteiro MG. AUDIT: The Alcohol Use Disorders Identification Test. Geneva: Department of Mental Health and Substance Dependance, World Health Organization; 2001.
19. Craig CL, Marshall AL, Sjostrom M, Bauman AE, Booth ML, Pratt M et al. International Physical Questionnaire: 12-county reability and validity. Med Sci Sports Exercise 2003; 35(8): 1381-95.
20. Fornés NS, Martins IS, Velásquez-Melendez G, Latorre MRDO. Escores de consumo alimentar e níveis lipêmicos em população de São Paulo, Brasil. Rev Saúde Pública 2002: 36(1): 12-8.
21. Willett WC, Howe GR, Kushi LH. Adjustment for total energy intake in epidemiologic studies. Am J Clin Nutr 1997; 65(4 Suppl):1220S-8S.
22. Sk inner CJ, Smith TMF. Analysis of complex surveys. Chichester: John Willey and Sons, 1989.
23. Barros AJ, Hirakata VN. Alternatives for logistic regression in cross-sectional studies: an empirical comparison of models that directly estimate the prevalence ratio. BMC Med Res Methodol 2003; 3: 21.
24. Passos VMA, Assis TD, Barreto SM. Hipertensão arterial no Brasil: estimativa de prevalência a partir de estudos de base populacional. Epidemiol Serv Saúde 2006; 15(1): 35-45.
25. Pereira MR, Coutinho MSSA, Freitas PF, D’Orsi E, Bernardi A, Hass R. Prevalência, conhecimento, tratamento e controle de hipertensão arterial sistêmica na população adulta urbana de Tubarão, Santa Catarina,
Brasil, em 2003. Cad Saúde Pública 2007; 23(10): 2363-74.
26. Longo GZ, Neves J, Luciano VM, Peres MA. Prevalência de níveis pressóricos elevados e fatores associados em adultos de Lages/SC. Arq Bras Cardiol 2009; 93(4): 387-94.
27. Moraes SA, Humberto JSM, Freitas ICM. Estado nutricional e fatores sociodemográicos em adultos residentes em Ribeirão Preto, SP, 2006. Projeto OBEDIARP. Rev Bras Epidemiol 2011; 14(4): 662-76.
28. Suzuki CS, Moraes SA, Freitas ICM. Média diária de tempo sentado e fatores associados em adultos residentes no município de Ribeirão Preto-SP, 2006: Projeto OBEDIARP. Rev Bras Epidemiol 2010; 13(4): 699-712.
29. Mondini L, Moraes SA, Freitas ICM, Gimeno SGA. Consumo de frutas e hortaliças por adultos em Ribeirão Preto, SP. Rev Saúde Pública 2010; 44(4): 686-94.
30. Kearney PM, Whelton M, Reynolds K, Muntner P, Whelton PK, He J. Global burden of hypertension: analysis of worldwide data. Lancet 2005; 365(9455): 217-23.
31. Judd SE, McClure LA, Howard VJ, Lackland DT, Halanych JH, Kabagambe EK. Heavy drinking is associated with poor blood pressure control in the REasons for geographic and racial diferences in stroke (REGARDS) study. Int J Environ Res Public Health 2011; 8(5): 1601-12.
32. de Heer HD, Wilkinson AV, Strong LL, Bondy ML, Koehly LM. Sitting time and health outcomes among Mexican origin adults: obesity as a mediator. BMC Public Health 2012; 12: 896.
33. Chateau-Degat ML, Ferland A, Déry S, Dewailly É. Dietary sodium intake deleteriously affects blood pressure in a normotensive population. Eur J Clin Nutr 2012; 66(4): 533-5.
34. L a k o s k i S G, C u s h m a n M , S i s c ov i c k D S, Blumenthal RS, Palmas W, Burke G et al. The
relationship between inflammation, obesity and risk for hypertension in the multi-ethnic study of atherosclerosis (MESA). J Hum Hypertens 2011; 25(2): 73-9.
35. Shankar A, Wang JJ, Rochtchina E, Mitchell P. Positive association between plasma fibrinogen level and incident hypertension among men: population-based cohort study. Hypertension 2006; 48(6): 1043-9.
36. Peixoto MRG, Benício MHDA, Latorre MRDO, Jardim PCBV. Circunferência da cintura e índice de massa corporal como preditores da hipertensão arterial. Arq Bras Cardiol 2006; 87(4): 462-70.
37. Canoy D, Luben R, Welch A, Bingham S, Wareham N, Day N et al. Fat distribution, body mass index and blood pressure in 22.090 men and women in the Norfolk cohort of the European Prospective Investigation into Cancer and Nutrition (EPIC-Norfolk) study. J Hypertens 2004; 22(11): 2067-74.
38. Barquera S, Campos-Nonato I, Hernández-Barrera L, Villalpando S, Rodríguez-Gilabert C, Durazo-Arvizú R, et al. Hypertension in mexican adults: results from the national health and nutrition survey 2006. Salud Publica Mex 2010; 52(Suppl 1): S63-71.
39. Picon RV, Fuchs FD, Moreira LB, Riegel G, Fuchs SC. Trends in prevalence of hypertension in Brazil: a systematic review with meta-analysis. PLoS ONE 2012; 7(10): e48255.
Received on: 01/15/2014