ABSTRACT:Objective: To analyze sociodemographic factors associated with alcohol use according to gender in Brazil. Methods: Cross-sectional study using data from 2013 Brazilian Health Survey about 60,202 adults. We analyzed recent alcohol use and heavy episodic drinking in the 30 days prior to the research stratiied by gender. The covariates were: age, educational level, skin color, marital status, and place of residence. Results:
The prevalence of recent alcohol use was 26.5%. In women, the prevalence was 14.4%; in men, 38.1%. In women, recent alcohol use was associated with younger age, higher educational level, being single or separated/ divorced, and living in urban areas. In men, there was association with white skin color in addition to these factors. Among adults who used alcohol, 51.5% reported heavy episodic drinking — in women, this proportion was 43.4%; in men, 55.0%. In women, heavy episodic drinking was associated with younger age, being single or separated/divorced and living in urban areas; white skin color and higher educational level had negative association with this pattern. In men, heavy episodic drinking was directly associated with younger age and being single or divorced and inversely to white skin color; there was no signiicant relation with education and place of residence. Conclusion: We observed that men consume more alcohol than women. There is a convergence of alcohol consumption, including heavy episodic drinking, between men and women who are younger, single and divorced, and residents of urban areas. Skin color, educational level, and place of residence showed variations in the models by sex.
Keywords: Epidemiology. Alcohol drinking. Binge drinking. Socioeconomic factors.
Brazilian Health Survey (2013): relation
between alcohol use and sociodemographic
characteristics by sex in Brazil
Pesquisa Nacional de Saúde 2013: relação entre uso de álcool e
características sociodemográicas segundo o sexo no Brasil
Ísis Eloah MachadoI, Maristela Goldnadel MonteiroII, Deborah Carvalho MaltaIII, Francisco Carlos Félix LanaIII
INursing Graduation Program, Universidade Federal de Minas Gerais – Belo Horizonte (MG), Brazil.
IIMental Health and Substance Use Unit, Pan American Health Organization – Washington, D.C., United States.
IIIDepartment of Women’s and Children’s Nursing and Public Health, Nursing School, Universidade Federal de Minas Gerais –
Belo Horizonte (MG), Brazil.
Corresponding author: Ísis Eloah Machado. Programa de Pós-Graduação em Enfermagem. Universidade Federal de Minas Gerais. Rua Conde Ribeiro do Vale, 836/102, CEP: 31030-470, Belo Horizonte, MG, Brasil. E-mail: [email protected]
Conlict of interests: nothing to declare – Financial support: none.
INTRODUCTION
The heavy use of alcoholic beverages is a relevant public health issue and it is one of the main ive risk factors of death and disability in the world1. The World Health Organization (WHO) estimates that 5.9% of all overall deaths happen due to alcohol every year. Its harm-ful use causes death and disability of relatively young people, resulting in the loss of many life years1.
About half of the alcohol-related deaths occur due to noncommunicable diseases because of its chronic use, such as cancer, cardiovascular diseases, mental illnesses and liver cirrhosis1,2. On the other hand, the acute and episodic alcohol use constitutes a risk factor for external causes, such as transportation and work accidents, violence, among others, especially among young men1-3. American countries present a problem of larger magnitude than the overall average regarding the alcohol per capita consumption and the prevalence of heavy episodic use and of alcohol-related disorders, whereas European countries stay right behind them1,4. Brazil overcomes the average of Americas regarding the annual consumption of pure alcohol per person aged 15 years and older1, and the alcohol use in the country is the fourth risk factor of the overall disease burden5. The country is also in the top list of those presenting the highest mortality rates attributable to alcohol in Americas4, and faces the growth in the national stan-dardized rate of mortality due to basic or alcohol-related causes, which changed from 12.3 deaths per 100,000 residents, in 2000, to 15.9 deaths per 100,000 residents, in 20136 — a num-ber that may still be underrated due to sub-recording4,6.
RESUMO:Objetivo: Analisar fatores sociodemográicos associados ao uso de álcool segundo o sexo no Brasil.
Métodos: Estudo transversal com dados provenientes da Pesquisa Nacional de Saúde, de 2013, sobre 60.202 adultos. Analisou-se o uso recente e o uso episódico excessivo de álcool nos 30 dias anteriores à pesquisa segundo sexo. As covariáveis foram: idade, escolaridade, cor da pele, estado civil e local de residência. Resultados: A prevalência de uso recente de álcool foi de 26,5%, sendo 14,4% em mulheres e 38,1% em homens. O uso recente de álcool entre as mulheres foi associado às variáveis idade jovem, maior escolaridade, estar solteira ou separada/divorciada e viver em área urbana. Em homens, além dos fatores supracitados, houve associação com a cor da pele branca. Dos indivíduos que usaram álcool, 51,5% relataram uso episódico excessivo — entre as mulheres, a proporção foi 43,4%; entre os homens, 55,0%. Nas mulheres, o uso episódico excessivo de álcool esteve associado à idade jovem, estar solteira ou separada/divorciada e viver em área urbana; cor branca e ter ensino superior tiveram associação inversa com esse padrão. Em homens, o uso episódico excessivo de álcool esteve diretamente associado à idade jovem e a estar solteiro ou separado/divorciado, e inversamente à cor branca; não houve relação signiicativa com escolaridade e local de residência. Conclusão: Observou-se que os homens consomem mais álcool. Porém, constatou-se uma convergência do consumo de álcool, incluindo o uso episódico excessivo, entre homens e mulheres mais jovens, solteiros(as) e divorciados(as) e residentes de área urbana. Cor de pele, escolaridade e local de residência mostraram variações nos modelos entre sexos.
In general, consumption and presence of alcohol-related disorders are higher among men than women, both national and internationally1,6-9. In the year of 2012, 7.6% of the deaths among men were attributed to alcohol in comparison with 4.0% of deaths among women in the world1. In addition, men presented a higher proportion of global burden of disease, which is expressed in years of potential life lost due to premature death and disability attributed to alco-hol, than women — 7.4% in comparison with 2.3% in the female sex1. Data of the Brazilian Mortality Information System (SIM) show that the rate of deaths due to alcohol use was 5.4 times, on average, higher for men than for women in the 2000-2013 period6.
Although diferences are remarkable between sexes, alcohol use, especially heavy episodic drinking, has increased in women10. A survey from Universidade Federal de São Paulo (Unifesp) shows that among the non-abstinent population, the consumption of 5 or more doses of alcoholic beverages for men or 4 or more doses for women throughout a 12-month period increased 31.1% from 2006 to 2012, and women showed a growth of 36.0%11. Thus, research on the diferences of alcohol use between men and women are very important, because they support the identiication of risk groups in the population and are also useful for for-mulating policies regarding damage prevention and reduction.
Studies show that the amount and standard of alcohol use vary in the Brazilian popula-tion according to factors such as age, ethnicity/skin color, socioeconomic condipopula-tion and/ or education, work, marital status, and neighboring characteristics. These factors may work diferently between men and women9,12-15. However, studies that provide a sex-stratiied anal-ysis published in Brazil9,12-15 present divergent results and do not have national scope, so the use of a sample with national representativeness is relevant.
Therefore, this study aims to analyze the sociodemographic factors associated with recent alcohol use and heavy episodic drinking according to sex in Brazil, by using a large sample.
METHODS
This is a cross-sectional study based on data from the 2013 Brazilian Health Survey (PNS). The PNS is a household national survey with the aim of producing data about the popula-tion’s health condition, life styles and healthcare. It was carried out by the Brazilian Ministry of Health together with the Brazilian Institutes of Geography and Statistics (IBGE)16. It was a three-phase sampling. The census tracts were chosen in the irst phase; the private house-holds were chosen in the second; and an 18-year-old or older resident was chosen in the third phase. The total size of the 2013 PNS sample was 64,348 households16.
The sample used in the present study included 60,202 subjects aged older than 18 years distributed into 26 Brazilian states and in the District Federal in 2013. The average amount of observations per state was 2,229.7, but it varied from 1,332 in the state of Amapá to 5,305 in the state of São Paulo.
Outcomes
1. Recent alcohol use: consumption of alcoholic beverages in 30 days before the research, regardless of the amount.
2. Heavy episodic drinking: consumption of 5 or more doses (men) or 4 or more doses (women) in a single occasion at least once in 30 days before the research.
Sociodemographic characteristics 1. Sex: female, male.
2. Skin color: white — adults that self-report themselves as white and oriental; non-white — subjects that self-declare themselves as black- or brown-skinned and indigenous. 3. Age: 18 to 24 years; 25 to 34 years; 35 to 44 years; 45 to 54 years; 55 to 64 years;
and 65years or older.
4. Educational level: no instruction and incomplete elementary school; complete elementary school and incomplete high school; complete high school and incomplete upper school; complete upper school.
5. Marital status: single; married; separated/divorced; widowed. 6. Area of residence: rural; urban.
A descriptive analysis of the individual variables was performed through calculation of absolute and relative frequencies and, then, bivariate analyses were performed to assess the association between the outcomes and the sociodemographic characteristics by using Pearson’s χ2 test. The analyses of heavy episodic drinking were conducted in adults who reported alcohol use in 30 days before the research.
Prevalence ratios (PR) of recent alcohol use adjusted by all the other variables were calculated through multivariate Poisson regression, with an estimator of robust variance, considering non-use of alcohol in 30 days before the research as a reference. The same technique was non-used for the heavy episodic drinking; however, the model included only subjects who reported consuming alcohol in this period, while not reporting heavy episodic drinking was considered a reference.
The analyses were performed separately for men and women in the Survey module of the Stata 12 software that incorporates the complex sampling design used by the PNS.
The research fulils the determinations of the Resolution 466/12 of the Brazilian Health Council (CNS) that established guidelines and standards for researches with human beings. The Research Ethics Committee of Universidade Federal de Minas Gerais (COEP/UFMG) approved this paper under protocol CAAE 40656515.9.0000.5149. The Research Ethics National Commission (CONEP) of CNS also approved the PNS under protocol CAAE 10853812.7.0000.0008.
RESULTS
25 and 34, with complete upper school or graduation, single, and residents in urban areas had the highest rates of recent alcohol use (Table 1).
The prevalence of heavy episodic drinking in the population was 13.7%: 21.6% for males and 6.6% for females. Groups presenting the highest frequency of heavy episodic drinking were white-skinned, ages between 25 and 34, complete elementary school and incomplete high school, single and residents in urban areas (Table 1).
Among men, alcohol use in 30 days before the research was more frequent among white-skinned subjects, aged between 25 and 34, with upper educational level, separated or divorced and resident in rural areas. The same pattern was seen among women, but higher frequency of alcohol use was observed in the group of 18-24 years old, and the frequency among single and separated women was similar (Table 2).
The difference between prevalence of recent alcohol use among men and women was lower in the youngest ages. While recent alcohol use was 4.4 times more preva-lent in the 65 and older age group in men compared to women in the ages of 18-25 age group, the prevalence among men was only 1.9 times higher. The differences also decrease with increase of the educational level and decrease among men who are sin-gle, separated and resident in urban areas (Table 2).
Considering only those who consumed alcohol in 30 days before the research, heavy epi-sodic drinking was seen in 51.5% of the population: 55.0% for men and 43.4% for women. The prevalence of heavy episodic drinking was higher in non-white-skinned subjects in the ages of 25 and 34, followed by the ages of 18 and 24 years, with complete high school or higher educational level, in singles and residents in urban areas. The same pattern was seen among women, with the exception regarding the educational level, because the com-plete elementary school and incomcom-plete high school level had higher frequency of heavy episodic drinking (Table 3).
Diferences between men and women in the proportion of heavy episodic drinking decreased in the youngest ages, among single and separated men and residents in urban areas; it was even lower among the non-white skinned population and those with complete elementary school and incomplete high school, where the prevalence between men was 6% higher than among women (Table 3).
Men showed an association of recent alcohol use with white skin color, the ages of 25 to 64 years, and the ages of 25 to 34 presented the highest PR, complete elementary school to incomplete high school or complete upper school, being single or separated, and living in urban areas.
Among women, the ages between 18 and 64 presented association with alcohol use in comparison with the age of 65 or older (p < 0.05), and the ages of 18 to 25 years and 25 and 34 years had the highest PR. Increase of educational level, being single or separated, and living in urban areas were the factors associated with recent alcohol use. Skin color did not show a signiicant association in this group (p = 0.55) (Table 4).
Variables (n) Total population Non-use Recent use
a Heavy episodic
drinkingb
% 95%CI % 95%CI % 95%CI % 95%CI
Sex
Male (25,920) 47.1 46.4 – 47.9 60.8 59.6 – 61.9 39.2 38.1 – 40.4 21.6 20.7 – 22.5 Female (34,282) 52.9 52.2 – 53.6 84.8 84.0 – 85.6 15.2 14.4 – 16.0 6.6 6.1 – 7.1 Skin color
Non-white (35,563) 51.6 50.8 – 52.4 74.7 73.7 – 75.6 25.3 24.4 – 26.3 14.8 14.2 – 15.5 White (24,639) 48.4 47.6 – 49.2 72.2 71.1 – 73.2 27.8 26.8 – 28.9 12.4 11.7 – 13.2 Age (years)
65 or older (7,712) 12.3 11.8 – 12.8 87.6 86.2 – 88.8 12.4 11.2 – 13.8 2.9 2.3 – 3.5 55 to 64 (7,681) 13.5 13.0 – 14.0 77.7 76.0 – 79.3 22.3 20.7 – 24.0 7.7 6.8 – 8.8 45 to 54 (10,246) 17.5 17.0 – 18.1 73.2 71.5 – 74.7 26.9 25.3 – 28.5 13.1 12.0 – 14.2 35 to 44 (12,817) 19.2 18.6 – 19.8 71.5 70.1 – 72.9 28.5 27.1 – 29.9 15.7 14.6 – 16.7 25 to 34 (13,923) 21.6 21.0 – 22.2 67.5 66.0 – 69.0 32.5 31.0 – 34.0 19.6 18.3 – 20.9 18 to 24 (7,823) 15.9 15.4 – 16.5 69.9 67.9 – 71.8 30.1 28.2 – 32.2 17.3 15.7 – 18.9 Educational level
Until incomplete elementary
school (24,083) 38.9 38.1 – 39.8 78.8 77.8 – 79.8 21.2 20.2 – 22.2 11.1 10.5 – 11.8 Complete elementary
and incomplete high schools (9,215)
15.5 15.0 – 16.1 70.9 69.2 – 72.6 29.1 27.4 – 30.8 15.8 14.5 – 17.2
Complete high school and incomplete upper school (19,149)
32.8 32.1 – 33.5 71.4 70.1 – 72.6 28.6 27.4 – 29.9 15.4 14.4 – 16.3
Complete upper school
(7,755) 12.7 12.0 – 13.5 65.7 63.8 – 67.6 34.3 32.4 – 36.3 14.3 12.9 – 15.9 Marital status
Married (23,741) 44.3 43.5 – 45.1 76.6 75.6 – 77.6 23.4 22.5 – 24.4 9.9 9.3 – 10.6 Single (27,026) 42.5 41.8 – 43.3 68.2 67.1 – 69.3 31.8 30.7 – 32.9 18.9 18.0 – 19.8 Separated/
Divorced (4,727) 6.5 6.2 – 6.9 70.3 67.6 – 72.8 29.7 27.2 – 32.4 15.3 13.4 – 17.4 Widowed (4,708) 6.7 6.4 – 7.0 89.2 87.5 – 90.7 10.8 9.3 – 12.5 3.6 2.9 – 4.5
Area of residence
Rural (49,245) 86.2 85.8 – 86.7 72.5 71.7 – 73.3 20.3 18.8 – 21.9 10.3 9.2 – 11.4 Urban (10,957) 13.8 13.3 – 14.3 79.7 78.1 – 81.2 27.5 26.7 – 28.4 14.2 13.6 – 14.8 Total (60,202) 100 – 73.5 72.7 – 74.2 26.5 25.8 – 27.3 13.7 13.1 – 14.2
Table 1. Prevalence of recent alcohol use and heavy episodic drinking among adults according to
sociodemographic characteristics, Brazilian Health Survey, Brazil, 2013.
aConsumption of any amount of alcohol in 30 days before the research; bConsumption of 4 or more doses of alcohol
Variables
Men Women
Non-use Recent alcohol use aa
p-valueb
Non-use Recent alcohol use aa
p-valueb
% 95%CI % 95%CI % 95%CI % 95%CI
Skin color
Non-white 63.0 61.5 – 64.4 37.0 35.6 – 38.5
< 0,001 85.4 84.3 – 86.4 14.6 13.6 – 15.8 < 0,001 White 58.3 56.6 – 60.0 41.7 40.0 – 43.4 84.2 83.1 – 85.3 15.8 14.7 – 16.9 Age (years)
65 or older 78.0 75.3 – 80.6 22.0 19.4 – 24.7
< 0,001
95.0 93.8 – 96.0 5.0 4.0 – 6.2
< 0,001 55 to 64 64.1 61.2 – 66.9 35.9 33.1 – 38.9 89.2 87.4 – 90.9 10.8 9.1 – 12.6 45 to 54 59.3 56.7 – 61.9 40.7 38.1 – 43.3 85.5 83.9 – 87.0 14.5 13.0 – 16.1 35 to 44 57.3 55.0 – 59.6 42.7 40.4 – 45.0 83.8 82.3 – 85.1 16.2 14.9 – 17.7 25 to 34 54.2 51.9 – 56.4 45.8 43.6 – 48.1 80.1 78.3 – 81.8 19.9 18.2 – 21.7 18 to 24 60.5 57.7 – 63.3 39.5 36.7 – 42.3 79.0 76.3 – 81.4 21.0 18.6 – 23.7 Educational level
Until incomplete elementary school
65.8 64.1 – 67.4 34.2 32.6 – 35.9
< 0,001
90.9 90.1 – 91.7 9.1 8.3 – 10.0
< 0,001 Complete
elementary and incomplete high schools
57.9 55.2 – 60.6 42.1 39.4 – 44.8 84.0 82.0 – 85.8 16.0 14.2 – 18.0
Complete high school and incomplete upper school
59.0 57.0 – 61.0 41.0 39.0 – 43.0 82.0 80.6 – 83.3 18.0 16.7 – 19.4
Complete
upper school 52.2 49.1 – 55.2 47.8 44.8 – 50.9 75.6 73.3 – 77.8 24.4 22.2 – 26.8 Marital status
Married 64.7 63.1 – 66.2 35.3 33.8 – 36.9
< 0,001
88.3 87.3 – 89.2 11.7 10.8 – 12.7
< 0,001 Single 56.5 55.0 – 58.0 43.5 42.0 – 45.0 80.0 78.7 – 81.3 20.0 18.7 – 21.3 Separated/
divorced 55.7 51.0 – 60.2 44.3 39.8 – 49.0 79.9 76.8 – 82.6 20.2 17.4 – 23.2 Widowed 74.4 68.8 – 79.3 25.6 20.8 – 31.2 92.8 91.1 – 94.2 7.2 5.8 – 8.9
Area of residence
Rural 67.8 65.5 – 69.9 32.3 30.1 – 34.5
< 0,001 92.3 90.9 – 93.4 7.7 6.6 – 9.1 < 0,001 Urban 59.5 58.3 – 60.8 40.5 39.2 – 41.7 83.7 82.8 – 84.6 16.3 15.4 – 17.2 Total 60.8 59.6 – 61.9 39.2 38.1 – 40.4 84.8 84.0 – 85.6 15.2 14.4 – 16.0
Table 2. Prevalence of recent alcohol use among adults according to sex and sociodemographic
characteristics, Brazilian Health Survey, Brazil, 2013.
aConsumption of any amount of alcohol in 30 days before the research; bp-value of Pearson’s χ2 test; 95%CI: 95%
Variables
Total (n = 14,595)
Men (n = 9,683)
Women (n = 4,912)
% 95%CI valuep- b % 95%CI
p-
valueb % 95%CI
p- valueb
Skin color
Non-white 58.5 56.5 – 60.5
< 0.001 61.6 59.3 – 63.8 < 0.001 51.4 47.9 – 54.9 < 0.001 White 44.6 42.4 – 46.9 48.6 45.9 – 51.2 35.6 32.3 – 39.1
Age (years)
65 or older 23.0 18.8 – 27.8
< 0.001
26.0 20.7 – 32.0
< 0.001
12.8 8.3 – 19.1
< 0.001 55 to 64 34.5 30.6 – 38.7 37.4 32.7 – 42.4 26.4 20.0 – 34.0
45 to 54 48.7 45.4 – 51.9 53.3 49.3 – 57.4 36.9 31.8 – 42.3
35 to 44 54.9 52.1 – 57.7 59.2 55.7 – 62.5 45.1 40.7 – 49.7
25 to 34 60.2 57.5 – 62.7 63.4 60.1 – 66.6 53.1 48.5 – 57.6
18 to 24 57.2 53.3 – 61.1 62.2 57.4 – 66.8 48.1 42.2 – 54.2
Educational level
Until incomplete
elementary school 52.5 50.0 – 55.0
< 0.001
55.2 52.3 – 58.0
0.01
43.4 38.9 – 48.0
< 0.001 Complete elementary and
incomplete high schools 54.4 50.6 – 58.0 55.3 50.9 – 59.7 51.8 45.1 – 58.5
Complete high school and
incomplete upper school 53.6 51.2 – 56.1 57.5 54.4 – 60.4 46.2 42.2 – 50.2
Complete upper school 41.8 38.2 – 45.4 48.2 43.5 – 53.0 32.5 28.0 – 37.4
Marital status
Married 42.4 40.2 – 44.7
< 0.001
45.9 43.3 – 48.5
< 0.001
32.2 28.5 – 36.3
< 0.001 Single 59.4 57.3 – 61.4 63.2 60.8 – 65.6 51.0 47.5 – 54.5
Separated/divorced 51.4 46.3 – 56.4 54.2 47.3 – 60.8 47.4 39.4 – 55.5
Widowed 33.2 26.8 – 40.2 41.4 31.2 – 52.5 26.1 18.9 – 34.9
Area of residence
Rural 50.5 46.7 – 54.3
0.614 53.6 49.5 – 57.7 0.49 36.9 29.7 – 44.7 0.09 Urban 51.6 49.9 – 53.2 55.2 53.3 – 57.1 43.8 41.2 – 46.4
Total 51.5 49.9 – 53.0 55.0 53.2 – 56.7 43.4 40.9 – 45.8
Table 3. Rate of heavy episodic drinking among adults that drank alcohola according to sex and
sociodemographic characteristics, Brazilian Health Survey, Brazil, 2013.
aConsumption of 4 or more doses of alcohol for women and 5 or more doses of alcohol for men in a single occasion in
30 days before the research among those who consumed alcohol in this period; bp-value of Pearson’s χ2 test; 95%CI:
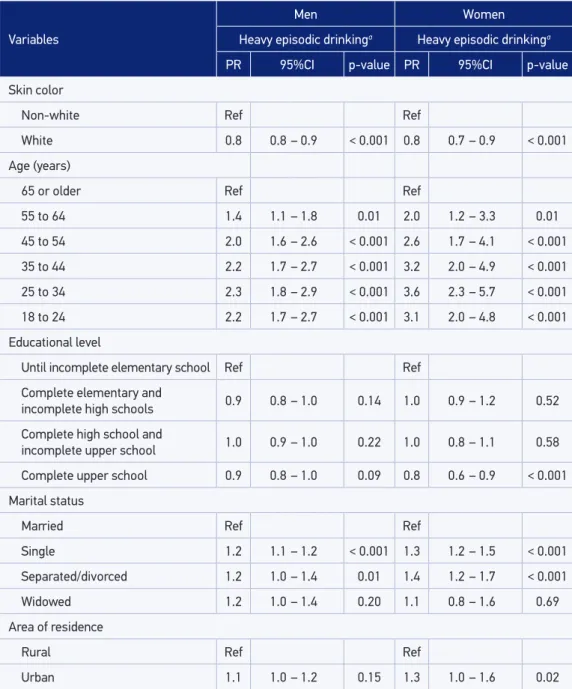
association with the age of 65 or older (p < 0.001), and the ages 25 to 34 years are the ones with higher PR. Being single or separated presented low, yet signiicant, association, among men. The area of residence did not show association with this pattern of use in this group (Table 5).
White-skinned women and those with upper educational level had lower PR of heavy episodic drinking. All the ages showed a signiicant association regarding the age of 65,
Variables
Men Women
Recent alcohol usea Recent alcohol usea
PR 95%CI valuep- PR 95%CI valuep-
Skin color
Non-white Ref Ref
White 1.1 1.1 – 1.2 < 0.001 1.0 0.9 – 1.1 0.55
Age (years)
65 or older Ref Ref
55 to 64 1.6 1.4 – 1.8 < 0.001 1.9 1.4 – 2.5 < 0.001 45 to 54 1.7 1.5 – 2.0 < 0.001 2.4 1.8 – 3.1 < 0.001 35 to 44 1.8 1.6 – 2.1 < 0.001 2.4 1.9 – 3.2 < 0.001 25 to 34 1.9 1.6 – 2.1 < 0.001 2.8 2.1 – 3.6 < 0.001 18 to 24 1.5 1.3 – 1.8 < 0.001 2.8 2.1 – 3.6 < 0.001 Educational level (in years)
Until incomplete elementary school Ref Ref
Complete elementary and
incomplete high schools 1.1 1.0 – 1.2 0.03 1.3 1.1 – 1.5 < 0.001 Complete high school and
incomplete upper school 1.0 1.0 – 1.1 0.49 1.4 1.2 – 1.6 < 0.001 Complete upper school 1.2 1.1 – 1.3 < 0.001 2.0 1.8 – 2.3 < 0.001 Marital status
Married Ref Ref
Single 1.2 1.1 – 1.3 < 0.001 1.5 1.4 – 1.7 0.00
Separated/divorced 1.2 1.1 – 1.4 < 0.001 1.7 1.4 – 2.0 0.00
Widowed 1.0 0.8 – 1.2 0.74 1.1 0.8 – 1.4 0.55
Area of residence
Rural Ref Ref
Urban 1.2 1.1 – 1.3 < 0.001 1.8 1.5 – 2.1 0.00
aConsumption of any amount of alcohol in 30 days before the research; *prevalence ratios adjusted by all the studied
variables; PR: prevalence ratio; 95%CI: 95% conidence interval.
Table 4. Adjusted* prevalence ratios of recent alcohol use for men and women, Brazilian Health
and the ages of 25 to 34 had the highest PR. Being single or separated and living in urban areas, in the contrary of being married and living in rural area, were also factors associated with the heavy episodic drinking (Table 5).
*Prevalence ratios adjusted for the all other studied variables; aConsumption of 4 or more doses of alcohol for women and 5 or more doses of alcohol for men in a single occasion in 30 days before the research among those who consumed alcohol in this period; PR: prevalence ratios; 95%CI: 95% conidence interval.
Variables
Men Women
Heavy episodic drinkinga Heavy episodic drinkinga
PR 95%CI p-value PR 95%CI p-value
Skin color
Non-white Ref Ref
White 0.8 0.8 – 0.9 < 0.001 0.8 0.7 – 0.9 < 0.001
Age (years)
65 or older Ref Ref
55 to 64 1.4 1.1 – 1.8 0.01 2.0 1.2 – 3.3 0.01
45 to 54 2.0 1.6 – 2.6 < 0.001 2.6 1.7 – 4.1 < 0.001
35 to 44 2.2 1.7 – 2.7 < 0.001 3.2 2.0 – 4.9 < 0.001
25 to 34 2.3 1.8 – 2.9 < 0.001 3.6 2.3 – 5.7 < 0.001
18 to 24 2.2 1.7 – 2.7 < 0.001 3.1 2.0 – 4.8 < 0.001
Educational level
Until incomplete elementary school Ref Ref
Complete elementary and
incomplete high schools 0.9 0.8 – 1.0 0.14 1.0 0.9 – 1.2 0.52
Complete high school and
incomplete upper school 1.0 0.9 – 1.0 0.22 1.0 0.8 – 1.1 0.58
Complete upper school 0.9 0.8 – 1.0 0.09 0.8 0.6 – 0.9 < 0.001
Marital status
Married Ref Ref
Single 1.2 1.1 – 1.2 < 0.001 1.3 1.2 – 1.5 < 0.001
Separated/divorced 1.2 1.0 – 1.4 0.01 1.4 1.2 – 1.7 < 0.001
Widowed 1.2 1.0 – 1.4 0.20 1.1 0.8 – 1.6 0.69
Area of residence
Rural Ref Ref
Urban 1.1 1.0 – 1.2 0.15 1.3 1.0 – 1.6 0.02
Table 5. Adjusted prevalence ratios* of heavy episodic drinking among subjects who reported
DISCUSSION
This study analyzed the alcohol use patterns among men and women with a large sample of the Brazilian population. We observed that a little more than one third of the male population reported recent alcohol use, and about half of them also presented heavy episodic drinking; and the prevalence of men was more than twice that observed among women.
The analysis stratified by sex also enabled the identification of different relations between sociodemographic characteristics and alcohol use. With regard to recent use, only the association with skin color was different among sexes and, regarding heavy episodic drinking, educational level and area of residence showed different rela-tions for men and women. We could also find a convergence of alcohol use among the youngest subjects, single and divorced and residents of urban areas for both con-sumption patterns.
Previous studies also found that men drink more than women17,18, and diferences in con-sumption refer to the amount and way they drink, besides social and health consequences to which they are subject to2.
Due to biological factors, the intake of the same amount of alcohol produces higher alcoholic concentration in the blood of women19, which could explain the trend of men drinking in higher amounts and more frequently than women. However, the great magni-tude of man/woman ratio observed in diferent contexts suggests that cultural inluence, socioeconomic context, work and the fact that alcohol is a symbol of masculinity expose the male sex more to its use20,21. Therefore, higher frequency of harmful consequences associated with alcohol use is observed among men1,2,7.
We observed in this paper that the prevalence of recent alcohol use and heavy epi-sodic drinking was higher in younger populations, especially among women. Differences between the prevalence of alcohol use and heavy episodic drinking, if we compare men and women, increased with age and therefore they showed higher consumption proximity in the ages of 18 to 24; therefore, they corroborate with reduction in gender differences in alcohol use theory among younger cohorts21. A study performed in the United States also described a decrease in the differences among genders regarding alco-hol use, especially in younger cohorts22. The National Adolescent School-based Health Survey (PeNSE), a survey including 13 to 15-year-old students, pointed that alcohol in this age has been more consumed by girls23.
The ages of 18 to 34 presented the highest risk for alcohol use and heavy episodic drinking among men and women, which is in agreement with other studies9,12-15 and can be explained by the higher tolerance and support of the society to use alcohol among young people, in addition to the investment by the industry in marketing strategies directed to this audience24.
access and by lower social restrictions12,25. However, the educational level was not associated with heavy episodic drinking and it is also a factor that is negatively related to the pattern of higher risk among women.
Epidemiological studies also presented divergences in the association between edu-cational level and socioeconomic level with alcohol use. Some papers found high educa-tional level and/or income associated with risk consumption12,15,26, while others have found a higher rate of drinkers among subjects with lower educational level13,27,28 or did not even ind a relation9,14. Nevertheless, there is strong evidence that people with lower socioeco-nomic level are more susceptible to sufering consequences regarding the use of alcohol29. Therefore, with the aim of decreasing health inequalities, strategies to control and prevent the heavy use of alcohol in this group are extremely important, because these subjects pres-ent a higher concpres-entration of other health risk factors.
In the present study, white-skinned color showed divergences regarding sexes and recent alcohol use: among men, it was associated with recent alcohol use and among women, it was not. However, subjects with this skin color had higher probabilities of heavy episodic drinking, which coincides with lower mortality due to alcohol-related disorders in this group6. This fact might be explained by the synergism of inequali-ties observed in Brazil, where the black population presents the lowest educational levels and socioeconomic condition30, which highlights the need of interventions focused on this group, especially among women, whose difference between ethnici-ties is more remarkable.
Regarding marital status, single and separated/divorced subjects presented a higher pro-portion of recent alcohol use and heavy episodic drinking, and the association was higher among women. Studies have also found that a stable relationship was a protective factor for habitual use of alcohol among women8,9,14,26,31.
Living in urban areas was associated with alcohol use among men and women. No other similar study was found in the country with a representative sampling of urban and rural populations. Nevertheless, results follow a previous study that compared two cities with diferent levels of urbanization13. The hypothesis for such observation is that urbanization increases: access to alcoholic beverages (sale places, kinds of beverages, kinds of events, scheduling, etc.); marketing exposure to sales promotion and other consumption stimuli; and access to paid work, which enables purchasing13.
the proportion of drinkers among genders, which is a similar result to countries with higher development level32.
Brazil is one of the signers of the Global Strategy to Decrease Harmful Use of Alcohol33, which was approved by the World Health Assembly. The document provides recommen-dations on how to structure health services of counseling and treatment; how to involve the community in the identiication of needs and solutions; control policies of the alcohol limit for drivers; restrictions on alcohol physical availability; merchandising control; and increase of taxes and prices33.
Some of these aspects are present in the Brazilian Plan on Alcohol34, in the Noncommunicable Chronic Disease Action Plan35, and in the prohibition to drink and drive36,37. However, after analysis of the public policies adopted in the country regarding decrease of alcohol harmful use, we observed that the main measures that could avoid convergence in the consumption patterns and decrease heavy use of alcohol by men and women, such as restriction of marketing, sponsors and promotions and increase of prices and limits of sales7, are not being adopted in the country. In addition, current laws are not very well regulated, thus resulting in temporary gains in public health, similarly to what has been seen with Lei Seca38.
The study has some limitations. Since the indicators were self-reported, there is a pos-sibility of underrating and due to the cross-sectional design, associations might not indi-cate causality. We use the PR as a measurement of association in the proposed models. Other measurements could have been used, such as the Relative Risk; however, we chose it because of the cross-sectional design.
CONCLUSION
This paper provides developments in the study on alcohol use by the Brazilian population. It also found that alcohol use (including heavy episodic drinking) is more increased in men than in women, and the sex analysis allowed to identify different relations between this use and the analyzed characteristics. Regarding recent alco-hol use, only skin color had a different association between genders: it was positive among white men, but it was not in women. Heavy episodic drinking was associ-ated with living in urban areas and inversely associassoci-ated with educational level only among women. The study also showed convergence of alcohol consumption, includ-ing heavy episodic drinkinclud-ing, among younger men and women, sinclud-ingle and divorced and those living in urban areas.
1. World Health Organization. Health consequences. In: WHO. Global Status Report on Alcohol and Health 2014. Geneva: WHO; 2014. p. 46-58.
2. Rehm J, Baliunas D, Borges GL, Graham K, Irving H, Kehoe T, et al. The relation between different dimensions of alcohol consumption and burden of disease: an overview. Addiction. 2010 May;105(5):817-43.
3. Monteiro MG. Alcohol y salud pública en las Américas: un caso para la acción. Washington, D.C.: Organizacion Pan Americana de Salud; 2007.
4. Gawryszewski VP, Monteiro MG. Mortality from diseases, conditions and injuries where alcohol is a necessary cause in the Americas, 2007–09. Addiction. 2014 Apr;109(4):570-7.
5. Institute for Health Metrics and Evaluation. Global Burden of Disease. Country Proiles. Brazil [Internet]. Seattle: IHME; 2013 [cited on 2016 June 28]. Available from: http://www.healthdata.org/brazil
6. Brasil. Ministério da Saúde. Secretaria de Vigilância em Saúde. Departamento de Análise de Situação em Saúde. Mortalidade por uso de álcool. In: Brasil. Saúde Brasil 2014: uma análise da situação de saúde e das causas externas. Brasília: Ministério da Saúde; 2015. p. 267-88.
7. Pan American Health Organization. Regional Status Report on Alcohol and Health in the Americas. Washington, D.C.: PAHO; 2015. 70p.
8. Silveira CM, Silveira CC, Silva JG, Silveira LM, Andrade AG, Andrade LHSG. Epidemiologia do beber pesado e beber pesado episódico no Brasil: uma revisão sistemática da literatura. Rev Psiquiatr Clín. 2008;35(Suppl. 1):31-8.
9. Moura EC, Malta DC. Consumo de bebidas alcoólicas na população adulta Brasileira: características sociodemográicas e tendência. Rev Bras Epidemiol. 2011 Sep;14(Suppl. 1):61-70.
10. Berridge V, Herring R, Thom B. Binge drinking: a confused concept and its contemporary history. Soc Hist Med. 2009;22:597-607.
11. Laranjeira R, Madruga CS, Pinsky I, Caetano R, Ribeiro M, Mitsuhiro S. II Levantamento Nacional de Álcool e Drogas - Consumo de Álcool no Brasil: Tendências entre 2006/2012 [Internet]. São Paulo: INPAD; 2013 [cited on 2013 May 31]. Available from: http://inpad.org.br/wp-content/uploads/2013/04/ LENAD_ALCOOL_Resultados-Preliminares.pdf
12. Almeida-Filho N, Lessa I, Magalhães L, Araújo MJ, Aquino E, Kawachi I, et al. Alcohol drinking patterns by gender, ethnicity, and social class in Bahia, Brazil. Rev Saúde Pública. 2004;38(1):45-54.
13. Kerr-Corrêa F, Tucci AM, Hegedus AM, Trinca LA, Oliveira JB, Floripes TMF, et al. Drinking patterns between men and women in two distinct Brazilian communities. Rev Bras Psiquiatr. 2008;30(3):235-42.
14. Silveira CM, Wang YP, Andrade AG, Andrade LH. Heavy episodic drinking in the Sao Paulo epidemiologic Catchment Area Study in Brazil: gender and sociodemographic correlates. J Stud Alcohol Drugs. 2007;68(1):18-27.
15. Silveira CM, Siu ER, Anthony JC, Saito LP, de Andrade AG, Kutschenko A, et al. Drinking patterns and alcohol use disorders in São Paulo, Brazil: the role of neighborhood social deprivation and socioeconomic status. PLoS One. 2014 Oct 1;9(10):e108355.
16. Szwarcwald CL, Malta DC, Pereira CA, Vieira MLFP, Conde WL, Souza Júnior PRB, et al. Pesquisa Nacional de Saúde no Brasil: concepção e metodologia de aplicação. Ciênc Saúde Coletiva. 2014 Feb;19(2):333-42.
17. Instituto Brasileiro de Geograia e Estatística. Pesquisa Nacional de Saúde 2013. Percepção do estado de saúde, estilos de vida e doenças crônicas. Rio de Janeiro: IBGE; 2014.
18. Macinko J, Mullachery P, Silver D, Jimenez G, Morais-Neto OL. Patterns of Alcohol Consumption and Related Behaviors in Brazil: Evidence from the 2013 National Health Survey (PNS 2013). PLoSOne. 2015;10(7):e0134153.
19. Baraona E, Abittan CS, Dohmen K, Moretti M, Pozzato G, Chayes ZW, et al. Gender diferences in pharmacokinetics of alcohol. Alcohol Clin Exp Res. 2001 Apr;25(4):502-7.
20. Wilsnack RW, Wilsnack SC, Kristjanson AF, Vogeltanz-Holm ND, Gmel G. Gender and alcohol consumption: patterns from the multinational GENACIS project. Addiction. 2009 Sep;104(9):1487-500.
21. Holmila M, Raitasalo K. Gender differences in drinking: why do they still exist? Addiction. 2005 Dec;100(12):1763-9.
22. Keyes KM, Grant BF, Hasin DS. Evidence for a closing gender gap in alcohol use, abuse, and dependence in the United States population. Drug Alcohol Depend. 2008 Jan 11;93(1-2):21-9.
23. Malta DC, Machado IE, Porto DL, Silva MMA, Freitas PC, Costa AWN, et al. Consumo de álcool entre adolescentes brasileiros segundo a Pesquisa Nacional de Saúde Escolar (PeNSE 2012). Rev Bras Epidemiol. 2014;17(Suppl. 1):203-14.
24. Anderson P, Bruijn A, Angus K, Gordon R, Hastings G. Impact of alcohol advertising and media exposure on adolescent alcohol use: a systematic review of longitudinal studies. Alcohol Alcohol. 2009;44(3):229-43.
25. Trotta-Borges MT, Simões-Barbosa RH. Cigarro “companheiro”: o tabagismo feminino em uma abordagem crítica de gênero. Cad Saúde Pública. 2008:24(12):2834-42.
26. Machado EL, Lana FCF, Felisbino-Mendes MS, Malta DC. Factors associated with alcohol intake and alcohol abuse among women in Belo Horizonte, Minas Gerais State, Brazil. Cad Saúde Pública. 2013 July;29(7):1449-59.
27. Barros MBA, Botega NJ, Dalgalarrondo P, Marín-León L, Oliveira HB. Prevalence of alcohol abuse and associated factors in a population-based study. Rev Saúde Pública. 2007;41(4):502-9.
28. Laranjeira R, Pinsky I, Sanches M, Zaleski M, Caetano R. Alcohol use patterns among Brazilian adults. Rev Bras Psiquiatr. 2010 Sep;32(3):231-41.
29. Probst C, Roerecke M, Behrendt S, Rehm J. Socioeconomic differences in alcohol-attributable mortality compared with all-cause mortality: a systematic review and meta-analysis. Int J Epidemiol. 2014 Aug;43(4):1314-27.
30. Andrade CY, Dachs, JNW. Acesso à educação por faixas etárias segundo renda e raça/cor. CadPesqui. 2007;37(131):399-422.
31. Leonard KE, Eiden RD. Marital and family processes in the context of alcohol use and alcohol disorders. Annu Rev Clin Psychol. 2007;3:285-310.
32. Rahav G, Wilsnack R, Bloomield K, Gmel G, Kuntsche S. The inluence of societal level factors on men’s and women’s alcohol consumption and alcohol problems. Alcohol Alcohol Suppl. 2006;41:i47-55.
33. Organización Mundial de la Salud. Estrategia mundial para reducir el uso nocivo del alcohol. Ginebra: Organización Mundial de la Salud; 2010. 40p.
34. Brasil. Decreto nº 6.117, de 22 de maio de 2007 [Internet]. Brasília, Diário Oicial da União; 23 maio 2007 [cited on 2016 July 1]. Available from: http://www.planalto.gov. br/ccivil_03/_ato2007-2010/2007/decreto/d6117.htm
35. Brasil. Ministério da Saúde. Plano de ações estratégicas para o enfrentamento das doenças crônicas não transmissíveis (DCNT) no Brasil 2011-2022. Brasília: Ministério da Saúde, 2011.l. Ministério da Saúde. Plano de ações estratégicas para o enfrentamento das doenças crônicas não transmissíveis (DCNT) no Brasil 2011-2022. Brasília: Ministério da Saúde; 2011.
36. Brasil. Lei nº 11.705, de 19 de junho de 2008 [Internet]. Brasília, Diário Oicial da União; 20 junho 2008 [cited on 2016 July 1]. Available from: http://www.planalto. gov.br/ccivil_03/_ato2007-2010/2008/lei/l11705.htm
37. Brasil. Lei nº 12.760, de 20 de dezembro de 2012 [Internet]. Brasília, Diário Oicial da União; 21 dez 2012 [cited on 2016 July 1]. Available from: http:// www.planalto.gov.br/ccivil_03/_Ato2011-2014/2012/ Lei/L12760.htm
38. Toledo ACV. Estratégia mundial para reduzir o uso nocivo de álcool e as políticas públicas nacionais. Leopoldianum. 2012;(104/105/106):119-34.
Received on: 09/01/2016