Denise Petrucci GiganteI Erly Catarina de MouraII,III Luciana Monteiro Vasconcelos SardinhaIII
I Departamento de Nutrição. Programa de Pós-graduação em Epidemiologia. Universidade Federal de Pelotas. Pelotas, RS, Brasil
II Núcleo de Pesquisas Epidemiológicas em Nutrição e Saúde. Universidade de São Paulo. São Paulo, SP, Brasil
III Coordenação Geral de Doenças Crônicas não Transmissíveis. Secretaria de Vigilância em Saúde. Ministério da Saúde. Brasília, DF, Brasil
Correspondence: Denise Petrucci Gigante Universidade Federal de Pelotas Caixa-Postal: 354
96010-900 Pelotas, RS Brasil E-mail: [email protected]
Received: 11/28/2008 Revised: 7/28/2009 Approved: 8/28/2009
Prevalence of overweight and
obesity and associated factors,
Brazil, 2006
ABSTRACT
OBJECTIVE: To estimate the prevalence of overweight and obesity and factors associated.
METHODS: The study analyzed data referring to individuals aged 18 years or older interviewed through the system Vigilância de Fatores de Risco e Proteção
para Doenças Crônicas por Inquérito Telefônico (VIGITEL – Telephone-based
surveillance of risk and protective factors for chronic diseases), carried out in the Brazilian capitals and Federal District in 2006. For 49,395 individuals, the body mass index (BMI) was used to identify overweight (BMI ≥ 25 kg/ m2) and obesity (BMI ≥30 kg/m2). Prevalence and prevalence ratios were presented according to sociodemographic variables, level of schooling, health condition/comorbidities, and self-evaluation of health, stratifi ed by sex. Poisson regression was employed for crude and age-adjusted analyses.
RESULTS: The prevalence of overweight was of 47% for men and 39% for women, obesity was around 11% for both sexes. Direct association was observed between overweight and level of schooling among men and inverse association among women. Obesity was more frequent among men living with a partner and was associated neither with level of schooling nor skin color. The prevalence of overweight and obesity was higher among black women and women who lived with a partner. The presence of diabetes, systemic arterial hypertension and dyslipidemias, as well as the subject perceiving his/her health as regular or poor, were also reported by the interviewees with overweight or obesity.
CONCLUSIONS: While approximately one out of every two interviewees was classifi ed as being overweight, obesity was reported by one out of every ten interviewed subjects. Socioeconomic and demographic variables, as well as reported morbidities, were associated with overweight and obesity. These results were similar to the ones found in other Brazilian studies.
Chronic problems associated with obesity can be grouped into: cardiovascular diseases, insulin resis-tance conditions, some types of cancer and gallblad-der disease.14 Obese individuals present at least twice the chance of developing diabetes, insulin resistance, dyslipidemia, apnea, gallbladder disease, hyperten-sion, coronary artery disease, osteoarthritis, and gout.14 These associations and the increasing growth in the prevalence of obesity, as well as of other risk factors for chronic noncommunicable diseases (CNCD), such as physical inactivity, smoking, high blood pressure and cholesterol, are responsible for a large part of the health costs.15
The prevalence of obesity has increased in high and low income countries, among adults, adolescents and children. In high income countries, obesity affects mainly the less advantaged population;13 in devel-oping countries, obesity prevalence is greater in the higher income population.6 However, in the Brazilian population, greater occurrence of obesity among the poor has been recently observed.7
In Brazil, national surveys show that the prevalence of overweight and obesity has increased in the adult pop-ulation in a different way according to sex. In the pe-riod 1974-75, obesity among men tripled and, among women, who at the beginning of the period presented higher prevalence, there was a 50% increase in the peri-od 2002-03.a This increase in the prevalence of obesity in women concentrated in the period from 1974-75 to 1989, when the two fi rst national surveys were carried out (Estudo Nacional da Despesa Familiar –National Study on Family Expenses - and Pesquisa Nacional
de Saúde e Nutrição – National Survey on Health and
Nutrition). Regarding overweight, the women also be-gan the period with higher prevalence, but in 2002-03 the frequency of overweight was similar in men and women. Analyzing the evolution of this prevalence in relation to socioeconomic level, there was an increase in the occurrence of obesity for all income categories among men but only among the poorest women. On the other hand, among higher income individuals, there was a decrease in the prevalence of obesity and overweight. The association between these outcomes and lower level of schooling has also been observed in other populations of many countries.3
The aim of the present study was to estimate the prev-alence of overweight and obesity, assessing the asso-ciated factors and the BMI effect on the occurrence of self-referred morbity.
INTRODUCTION
a Instituto Brasileiro de Geografi a e Estatística. Pesquisa de orçamentos familiares 2002-2003. Análise da disponibilidade domiciliar de alimentos e do estado nutricional no Brasil. Rio de Janeiro; 2004.
b Ministério da Saúde. VIGITEL Brasil 2006. Vigilância de fatores de risco e proteção para doenças crônicas por inquérito telefônico: estimativas sobre freqüência e distribuição sócio-demográfi ca de fatores de risco e proteção para doenças crônicas nas capitais dos 26 estados brasileiros e no Distrito Federal em 2006. Brasília; 2007.
METHODS
Cross-sectional study that used data from the system
of Vigilância de Fatores de Risco e Proteção para
Doenças Crônicas por Inquérito Telefônico (VIGITEL
- Telephone-based surveillance of risk and protective factors for chronic diseases), based on a probabilistic sample of the population of adults (≥18 years) living in households served by fi xed telephone lines in the Brazilian capitals and Federal District. Sample size was calculated to study the prevalence of the main risk factors for chronic noncommunicable diseases. To en-sure a 95% confi dence level and a maximum error of two percentage points for the estimates, it was neces-sary to study at least 2,000 individuals in each city.
From the electronic roll of residential lines provided by the telephone companies, 5,000 telephone lines were systematically drawn, stratifi ed according to region or prefi x. These lines were re-drawn and divided into 25 replicas, reproducing the same proportion of lines per region or telephone prefi x, and were integrally used in a suffi cient number until the necessary interviews were conducted in each city. To each eligible telephone line, all the dwellers of the household aged ≥18 years were listed and one of them was drawn to answer the inter-view. Further information on the sampling procedure and the methods employed in the above-mentioned survey are described in other publications.8,b
The telephone interviews were conducted between August and December 2006. The questionnaire was administered through the use of computers for the reading of questions and register of answers. This questionnaire approached information on demograph-ic and socioeconomdemograph-ic characteristdemograph-ics; characteristdemograph-ics of the dietary and physical activity pattern; reported weight and height; consumption frequency of ciga-rettes and alcohol; self-rate of the health status and reference to a previous medical diagnosis of some dis-eases, among other questions.
In the 27 studied cities 54,369 individuals were inter-viewed by VIGITEL. The exclusion of 487 pregnant women in the occasion of the interview and of 4,487 people who did not inform weight and/or height re-sulted in 49,395 valid interviews for the present study, 20,622 (41.7%) men and 28,773 (58.3%) women. Of the overall number, 61% were younger than 45 years.
outcomes were: overweight (BMI ≥25 kg/m2); obesity (BMI≥30 kg/m2); and BMI in four categories (<25; 25 to 29.9; 30 to 34.9; and ≥ 35 kg/m²).
The explanatory variables are: age (18 to 24, 25 to 34, 35 to 44, 45 to 54, 55 to 64, ≥65 years); level of schooling (up to four, fi ve to eight, nine to 11 or ≥12 years); skin color (white or non-white); stable union (yes/no); diabetes (yes/no); arterial hypertension (yes/ no); infarction, stroke or cerebrovascular accident (yes/no); dyslipidemia (yes/no); osteoporosis (yes/ no); self-rate of health as poor or regular (yes/no).
Crude and adjusted analyses were stratifi ed by sex, except for the association of the BMI categories with reported morbidities. The prevalence of overweight and obesity was calculated, as well as the respective confi dence intervals according to age. To analyze the associations of overweight and obesity with level of schooling, skin color and marital status, Poisson re-gression was used, crude and adjusted for sex, age and level of schooling between the BMI categories. The reported morbidities were also analyzed through Poisson regression, considering the absence of disease as reference category. All the analyzes considered the weighting factor attributed to the interviewees to cor-rect the following conditions: higher chance of draw-ing an individual livdraw-ing in a household with more than one telephone line; lower chance of drawing an indi-vidual living in a household with higher number of dwellers; and to increase the sample’s representative-ness in relation to the sociodemographic composition of each municipality.10
As the interviews were conducted by telephone, the signed consent document was replaced by the verbal consent provided during the telephone contacts with the interviewees. VIGITEL was approved by the Na-tional Committee for Ethics in Research with Human Beings of the Ministry of Health.
RESULTS
Overweight was more prevalent among men and the prevalence of obesity was similar among men and women. However, overweight and obesity were more prevalent among older women (55 years or more). The prevalence of overweight and obesity increased with age up to 54 years among men and 64 years among women (Table 1).
Analyzing the association of some sociodemographic variables with overweight, it was observed that lower level of schooling protected men against it. Inversely, higher prevalence of overweight was observed among women with lower level of schooling (Table 2). There was no crude association between overweight and skin color for both sexes. However, after adjusting for age, prevalence of overweight was 12% higher among non-white women when compared to white women (p=0.001). Men and women who lived in a stable union had higher chance of presenting overweight (Table 2).
Table 3 shows the associations between obesity and so-ciodemographic variables. Among men, only the mari-tal status showed association with obesity. Living in a stable union represented a risk of obesity that was ap-proximately two times higher. Although this effect was lower when adjusted for age, the association remained signifi cant. Among women, the effects of lower level of schooling and of non-white skin color were higher for obesity than for overweight, while the risk of living in a stable union was similar for both outcomes.
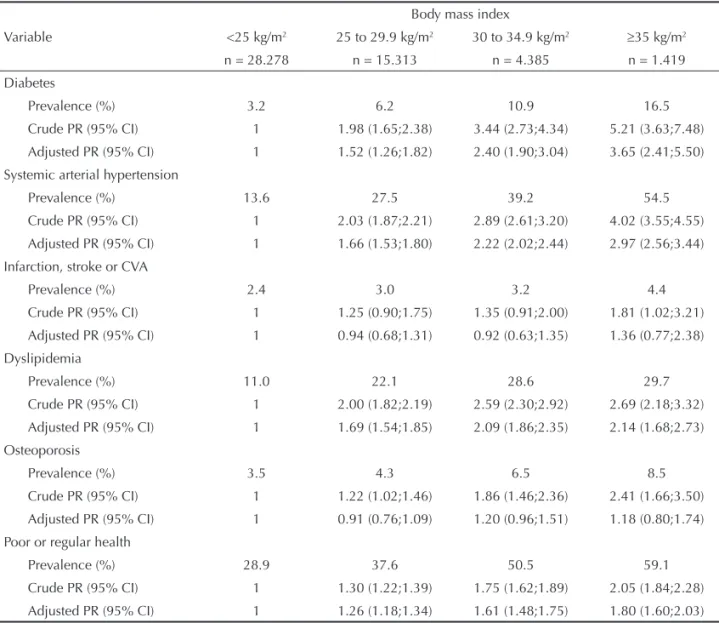
The relationship between BMI categories and report-ed morbidities is presentreport-ed in Table 4. The reportreport-ed prevalence of diabetes, systemic arterial hypertension (SAH), infarction, stroke or cerebrovascular accident (CVA), dyslipidemia and osteoporosis was higher among individuals with higher BMI. Nevertheless, after adjusting for sex, age and level of schooling, no
Table 1. Prevalencea of overweight (BMI≥25 kg/m2) and obesity (BMI≥30 kg/m2) according to age and sex. Brazil, 2006. (N=49,395)
Age (years)
Men Women
n Overweight Obesity n Overweight Obesity % (95% CI) % (95% CI) % (95% CI) % (95% CI) 18 to 24 3720 24.9 (23.5;26.3) 4.1 (3.5;4.7) 4326 17.1 (16.0;18.2) 4.5 (3.9;5.1) 25 to 34 4485 48.1 (46.6;49.6) 11.8 (10.9;12.7) 6158 29.4 (28.3;30.5) 8.9 (8.2;9.6)
35 to 44 4708 56.7 (55.3;58.1) 13.6 (12.6;14.6) 6627 43.2 (42.0;44.4) 11.0 (10.2;11.8) 45 to 54 3665 58.8 (57.2;60.4) 16.7 (15.5;17.9) 5159 53.5 (52.1;54.9) 15.1 (14.1;16.1) 55 to 64 2103 55.9 (53.8;58.0) 13.1 (11.7;14.5) 3360 59.1 (57.4;60.8) 20.4 (19.0;21.8) 65 and older 1941 50.1 (47.9;52.3) 11.0 (9.6;12.4) 3143 55.4 (53.7;57.1) 19.7 (18.3;21.1)
Total 20622 47.3 (46.6;48.0) 11.3 10.9;11.7 28773 38.8 (38.2;39.4) 11.5 (11.1;11.9)
p <0.001 <0.001 <0.001 <0.001
a Weighted percentage to adjust the sociodemographic distribution of the VIGITEL sample to the distribution of the adult
differences were observed regarding the frequency of infarction, stroke or CVA and osteoporosis be-tween the BMI categories. After the adjustment, for interviewees with BMI ≥35 kg/m2, the frequency of reported diabetes was more than three times higher than in those with BMI lower than 25 kg/m2. The prevalence of SAH was approximately three times higher in the group of BMI ≥35 kg/m2 compared to the group of BMI lower than 25 kg/m2, and the preva-lence of dyslipidemia was two times higher. Also in individuals with high BMI there was greater
refer-ence to regular or poor health: this chance was 26% higher for individuals with BMI between 25 and 29.9 kg/m2, versus 80% among the interviewees with BMI ≥35 kg/m2, compared to those with BMI < 25 kg/m2 (Table 4).
DISCUSSION
The present study shows the frequency of overweight and obesity according to demographic and socioeco-nomic variables and some chronic morbidities, based on information supplied by VIGITEL. These results Table 2. Prevalencea and age-adjusted prevalence ratio (PR) of overweight (BMI≥25 kg/m2) according to level of schooling, skin color and marital status, by sex. Brazil, 2006. (N=49,395)
Variable
Men Women
% Crude PR (95% CI)
Adjusted PR
(95% CI) %
Crude PR (95% CI)
Adjusted PR (95% CI)
Level of
schooling (years) p<0,001 p<0,001 p<0,001 p<0,001 p<0,001 p<0,001 Up to 4 46.6 0.87 (0.79;0.97) 0.80 (0.72;0.89) 52.7 1.85 (1.68;2.04) 1.46 (1.31;1.62) 5 to 8 46.2 0.86 (0.79;0.95) 0.90 (0.82;0.98) 44.1 1.55 (1.40;1.71) 1.51 (1.37;1.66)
9 to 11 45.3 0.85 (0.79;0.91) 0.92 (0.86;0.99) 31.0 1.09 (0.99;1.19) 1.17 (1.07;1.28)
12 and more 53.4 1 1 28.5 1 1
Skin color p<0.001 p=0.08 p=0.35 p<0.001 p=0.11 p=0.001
White 49.2 1 1 37.6 1 1
Non-white 46.2 0.94 (0.87;1.01) 0.97 (0.91;1.04) 39.7 1.06 (0.98;1.13) 1.12 (1.06;1.19) Stable union p<0.001 p<0.001 p<0.001 p<0.001 p<0.001 p<0.001
No 36.3 1 1 31.9 1 1
Yes 56.9 1.54 (1.42;1.67) 1.38 (1.27;1.50) 45.6 1.43 (1.34;1.53) 1.36 (1.27;1.45)
a Weighted percentage to adjust the sociodemographic distribution of the VIGITEL sample to the distribution of the adult
population of each city in the 2000 Demographic Census and considering the population weight of each city.
Table 3. Prevalencea and age-adjusted prevalence ratio (PR) of obesity (BMI≥30 kg/m2) according to level of schooling, skin color and marital status, by sex. Brazil, 2006. (N=49,395)
Variable
Men Women
% Crude PR (95% CI)
Adjusted PR
(95% CI) %
Crude PR (95% CI)
Adjusted PR (95% CI) Level of
schooling (years) p<0,001 p=0,08 p=0,69 p<0,001 p<0,001 p<0,001
Up to 4 12,5 1,07 (0,82;1,39) 0,98 (0,74;1,27) 19,1 2,54 (2,05;3,14) 1,96 (1,56;2,45) 5 to 8 11,6 0,99 (0,79;1,27) 1,03 (0,83;1,29) 12,4 1,65 (1,32;2,06) 1,59 (1,27;1,99) 9 to 11 9,8 0,83 (0,70;1,00) 0,92 (0,77;1,11) 8,1 1,07 (0,88;1,31) 1,16 (0,95;1,42)
12 and more 11,7 1 1 7,5 1 1
Skin color p<0,001 p=0,75 p=0,43 p<0,001 p=0,09 p=0,006
White 11,1 1 1 10,7 1 1
Non-white 11,4 1,03 (0,87;1,22) 1,07 (0,90;1,27) 12,1 1,13 (0,98;1,31) 1,22 (1,06;1,40) Stable union p<0,001 p<0,001 p<0,001 p<0,001 p<0,001 p<0,001
No 7,4 1 1 9,6 1 1
Sim 14,3 1,94 (1,58;2,37) 1,73 (1,38;2,17) 13,4 1,40 (1,21;1,60) 1,32 (1,15;1,53)
a Weighted percentage to adjust the sociodemographic distribution of the VIGITEL sample to the distribution of the adult
will be used as baseline to analyze the evolution of this morbidity in the adult population living in Brazil-ian capitals.
The prevalence of overweight and obesity that was found was similar to that obtained by Pesquisa de
Orçamentos Familiares (POF – Family Budget
Sur-vey) in 2003/2003.a Among the studied men, preva-lence was higher in the different age groups. On the other hand, the frequencies of overweight and obesity among the studied women were lower than those ob-served in POF 2002/2003, with differences between age groups. In women up to 34 years of age, over-weight prevalence was lower than the one obtained in 2002/2003. Among women aged 35 or older, the reported frequency of overweight was higher than the
frequency measured by POF. Concerning obesity, the results of the present study were similar, with higher prevalence reported by women aged 65 or older. These differences may derive from the form in which the data were obtained: directly measured in POF, while the BMI calculated with reported weight and height is underestimated only by women.10
In relation to the socioeconomic and demographic variables, the inverse relationship between level of schooling and the nutritional outcomes had been ob-served in the female population living in the Northeast and Southeast regions of Brazil.4 Among men, an anal-ysis of the evolution of obesity in these regions of the country showed a decrease in the positive relationship between level of schooling and risk of obesity.5
Al-a Instituto Brasileiro de Geografi a e Estatística. Pesquisa de orçamentos familiares 2002-2003. Análise da disponibilidade domiciliar de alimentos e do estado nutricional no Brasil. Rio de Janeiro; 2004.
Table 4. Prevalencea and prevalence ratio, crude and adjusted for sex, age and level of schooling, of reported morbidity
according to body mass index. Brazil, 2006. (N=49,395)
Variable
Body mass index
<25 kg/m2 25 to 29.9 kg/m2 30 to 34.9 kg/m2 ≥35 kg/m2 n = 28.278 n = 15.313 n = 4.385 n = 1.419 Diabetes
Prevalence (%) 3.2 6.2 10.9 16.5
Crude PR (95% CI) 1 1.98 (1.65;2.38) 3.44 (2.73;4.34) 5.21 (3.63;7.48) Adjusted PR (95% CI) 1 1.52 (1.26;1.82) 2.40 (1.90;3.04) 3.65 (2.41;5.50) Systemic arterial hypertension
Prevalence (%) 13.6 27.5 39.2 54.5
Crude PR (95% CI) 1 2.03 (1.87;2.21) 2.89 (2.61;3.20) 4.02 (3.55;4.55) Adjusted PR (95% CI) 1 1.66 (1.53;1.80) 2.22 (2.02;2.44) 2.97 (2.56;3.44) Infarction, stroke or CVA
Prevalence (%) 2.4 3.0 3.2 4.4
Crude PR (95% CI) 1 1.25 (0.90;1.75) 1.35 (0.91;2.00) 1.81 (1.02;3.21) Adjusted PR (95% CI) 1 0.94 (0.68;1.31) 0.92 (0.63;1.35) 1.36 (0.77;2.38) Dyslipidemia
Prevalence (%) 11.0 22.1 28.6 29.7
Crude PR (95% CI) 1 2.00 (1.82;2.19) 2.59 (2.30;2.92) 2.69 (2.18;3.32) Adjusted PR (95% CI) 1 1.69 (1.54;1.85) 2.09 (1.86;2.35) 2.14 (1.68;2.73) Osteoporosis
Prevalence (%) 3.5 4.3 6.5 8.5
Crude PR (95% CI) 1 1.22 (1.02;1.46) 1.86 (1.46;2.36) 2.41 (1.66;3.50)
Adjusted PR (95% CI) 1 0.91 (0.76;1.09) 1.20 (0.96;1.51) 1.18 (0.80;1.74) Poor or regular health
Prevalence (%) 28.9 37.6 50.5 59.1
Crude PR (95% CI) 1 1.30 (1.22;1.39) 1.75 (1.62;1.89) 2.05 (1.84;2.28)
Adjusted PR (95% CI) 1 1.26 (1.18;1.34) 1.61 (1.48;1.75) 1.80 (1.60;2.03)
a Weighted percentage to adjust the sociodemographic distribution of the VIGITEL sample to the distribution of the adult
though no association was observed between level of schooling and obesity in the men who participated in the present study, lower frequency of overweight was observed in the groups with lower level of schooling.
Differences in the prevalence of obesity and over-weight in relation to the skin color of the studied in-dividuals were described in a telephone-based survey carried out in the United States.2 In Brazil, however, a study with employees of a university showed higher weight gain from the age of twenty onwards in black women aged between 30 and 70, and no association between skin color and weight gain among men.1 The results of the present study corroborate these fi ndings: the prevalence of overweight and obesity, adjusted for the interviewees’ age, was higher among non-white women, and no difference was observed among men.
The relationship between stable union and the occur-rence of obesity or overweight is consistent with re-sults of representative studies of the population of the United States,9,12,13 and the higher risk for Brazilian in-dividuals who live in a stable union is being presented for the fi rst time.
The infl uence of obesity on chronic diseases is well established.14 The fi ndings of the present study
con-fi rm results about the magnitude of the BMI effect on diabetes, systemic arterial hypertension and dyslipi-demia, with relative risks for two or more, even based on self-reported morbidity in a survey that was carried out by telephone. For infarction, stroke or CVA, no as-sociation was observed with BMI. Thus, low frequen-cies of these events might be a consequence of infor-mation bias, or of survival bias, in which people with these diseases who died or presented serious sequels were not included in the study. Due to the low
preva-lence of infarction, stroke or CVA, or of osteoporosis, slight differences in magnitude might not have been detected, as opposed to the verifi cation of differences in the risk of occurrence of diabetes among obese or overweight individuals.
Like in the study in which the population of the Unit-ed States was interviewUnit-ed by telephone,2 the results of the present study showed association between BMI and greater chance of rating health as poor or regu-lar, indicating that the obese individual had a risk ap-proximately two times higher of rating his/her health as poor or regular.
The similarity between the prevalence of overweight and obesity obtained in the present study and in a rep-resentative sample of the Brazilian adult population, weighed and measured in another study,a suggests the validity of this kind of survey in the assessment of the frequency of risk factors for chronic diseases. Al-though the differences in relation to the last survey may have resulted from information bias, they may be related to real increases in the prevalence among men and to a certain stability among women. Local studies with specifi c populations in different regions of the country can contribute to clarify this question. On the other hand, it is possible to assess the trend and evolu-tion of this prevalence with the periodic conducevolu-tion of telephone-based surveys.
To conclude, the present study identifi ed factors as-sociated with obesity and overweight, subsidizing the establishment of measures of prevention and control by means of public policies relying on periodicity and short interval to obtain this information by means of telephone-based surveys.
1. Chor D, Faerstein E, Kaplan GA, Lynch JW, Lopes CS. Association of weight change with ethnicity and life course socioeconomic position among Brazilian civil servants. Int J Epidemiol. 2004;33(1):100-6. DOI:10.1093/ije/dyg277
2. Mokdad AH, Ford ES, Bowman BA, Dietz WH, Vinicor F, Bales VS, et al. Prevalence of obesity, diabetes, and obesity-related health risk factors, 2001. JAMA. 2003;289(1):76-9. DOI:10.1001/jama.289.1.76
3. Molarius A, Seidell JC, Sans S, Tuomilehto J, Kuulasmaa K. Educational level, relative body weight, and changes in their association over 10 years: an international perspective from the WHO MONICA Project. Am J Public Health. 2000;90(8):1260-8. DOI:10.2105/ AJPH.90.8.1260
4. Monteiro CA, Conde WL, Popkin BM. Independent effects of income and education on the risk of obesity in the Brazilian adult population. J Nutr.
2001;131(3):881-6.
5. Monteiro CA, Conde WL, de Castro IR. A tendência cambiante da relação entre escolaridade e risco de obesidade no Brasil (1975-1997). Cad Saude Publica. 2003;19(Supl 1):67-75. DOI:10.1590/S0102-311X2003000700008
6. Monteiro CA, Moura EC, Conde WL, Popkin BM. Socioeconomic status and obesity in adult populations of developing countries: a review. Bull World Health Organ. 2004;82(12):940-6. DOI:10.1590/S0042-96862004001200011
7. Monteiro CA, Conde WL, Popkin BM. Income-specifi c trends in obesity in Brazil: 1975-2003. Am J Public Health. 2007;97(10):1808-12. DOI:10.2105/ AJPH.2006.099630
8. Moura EC, Morais Neto OL, Malta DC, Moura L, Silva NN, Bernal R, et al. Vigilância de Fatores de Risco para Doenças Crônicas por Inquérito Telefônico nas capitais dos 26 estados brasileiros e no Distrito Federal (2006). Rev Bras Epidemiol. 2008;11(Supl 1):20-37. DOI:10.1590/S1415-790X2008000500003
9. Schoenborn CA. Marital status and health: United States, 1999-2002. Adv Data. 2004;(351):1-32. 10. Silveira EA, Araujo CL, Gigante DP, Barros AJ, Lima MS.
Validação do peso e altura referidos para o diagnóstico do estado nutricional em uma população de adultos no Sul do Brasil. Cad Saude Publica. 2005;21(1):235-45. DOI:10.1590/S0102-311X2005000100026
11. Sobal J, Stunkard AJ. Socioeconomic status and obesity: a review of the literature. Psychol Bull. 1989;105(2):260-75. DOI:10.1037/0033-2909.105.2.260
12. Sobal J, Rauschenbach BS, Frongillo EA Jr. Marital status, fatness and obesity. Soc Sci Med. 1992;35(7):915-23. DOI:10.1016/0277-9536(92)90106-Z
13. Sobal J, Rauschenbach B, Frongillo EA. Marital status changes and body weight changes: a US longitudinal analysis. Soc Sci Med. 2003;56(7):1543-55. DOI:10.1016/S0277-9536(02)00155-7
14. World Health Organization. Obesity: preventing and managing the Global Epidemic. Report on a WHO Expert Consultation on Obesity, 3-5 June 1997. Geneva; 1997.
15. World Health Organization. Diet, Nutrition and the Prevention of Chronic Diseases. Report of a Joint WHO/FAO Expert Consultation, Geneva, 28 January - 1 February 2002. Geneva; 2002. (WHO Technical Report Series, 916).
REFERENCES
This article underwent the peer review process adopted for any other manuscript submitted to this journal, with anonymity guaranteed for both authors and reviewers. Editors and reviewers declare that there are no confl icts of interest that could affect their judgment with respect to this article.