Original Article
Blood antioxidant nutrients in riparian villagers
of the Brazilian Amazon: its associations
with wet/dry seasons and modulation by
sociodemographic determinants
Antioxidantes sanguíneos provenientes da dieta em
ribeirinhos da Amazônia Brasileira: suas relações com
sazonalidade e determinantes sociodemográficos
Juliana Valentini
1, Carlos José Sousa Passos
2, Solange Cristina Garcia
3,
Robert Davidson
4, Marc Lucotte
5, Frédéric Mertens
6, Christine Romana
7,
Lígia Meres Valadão
1, Mariele Feiffer Charão
3, Marília Baierle
3,
Fernando Barbosa Júnior
81 PhD. Instituto de Saúde Coletiva, Universidade Federal do Oeste do Pará (UFOPA) - Santarém (PA), Brazil. 2PhD. Faculdade de Planaltina, Universidade de Brasília (UnB) - Planaltina (DF), Brazil.
3PhD. Laboratório de Toxicologia (LATOX), Faculdade de Farmácia, Universidade Federal do Rio Grande do Sul (UFRGS) - Porto Alegre (RS), Brazil. 4PhD. Collection Vivante et Recherche, Biodôme de Montréal - Montréal (Québec), Canadá.
5PhD. Université du Québec à Montréal - Montréal (Québec), Canadá.
6PhD. Centro de Desenvolvimento Sustentável (CDS), Universidade de Brasília (UnB) - Brasília (DF), Brazil.
7PhD. Institut de Recherche pour le Développement, Université Paris Descartes-PRES Paris Cité Sorbonne - Paris, France.
8PhD. Laboratório de Toxicologia e Essencialidade de Metais, Faculdade de Ciências Farmacêuticas de Ribeirão Preto (FCFRP), Universidade de São Paulo (USP)
- Ribeirão Preto (SP), Brazil.
Study carried out at Tapajos River region, State of Pará (Brazilian Amazon), 2010-2011, Santarem (PA), Brazil.
Correspondence: Juliana Valentini – Avenida Mendonça Furtado, 2946 – Fátima – CEP: 68040-470 – Santarém (PA), Brazil – Email: [email protected]
Financial support: Canadian Institutes of Health Research, Canadian International Development Agency, Global Health Research Initiative (GHRI), Public Health Agency of Canada. Its agencies and Brazil and its agencies signed a according being the numbers: IDRC (103460-049) and Foundation for the State of São Paulo Research (11/07797-6).
Conflict of interests: nothing to declare. Abstract
This study associates blood antioxidants like copper (Cu), manganese (Mn), selenium (Se), zinc (Zn), β-carotene, lycopene and vitamins (A and E) to sociodemographic features and seasonality in communities from the Tapajós River region, Brazilian Amazon. We observed increased Mn, Se and Zn levels compared to the average Brazilian population, whereas this is only the case for β-carotene in the rainy season. Lycopene levels fall within the reference range, although lower than those found in other Brazilian regions. Cu, Se, Zn, β-carotene, lycopene and vitamin E levels vary among seasons. β-carotene, Mn and Se vary among communities. Se and Zn vary with smoking habits and sex, respectively. In addition, β-carotene and vitamins (A and E) are altered by alcohol consumption. Villagers who both farmed and fished present higher Cu and lower β-carotene levels than participants with a single occupation. Vitamin E levels depend upon the individual state of origin. These data provide important baseline information for antioxidant status in this Amazonian riparian population.
▄
INTRODUCTIONAmazonian riparian populations diet depend upon ish, fruits and vegetable1-3. Due to mercury (Hg) environmental contamination resulting
from gold mining and/or slash-and-burn agriculture, the dietary human exposure to Hg through consumption of contaminated ish has been the subject of much concern in this region over the last decades4-7, and
recent studies have indicated that food other than ish, such as tropical fruits may inluence the relationship between ish consumption and Hg exposure, potentially providing protective efects against health toxic efects in riparian communities2,6,8-10. For instance, the serum
carotenoid proile may be considered a good biomarker of fruit and vegetable intake11. Additionally, the consumption of other types of food
such as vegetables, cereals, meat, and ish itself may directly afect the levels of important micronutrients such as vitamins and essential metals in the bloodstream3,12.
Population sociodemographic and lifestyle features such as sex, age, body mass index (BMI), smoking habits, alcohol consumption, the presence of pathologies, among other variables, may also afect blood levels of essential metals and vitamins13-15. Yet, few studies have
evaluated blood levels of important micronutrients of Amazonian riparian populations3,14,16. In addition, while the wet/dry seasons cycle in this
region profoundly inluences the types of foods consumed throughout the year1, its inluence on blood micronutrient levels has not yet been
taken into consideration. To our knowledge, blood levels of carotenoids and vitamins in this population have never been reported, which makes it important to establish reference ranges for this speciic population, since these ranges may difer from those established for other geographic regions, due to dissimilar environmental conditions and lifestyles, which ultimately can lead to diferent beneits and/or risks to human health.
his study was conducted with small-scale subsistence agriculture and ish-eating villagers of the Tapajós River region, during two diferent seasons (rainy and dry seasons). he purpose was twofold: a) evaluate the seasonal blood variation of essential metals (Cu, Mn, Se and Zn), carotenoids (β-carotene and lycopene) and vitamins (A and E); b) analyse the nutritional status for these micronutrients with respect to the inluence of seasonality, sociodemographic and lifestyle factors.
▄
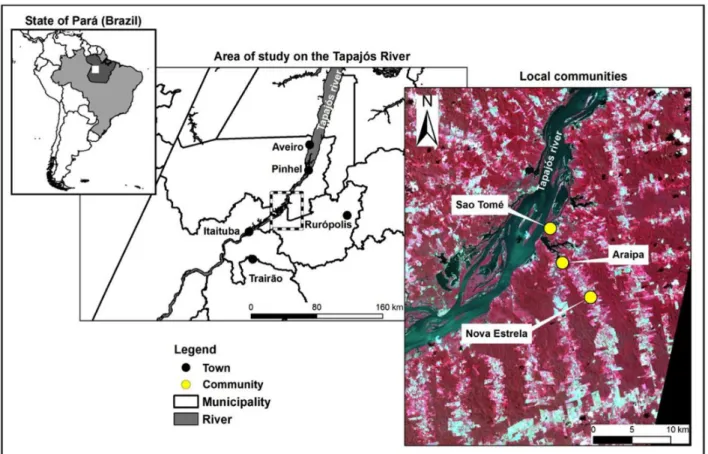
METHODSStudy population
he individuals enrolled in this study were from diferent communities located in the middle Tapajós River region, State of Pará (Brazilian Amazon), namely Lago Araipa (LA), Nova Estrela (NE) and São Tomé (ST) (Figure 1). hese communities do relect the region’s ecosystem complexities, as well as its human diversity constituted of local old settled riparian communities (cabloclos) mixed with immigrants from the north eastern Brazil. ST is a typical riparian community with the majority (93.6%) of its population being locally born. A mix between old settled and immigrant persons occurs in the LA community. he community of NE is a typical settlement of immigrants from north eastern Brazil, with 67.7% of its population formed by immigrants, while only 32.3% of its inhabitants were born in the PA State.
he random sampling strategy is hardly applied to this area of the Amazon. Boats are the only means of transport from one village to another and villagers are spread out over large areas, which require small crats and/or several hours of walking inland to reach2. hus, a convenience sample was used and
house-to-house sociodemographic survey was undertaken, during which the study was explained to each household, and villagers were invited to participate on a voluntary basis.
he study was conducted over two diferent periods, namely: i) Rainy season (RS); and ii) Dry season (DS). he inclusion criterion for the present study was being older than 18 years of age, in accordance with the study protocol that was approved by the Institutional Review Board of the University of São Paulo (File # 043/2009) and Faculty of Health Sciences at the University of Brasília (File # 095/08). Blood was collected following the participants informed written consent, participants were also asked to respond an interview-administered and structured questionnaire containing sociodemographic questions, as well as inquiries about lifestyle. Additionally, the subjects were weighed and measured and their BMI (weight (Kg)/(height (m))2) was calculated.
Resumo
O presente estudo reporta as concentrações plasmáticas dos antioxidantes cobre (Cu), manganês (Mn), selênio (Se), zinco (Zn), β-caroteno, licopeno e vitaminas (A e E) em moradores da região do Rio Tapajós, Pará, Amazônia, e as relaciona com características sociodemográficas e sazonalidade (seca e cheia). Os teores de Mn, Se e Zn foram acima dos valores de referência (VR) e daqueles achados em outras regiões do Brasil, enquanto para o β-caroteno tal achado ocorreu apenas na estação da cheia. Os valores de licopeno foram dentro dos VR, porém abaixo dos achados em outras regiões do Brasil. Os níveis de Cu, Se, Zn, β-caroteno, licopeno e vitamina E variaram entre as estações. Variação intercomunitária foi constatada para β-caroteno, Mn e Se. Os teores de Se e Zn foram alterados, respectivamente, por tabagismo e sexo. Os níveis de β-caroteno e vitaminas (A e E) alteraram-se com o consumo de bebida alcoólica. A vitamina E foi dependente do estado de origem. Participantes que desempenhavam ambas as profissões de agricultor e pescador apresentavam teores de Cu superiores e de β-caroteno inferiores comparativamente àqueles que desempenhavam uma única profissão. Esses dados fornecem informações sobre os teores de antioxidantes para essa população amazônica.
Blood collection
A nurse collected a blood sample from each participant. EDTA anticoagulant and trace metal-free were used, both types of tubes being from BD Vacutainer®. Ater collection, blood samples used for carotenoid and vitamin measurements were centrifuged. he entire blood samples were immediately frozen at –20 °C. Frozen blood/plasma samples were then immediately sent to the University of São Paulo and stored at –80 °C until analysis.
Analyses of plasma carotenoids and vitamins
he quantiication of plasma β-carotene, lycopene and vitamins (A and E) was in accordance with detailed procedures previously published17.
Whole blood metal determination
he quantiication of trace elements in whole blood was performed according to the appropriate method16.
Statistical analyses
Descriptive statistical analysis was used to characterize the study population. A normality test was conducted by using the Shapiro-Wilk test, and since blood micronutrients
were not normally distributed, comparisons between groups (seasonality - dry and rainy season -, sex, smoking status, immigrant status, occupations alone or diferently grouped, and alcohol consumption) were achieved by Mann-Whitney U- test. Additionally; Kruskal-Wallis test was used to compare inter-communities variations and age categories. he results were considered statistically signiicant at p<0.05. Spearman correlation analyses were performed to evaluate associations between continuous variables. Analyses were performed using SPSS version 18.0.
▄
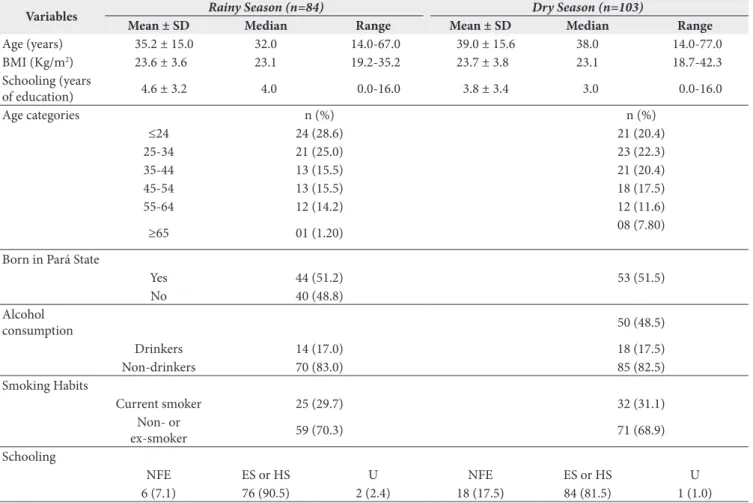
RESULTShe study population sociodemographic characteristics are shown in Table 1. The number of participants was 84 and 103 individuals in RS and DS, respectively, although only 30 persons participated in the study on both seasons. Gender distribution was similar during DS, while for RS women’s participation was 20.4% (n=51) higher than men’s (n=33). he age distributions are also presented in Table 1.
he participants BMI was similar in both seasons (Table 1), and this parameter was not diferent between women and men, regardless of the season. Based on the criteria proposed by the World Health Organization (WHO)18, 24.4% and 20.4% of the
population was overweight, respectively during RS and DS, with BMI values varying between 25 and 30Kg/m2, while 6.1% and
5.8% were considered obese (BM I>30Kg/m2). Despite this,
the majority of the population (69.5% and 69.8% in RS and DS, respectively) remained within the normal range for BMI values (from 18.5 to 24.9Kg/m2). None of the participants had
BMI values <18.5Kg/m2.
Less than a third of participants were smokers and the numbers were similar for both seasons. Few individuals declared alcohol consumption in either season (Table 1). In both seasons, around 50% of participants were originally from the state of PA, while the others came from diferent Brazilian regions, mainly from the Northeast. he NE community accounted for the highest number of immigrant participants: 55% and 70% of total subjects in the RS and DS, respectively (data not shown).
he majority of individuals had completed or was enrolled in elementary school or high school, and a large number of individuals had no formal education. Only two individuals in the RS and one in the DS had attended university (Table 1). Participants of this study reported a variety of occupations in
their daily lives for both seasons, many of them having more than one occupation simultaneously, including ishing, farming, domestic work, teaching, boatmen, health work, commerce and regular school attendance (data not shown).
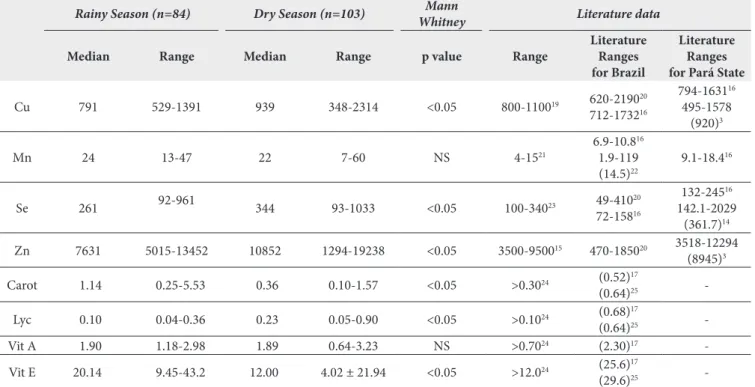
Literature data of essential metals like copper (Cu), manganese (Mn), selenium (Se) and zinc (Zn)3,14,16,19-23 in blood, β-carotene,
lycopene and vitamins (A and E) in plasma17,24,25 are shown in
Table 2, along with interseasonal comparisons of these parameters. Blood Cu, Se and Zn levels were signiicantly lower in the RS when compared to DS, whereas blood Mn levels did not difer signiicantly between seasons. Plasma β-carotene and vitamin E levels were signiicantly higher in the RS, while lycopene values were signiicantly lower in the RS. Seasonality did not inluence plasma vitamin A values.
A comparison of our data with reference values for these nutrients shows that 22.6% of our study population had blood Cu <700μg/L (hypocupremic)19 during the RS. Of these, fourteen
were women (mean: 627 ± 53μg/L) and ive were men (mean: 661μg/L ± 25). In the same season, 98.8% of participants had blood Mn above the reference values (>15μg/L)21, whereas
Table 1. Sociodemographic characteristics of the study population
Variables Rainy Season (n=84) Dry Season (n=103)
Mean ± SD Median Range Mean ± SD Median Range
Age (years) 35.2 ± 15.0 32.0 14.0-67.0 39.0 ± 15.6 38.0 14.0-77.0
BMI (Kg/m2) 23.6 ± 3.6 23.1 19.2-35.2 23.7 ± 3.8 23.1 18.7-42.3
Schooling (years
of education) 4.6 ± 3.2 4.0 0.0-16.0 3.8 ± 3.4 3.0 0.0-16.0
Age categories n (%) n (%)
≤24 24 (28.6) 21 (20.4)
25-34 21 (25.0) 23 (22.3)
35-44 13 (15.5) 21 (20.4)
45-54 13 (15.5) 18 (17.5)
55-64 12 (14.2) 12 (11.6)
≥65 01 (1.20) 08 (7.80)
Born in Pará State
Yes 44 (51.2) 53 (51.5)
No 40 (48.8)
Alcohol
consumption 50 (48.5)
Drinkers 14 (17.0) 18 (17.5)
Non-drinkers 70 (83.0) 85 (82.5)
Smoking Habits
Current smoker 25 (29.7) 32 (31.1)
Non- or
ex-smoker 59 (70.3) 71 (68.9)
Schooling
NFE ES or HS U NFE ES or HS U
6 (7.1) 76 (90.5) 2 (2.4) 18 (17.5) 84 (81.5) 1 (1.0)
Se levels <100μg/L (Se deiciency), from 100 to 340μg/L (Se normal range) and from 341 to 1000μg/L (superior to the normal range, but ranging without NOAEL)23 were found for
1.2%, 67.1% and 31.7% of participants, respectively. None of the participants had blood Se levels >1000μg/L (over the NOAEL established at 1000μg/L)23. Moreover, in the RS 80.3%
and 19.7% of participants had blood Zn levels ranging from 3500 to 9500μg/L and >9500μg/L, respectively. None of the participants had blood Zn <3500μg/L. Still on RS, only one participant (1.2%) had plasma β-carotene values <0.30μM/L (deiciency)24, while 46.6% of participants had plasma lycopene
levels <0.10μM/L (deiciency)24. All participants had plasma
vitamin A >0.70μM/L (normal values)24, and plasma vitamin
E of two participants was <12μM/L (deiciency)24.
A diferent proile was observed for Cu, carotenoid and vitamin E blood levelsduring DS. Blood Cu levels <700μg/L were observed in 9.7% of participants, of whom ive were women (mean: 610 ± 133μg/L) and ive were men (mean: 493 ± 127μg/L). In this season, 32% of participants had plasma β-carotene values <0.30μM/L and 6% had plasma lycopene levels <0.10μM/L. For 45.6% of the study population plasma concentrations of vitamin E were <12μM/L.
For both seasons participants with blood Cu levels <700μg/L (hypocupremic) had blood Zn levels higher than individuals with blood Cu levels ≥700μg/L (normocupremic). In the RS, mean blood Zn levels in hypocupremic participants versus
normocupremic participants were 8308 ± 1972μg/L as against 6756 ± 940μg/L (p=0.007), respectively. In the DS, mean blood Zn levels in hypocupremic and normocupremic subjects were 11083 ± 3571μg/L and 6949 ± 1916μg/L (p=0.0004), respectively.
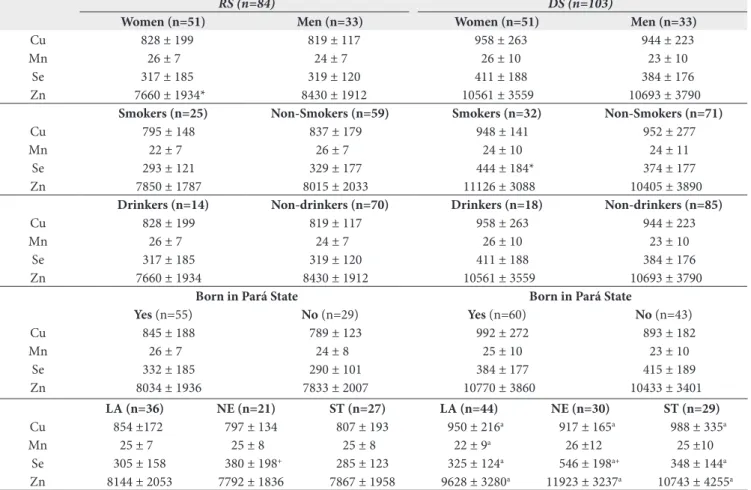
Blood metals with respect to such categorical variables are described in Table 3. Cu and Mn mean values did not signiicantly vary according to any of these variables. Only during DS smokers had signiicantly higher blood Se than non-smokers (p=0.02). For Zn levels, in the RS blood Zn was signiicantly higher in men than women (p=0.04). However, both blood Se and Zn did not change in accordance with alcohol consumption and immigrant status. Additionally, regarding occupation, the individuals who both farmed and ished showed signiicantly higher blood Cu than individuals with a single occupation during DS (966μg/L ± 104 versus. 947μg/L ± 249; p=0.04); indeed, the blood Mn, Se and Zn mean values did not alter regarding occupation (results not shown). Also, in both seasons none of the metals presented signiicant diference among age categories (≤24; 25-34; 35-44; 45-54; 55-64 and ≥65 years old).
Table 3 also shows intercommunity diferences for metals within the same season as well as intercommunity diferences between the seasons. Increased blood Cu, Se and Zn levels in the DS were observed for all communities (p<0.05) when compared to values found during the RS, with a more pronounced increase in blood Se observed for NE community; regardless of season, the levels of blood Se were higher in this community than LA Table 2. Descriptive statistics for essential metals, carotenoids and vitamins during the RS and DS
Rainy Season (n=84) Dry Season (n=103) Mann
Whitney Literature data
Median Range Median Range p value Range
Literature Ranges for Brazil
Literature Ranges for Pará State
Cu 791 529-1391 939 348-2314 <0.05 800-110019 620-219020
712-173216
794-163116
495-1578 (920)3
Mn 24 13-47 22 7-60 NS 4-1521
6.9-10.816
1.9-119 (14.5)22
9.1-18.416
Se 261 92-961 344 93-1033 <0.05 100-34023 49-41020
72-15816
132-24516
142.1-2029 (361.7)14
Zn 7631 5015-13452 10852 1294-19238 <0.05 3500-950015 470-185020 3518-12294
(8945)3
Carot 1.14 0.25-5.53 0.36 0.10-1.57 <0.05 >0.3024 (0.52)17
(0.64)25
-Lyc 0.10 0.04-0.36 0.23 0.05-0.90 <0.05 >0.1024 (0.68)17
(0.64)25
-Vit A 1.90 1.18-2.98 1.89 0.64-3.23 NS >0.7024 (2.30)17
-Vit E 20.14 9.45-43.2 12.00 4.02 ± 21.94 <0.05 >12.024 (25.6)17
(29.6)25
and ST (p<0.05). Moreover, blood Mn decreased signiicantly during DS in comparison with RS levels only in LA community (p<0.05).
Carotenoids and vitamin mean blood values follow changes in some sociodemographic and lifestyle determinants (Table 4). For instance, alcohol consumers had signiicantly lower (in both seasons) plasma β-carotene levels than non-consumers (both p<0.0001). Interestingly, plasma lycopene was signiicantly higher during DS only in subjects who were born in the State of PA when compared to individuals not born there (p<0.0001). Regarding occupation (data not shown), only during DS those who described themselves as both farmers and ishermen (n=35) have plasma β-carotene that was signiicantly lower than that of single-occupation, for 41 participants (0.23μM/L ± 0.16 vs. 0.42μM/L ± 0.24; p = 0.01).
Table 4 also shows that plasma vitamin A was signiicantly higher in alcohol drinkers compared to non-drinkers (p=0.03) in both seasons. For vitamin E, their plasma levels were respectively signiicantly lower in drinkers and smokers compared to non-drinkers (p=0.04) and non-smokers (p=0.01) only during DS. In the same season, plasma vitamin E levels were signiicantly
(p<0.0001) higher in participants born in PA. In the same way that essential metals, for both seasons, the plasma vitamins and carotenoids levels were not diferent among the age categories. In all communities, plasma β-carotene levels were higher during RS in comparison to DS levels (p<0.05) (Table 4). Additionally, during RS the order of values for this carotenoid was LA>ST>NE (p<0.05), while during DS the order of values for plasma β-carotene levels was LA>NE>ST (p<0.05). In contrast to plasma β-carotene levels, all communities had lower plasma lycopene concentrations in the RS than those in the DS (p<0.05). RS plasma levels of this micronutrient were lower in ST than those in LA or NE (p<0.05). For the DS, plasma lycopene dropped in the order of ST>LA>NE (p<0.05). Regarding vitamins, neither vitamin A nor vitamin E plasma levels varied among communities in either season. In addition, all communities presented higher plasma vitamin E levels during RS regarding DS (p<0.05).
Additionally, in both seasons, none of the continuous variables like age, BMI or years of education were associated with blood metals levels, carotenoids and vitamins (data not shown).
Source: Tapajós River region, State of Pará (Brazilian Amazon), 2010-2011. Cu: cooper; Mn: manganese; Se: selenium; Zn: zinc. *Signiicant diference for a given season (Mann Whitney U test). a Signiicant diferent (Mann Whitney U test) from values found in RS for the same community. + Intercommunity signiicant
diference (Kruskall Wallis test).
LA (n=36) NE (n=21) ST (n=27) LA (n=44) NE (n=30) ST (n=29)
Cu 854 ±172 797 ± 134 807 ± 193 950 ± 216a 917 ± 165a 988 ± 335a
Mn 25 ± 7 25 ± 8 25 ± 8 22 ± 9a 26 ±12 25 ±10
Se 305 ± 158 380 ± 198+ 285 ± 123 325 ± 124a 546 ± 198a+ 348 ± 144a
Zn 8144 ± 2053 7792 ± 1836 7867 ± 1958 9628 ± 3280a 11923 ± 3237a 10743 ± 4255a
Table 3. Essential metal status according to sex, smoking status, alcohol consumption, the regional origin and community location
RS (n=84) DS (n=103)
Women (n=51) Men (n=33) Women (n=51) Men (n=33)
Cu 828 ± 199 819 ± 117 958 ± 263 944 ± 223
Mn 26 ± 7 24 ± 7 26 ± 10 23 ± 10
Se 317 ± 185 319 ± 120 411 ± 188 384 ± 176
Zn 7660 ± 1934* 8430 ± 1912 10561 ± 3559 10693 ± 3790
Smokers (n=25) Non-Smokers (n=59) Smokers (n=32) Non-Smokers (n=71)
Cu 795 ± 148 837 ± 179 948 ± 141 952 ± 277
Mn 22 ± 7 26 ± 7 24 ± 10 24 ± 11
Se 293 ± 121 329 ± 177 444 ± 184* 374 ± 177
Zn 7850 ± 1787 8015 ± 2033 11126 ± 3088 10405 ± 3890
Drinkers (n=14) Non-drinkers (n=70) Drinkers (n=18) Non-drinkers (n=85)
Cu 828 ± 199 819 ± 117 958 ± 263 944 ± 223
Mn 26 ± 7 24 ± 7 26 ± 10 23 ± 10
Se 317 ± 185 319 ± 120 411 ± 188 384 ± 176
Zn 7660 ± 1934 8430 ± 1912 10561 ± 3559 10693 ± 3790
Born in Pará State Born in Pará State
Yes (n=55) No (n=29) Yes (n=60) No (n=43)
Cu 845 ± 188 789 ± 123 992 ± 272 893 ± 182
Mn 26 ± 7 24 ± 8 25 ± 10 23 ± 10
Se 332 ± 185 290 ± 101 384 ± 177 415 ± 189
▄
DISCUSSIONTo our knowledge, this is the irst study to provide plasmatic levels of lycopene, β-carotene and vitamins (A and E) in riparian populations of the Brazilian Amazon. he results also demonstrate that seasonality appears to inluence blood micronutrient levels in agricultural and ishing villagers of the Tapajós River region. Community location, sex, smoking status and drinking habits as well as regional origin did also alter some blood micronutrient levels.
Knowledge about blood micronutrient levels is of great importance in Brazilian Amazon, since many publications have shown that several nutrients modify the toxicokinetics and toxicodynamics of Hg2,9,10,26,27, which is particularly interesting in
the context of this current investigation since numerous studies have reported high Hg levels in hair, blood and plasma among Amazonian populations5-7. Our indings of seasonal blood
variation of essential metals (Cu, Se and Zn), carotenoids and vitamin E are probably a result of seasonal variations in food availability. For example, bean consumption by this population decreases signiicantly during DS and beans are an important source of Cu and Zn28. his may be one determinant to lower
blood levels of Cu and Zn during DS. In addition, regardless of the season, our indings indicate that sources of both Zn and Cu appear to be uniform in LA, NE and ST communities.
In both seasons the average values for blood Cu are consistent with previous studies carried out with other communities near the study region3, as well as communities located in other
Brazilian regions16, or in other populations elsewhere15,29,30.
Although hypocupremia is a rare condition in humans, it has been observed in the present study population (mainly during the RS). It is known that an increase in Zn intake may stimulate the synthesis of metalothionein, which has a high ainity for Cu. his probably results in a decrease in Cu absorption by intestinal cells31 and may contribute to the observed hypocupremia, since
individuals with blood Cu <700μg/L had higher blood Zn. While the reference range in other biomonitoring studies for blood Zn lies from 3900μg/L to 9102μg/L15,30, much higher ranges
and means (e.g., 5015-13452; mean: 7964μg/L Vs. 1294-19238; mean: 10646μg/L) in RS and DS, respectively, were observed in our study population, which could be explained by the high levels of Zn in the typical diet of these riparian populations28.
In the same way, independently of the season, the Mn levels
Source: Tapajós River region, State of Pará (Brazilian Amazon), 2010-2011. Carot: β-carotene; Lyc: lycopene; Vit A: vitamin A; Vit E: vitamin E. *Signiicant diference for a given season (Mann Whitney U test). a Signiicant diferent (Mann Whitney U test) from values found in RS for the same community. + Intercommunity
signiicant diference (Kruskall Wallis test).
LA (n=36) NE (n=21) ST (n=27) LA (n=44) NE (n=30) ST (n=29)
Carot 1.91 ±1.47a+ 1.32 ±0.61a+ 1.16 ±0.73a+ 0.46 ± 0.28+ 0.32 ± 0.18+ 0.39 ± 0.20+
Lyc 0.13 ± 0.07a 0.13 ± 0.07a 0.10 ±0.06a+ 0.23 ± 0.09+ 0.17 ± 0.08+ 0.38 ± 0.16+
Vit A 2.01 ± 0.46 1.95 ± 0.48 1.92 ± 0.39 1.95 ± 0.53 1.86 ± 0.47 2.03 ± 0.50
Vit E 24.1 ± 7.68a 20.0 ± 4.28a 20.2 ± 7.76a 12.3 ± 3.20 10.5 ± 2.76 13.5 ± 2.75
Table 4. Plasma carotenoids and vitamins according to sex, smoking status, alcohol consumption, regional origin and community location
RS (n=84) DS (n=103)
Women (n=51) Men (n=33) Women (n=51) Men (n=33)
Carot 1.60 ± 1.12 1.42 ± 1.18 0.38 ± 0.25 0.41 ± 0.23
Lyc 0.16 ± 0.07 0.12 ± 0.07 0.27 ± 0.16 0.23 ± 0.12
Vit A 1.90 ± 0.41 2.08 ± 0.46 1.88 ± 0.53 2.02 ± 0.47
Vit E 22.93 ± 7.95 20.19 ± 5.65 12.75 ± 3.51 11.46 ± 2.64
Smokers (n=25) Non-Smokers (n=59) Smokers (n=32) Non-Smokers (n=71)
Carot 1.20 ± 0.63 1.66 ± 1.27 0.39 ± 0.15 0.40 ± 0.27
Lyc 0.09 ± 0.04 0.13 ± 0.08 0.25 ± 0.11 0.25 ± 0.15
Vit A 2.06 ± 0.42 1.93 ± 0.45 2.03 ± 0.50 1.92 ± 0.51
Vit E 22.51 ± 6.87 21.61 ± 7.41 10.90 ± 1.99* 12.62 ± 3.42
Drinkers (n=14) Non-drinkers (n=70) Drinkers (n=18) Non-drinkers (n=85)
Carot 1.00 ± 0.78* 1.63 ± 1.17 0.30 ± 0.13* 0.42 ± 0.25
Lyc 0.11 ± 0.04 0.12 ± 0.07 0.21 ± 0.12 0.26 ± 0.14
Vit A 2.13 ± 0.46* 1.93 ± 0.43 2.15 ± 0.34* 1.90 ± 0.52
Vit E 19.27 ± 3.60 22.35 ± 7.65 10.57 ± 2.74* 12.42 ± 3.14
Born in Pará State Born in Pará State
Yes (n=55) No (n=29) Yes (n=60) No (n=43)
Carot 1.52 ± 1.25 1.56 ± 0.94 0.41 ± 0.19 0.39 ± 0.29
Lyc 0.12 ± 0.07 0.12 ± 0.06 0.30 ± 0.15* 0.19 ± 0.09
Vit A 1.96 ± 0.43 1.97 ± 0.46 1.99 ± 0.52 1.90 ± 0.48
are greater than those described for reference range21 and in
other Brazilian regions16,20. However this study conirms that
populations from Northern Brazil have signiicantly higher Mn levels in comparison to people from other Brazilian states16,22. Açai fruit, a typical Amazon region berry, has high levels of essential elements, especially Mn32, and its consumption could be
associated with high blood Mn levels. However, the interpretation of our indings with respect to such status is limited by the lack of information on individuals’ diet (for example, nutrients quantiication in food more consumed by our study population).
In addition to the increased zinc levels, typical riparian foods including Brazil nuts, ish, eggs and chicken, are known sources of Se14, which may explain the higher levels of blood
Se found in this population as compared to other geographic regions in Brazil16 and other countries15,31; usually the observed
blood levels are lower than 120µg/L23 in populations that do
not ingest Se pills. Se concentrations in the same type of food vary from community to community and from season to season in this area12, and this could explain our indings that in the
study population the DS blood Se levels were higher than RS levels, which difer from Lemire et al. (2009)’s indings33. hese
authors found that riparians living close to the area evaluated in the present study had more pronounced blood Se levels, but not so signiicant in the rising water season. However, the same authors found that when only inhabitants of the same community were considered, blood Se levels were higher in the DS. he higher blood Se levels in NE compared to other communities (Table 4) conirm intercommunity variation and show that availability of Se-rich food and consumption habits difer among communities14,33.
Interestingly, the population’s RS plasma β-carotene levels are substantially higher than those currently found in other populations13,34, and even in other Brazilian areas17,25. During
the dry season, plasma β-carotene levels drop considerably but still remain in the safe range (>0.30μM/L) recommended by WHO24. It is known that the main sources of β-carotene are
fruits and vegetables, and a previous study conducted in the same region revealed that the consumption of this type of food is much higher in the RS when compared to the DS1, which
is consistent with the interseasonal pattern we found. Unlike those of plasma β-carotene, the levels of lycopene were higher in the DS, with mean levels found in both seasons lower than in other studies with other populations all over the world34,35, and
even from studies with other Brazilians living in the southern region17,25. Plasma carotenoids levels found in this study are in
good agreement with the lower limit found for North American populations35.
WHO deines plasma vitamin A deiciency as <0.35μM/L, with incipient deiciency levels ranging from 0.35 to 0.70μM/L24.
We observed that regardless of season, plasma vitamin A values
were above the WHO normal, which disagrees with previous studies of Amazon populations that reported a deiciency of this vitamin36,37.
We observed vitamin E deiciency in a larger number of people during the DS, assuming the WHO deinition of vitamin E deiciency as plasma values <12μM/L24. Fish is the route of
exposure to Hg for this study population38, but ish also contains
important nutrients such as proteins, omega-3 fatty acids and vitamin E39. he amount of ish consumed in this region does
not difer between DS and RS, albeit the consumed ish species vary along with seasons1,2. hus, since plasma vitamin E was
diferent between seasons, we hypothesise that vitamin E levels may depend upon ish species being consumed. Additionally, our indings show similar plasma vitamin E levels in the three communities (all deicient during DS), which may indicate a common vitamin E source, independent of the location but seems to be dependent on seasonality.
Several studies evaluate the inluence of sociodemographic variables on blood micronutrient levels. he relationship between blood Cu and Zn levels and age is contradictory in the literature3,15,16. In the present study, the lack of correlation
between age and blood Cu and Zn levels may be explained by the youth of most participants. Moreover, contrary to other studies, age does not inluence blood Mn and Se levels or plasma vitamins A or E14,15,40. Among carotenoids, β-carotene
is generally higher in individual’s ≥60 years, while lycopene is lower in individual’s ≥60 years41.
he association of micronutrients with age and sex is heavily dependent upon the presence of covariates associated to lifestyle. Inlammatory processes, oxidative stress and possible reduction in food intake in smokers may elevate Cu status42,
as well as decrease Se, β-carotene and lycopene blood levels43.
Decreased bioavailability of vitamin A and β-carotene is also reported in smokers42. However, previous studies have found
no blood variability of Cu, Mn, Zn, β-carotene, lycopene or vitamin A13,15,40 regarding smoking status. Following Sanchez
and colleagues40, we hypothesise that diferent quantities of
cigarettes smoked may be relected in diferent conclusions in the literature. Unfortunately, the investigation of the number of cigarettes smoked per day and the dosage of cotinine were not performed in the present study.
Alcoholic beverages consumption leads to dysfunctions in the neuroendocrine system, and can reduce Cu44 and Se45
blood levels and/or increase Mn concentration in this biological compartment46. Moreover, an increase in Zn renal excretion
could be associated with alcohol consumption47, while the
consumption of grape-based alcoholic beverage, such as wine, can induce additional Cu15 and Zn48 intake. Alcohol consumption
observed with other populations15,49. It is worth pointing out that
the majority of the participants in the present study declared they do not drink alcoholic beverages, and the small number of alcohol consumers may have contributed to our indings. On the other hand, even with the small number of alcohol drinkers, alcohol was an important covariate for the changes in β-carotene and vitamins A and E levels.
In this current study blood Cu levels rose in participants who both farmed and ished, and in these same individuals β-carotene levels were lower. hese indings may be associated to the amount of physical exercise performed by ishermen and farmers since it has been found that physical activity can result in the redistribution of micronutrients in the body50. In the
Amazon region, performing agricultural and ishing activities requires intense physical efort, particularly so during the DS. Moreover, blood Cu levels tend to increase with intense physical activity42 while plasma β-carotene tends to move in the opposite
direction51; more free radicals are produced in people doing
physical exercise than in sedentary individuals, and this can cause β-carotene depletion.
Overall, our study has some limitations, one of the most important being that there was no research about the types
of food consumed (through food frequency questionnaire with the study population). hus, the information on food frequency consumed during the dry and rainy season in this study was based on a study of 20011, which was performed in
the community of Brasília Legal, nearby our study area. Another limitation is that we did not evaluate the nutrient contents of the main foods consumed in this region during the two study periods, while it is known that nutrient contents can be diferent among diferent places17,32. hese limitations prevented us from
identifying more speciic exposure pathways to blood Cu, Mn, Se, Zn, carotenoids and vitamins in this population.
▄
CONCLUSIONShis study highlights for the irst time carotenoids and vitamins blood levels for Tapajós River populations. It sets baseline values in two diferent seasons for populations characterised with a unique lifestyle and eating habits, which change considerably according to seasons. Our data provide a basis for future studies aiming at understanding the efects of micronutrient modulation on the toxic efects of Hg exposure and/or lead, to which the study population is knowingly exposed.
▄
REFERENCES1. Passos CJS, Mergler D, Gaspar E, Morais S, Lucotte M, Larribe F, et al. Characterization of the diet of a riparian population in the Brazilian Amazon. Rev Saúde Amb. 2001;4:72-84.
2. Passos CJS, Mergler D, Fillion M, Lemire M, Mertens F, Guimarães JR, et al. Epidemiologic confirmation that fruit consumption influences mercury exposure in riparian communities in the Brazilian Amazon. Environ Res. 2007;105(2):183-93. http://dx.doi.org/10.1016/j.envres.2007.01.012. PMid:17374370.
3. Rodrigues JL, Batista BL, Fillion M, Passos CJS, Mergler D, Barbosa Jr F. Trace element levels in whole blood of riparian villagers of the Brazilian Amazon. Sci Total Environ. 2009;407(13):4168-73. http://dx.doi.org/10.1016/j. scitotenv.2009.02.041. PMid:19329141.
4. Malm O, Pfeiffer WC, Souza CMM, Reuther R. Mercury pollution due to gold mining in the Madeira river basin, Brazil. Ambio. 1990;19:11-5.
5. Dolbec J, Mergler D, Larribe F, Roulet M, Lebel J, Lucotte M. Sequential analysis of hair mercury levels in relation to fish diet of an Amazonian population, Brazil. Sci Total Environ. 2001;271(1-3):87-97. http://dx.doi. org/10.1016/S0048-9697(00)00835-4. PMid:11346043.
6. Passos CJ, Mergler D, Gaspar E, Morais S, Lucotte M, Larribe F, et al. Eating tropical fruit reduces mercury exposure from fish consumption in the Brazilian Amazon. Environ Res. 2003;93(2):123-30. http://dx.doi. org/10.1016/S0013-9351(03)00019-7. PMid:12963396.
7. Grotto D, Valentini J, Fillion M, Passos CJS, Garcia SC, Mergler D, et al. Mercury exposure and oxidative stress in communities of the Brazilian Amazon. Sci Total Environ. 2010;408(4):806-11. http://dx.doi.org/10.1016/j. scitotenv.2009.10.053. PMid:19914681.
8. Gagné D, Lauzière J, Blanchet R, Vézina C, Vaissière E, Ayotte P, et al. Consumption of tomato products is associated with lower blood mercury levels in Inuit preschool children. Food Chem Toxicol. 2013;51:404-10. http://dx.doi.org/10.1016/j.fct.2012.10.031. PMid:23127601.
9. Chapman L, Chan HM. The influence of nutrition on methyl mercury intoxication. Environ Health Perspect. 2000;108(Suppl 1):29-56. http:// dx.doi.org/10.1289/ehp.00108s129. PMid:10698722.
10. Bélanger M-C, Mirault M-E, Dewailly E, Plante M, Berthiaume L, Noël M, et al. Seasonal mercury exposure and oxidant-antioxidant status of James Bay sport fishermen.. Metabolism. 2008;57(5):630-6. http://dx.doi. org/10.1016/j.metabol.2007.12.006. PMid:18442625.
11. Thurnham DI, Northrop-Clewes CA, Chopra M. Biomarkers of vegetable and fruit intakes. Am J Clin Nutr. 1998;68(3):756-8. PMid:9734759.
12. Lemire M, Fillion M, Barbosa F Jr, Guimarães JR, Mergler D. Elevated levels of selenium in the typical diet of Amazonian riverside populations. Sci Total Environ. 2010;408(19):4076-84. http://dx.doi.org/10.1016/j. scitotenv.2010.05.022. PMid:20646739.
13. Galan P, Viteri FE, Bertrais S, Czernichow S, Faure H, Arnaud J, et al. Serum concentrations of beta-carotene, vitamins C and E, zinc and selenium are influenced by sex, age, diet, smoking status, alcohol consumption and corpulence in a general French adult population. Eur J Clin Nutr. 2005;59(10):1181-90. http://dx.doi.org/10.1038/sj.ejcn.1602230. PMid:16034362.
15. Bocca B, Madeddu R, Asara Y, Tolu P, Marchal JÁ, Forte G. Assessment of reference ranges for blood Cu, Mn, Se and Zn in a selected Italian population. J Trace Elem Med Biol. 2011;25(1):19-26. http://dx.doi.org/10.1016/j. jtemb.2010.12.004. PMid:21242073.
16. Nunes JA, Batista BL, Rodrigues JL, Caldas NM, Neto JÁ, Barbosa Jr F. A simple method based on ICP-MS for estimation of background levels of arsenic, cadmium, copper, manganese, nickel, lead and selenium in blood pf the brazilian population. J Toxicol Environ Health A. 2010;73(13-14):878-87. http://dx.doi.org/10.1080/15287391003744807. PMid:20563921.
17. Charão MF, Moro AM, Brucker N, Bulcão RP, Baierle M, Freitas F, et al. Simultaneous quantification of lycopene, β-carotene, retinol and α-tocopherol in plasma after a simple extraction procedure: stability study and application to human volunteers. J Braz Chem Soc. 2012;23(8):1441-9. http://dx.doi. org/10.1590/S0103-50532012005000001.
18. World Health Organization. Obesity: preventing and managing the global epidemic. Geneva; 1996. Report of World Health Organization Consultation on Obesity.
19. World Health Organization. Trace elements in human nutrition and health. Geneva: WHO; 1996.
20. Baierle M, Charão MF, Göethel G, Barth A, Fracasso R, Bubols G, et al. Are delta-aminolevulinate dehydratase inhibition and metal concentrations additional factors for the age-related cognitive decline? Int J Environ Res Public Health. 2014;11(10):10851-67. http://dx.doi.org/10.3390/ ijerph111010851. PMid:25329536.
21. Agency for Toxic Substances and Disease Registry. Toxicological profile for manganese. Atlanta: Centers for Disease Control; 2012.
22. Freire C, Koifman RJ, Fujimoto D, de Oliveira Souza VC, Barbosa F Jr, Koifman S. Reference values of cadmium, arsenic and manganese in blood and factors associated with exposure levels among adult population of Rio Branco, Acre, Brazil. Chemosphere. 2015;128:70-8. http://dx.doi. org/10.1016/j.chemosphere.2014.12.083. PMid:25655821.
23. United State Environmental Protection Agency. Integrated risk information systems (IRIS) for selenium. Washington: National Centre for Environmental Assessment, Office of Research and Development; 2002. 444 p.
24. World Health Organization. Obesity, preventing and managing the global epidemic. Geneva: WHO; 2000. Report of the World Health Organization Consultation of Obesity.
25. Roehrs M, Valentini J, Paniz C, Moro A, Charão M, Bulcão R, et al. The relationships between exogenous and endogenous antioxidants with the lipid profile and oxidative damage in hemodialysis patients. BMC Nephrol. 2011;12(1):59. http://dx.doi.org/10.1186/1471-2369-12-59. PMid:22029620.
26. Grotto D, Vicentini J, Angeli JPF, Latorraca EF, Monteiro PA, Barcelos GR, et al. Evaluation of protective effects of fish oil against oxidative damage in rats exposed to methylmercury. Ecotoxicol Environ Saf. 2011a;74(3):487-93. http://dx.doi.org/10.1016/j.ecoenv.2010.10.012. PMid:20970192.
27. Manzolli ES, Serpeloni JM, Grotto D, Bastos JK, Antunes LMG, Barbosa F, et al. Protective effects of the flavonoid chrysin against methylmercury-induced genotoxicity and alterations of antioxidant status, in vivo. Oxid Med Cell Longev. 2015;2015:602360. http://dx.doi.org/10.1155/2015/602360. PMid:25810809.
28. Nardi EP, Evangelista FS, Tormen L, Saint´Pierre TD, Curtius AJ, Souza SS, et al. The use of inductively coupled plasma mass spectrometry (ICP-MS) for the determination of toxic and essential elements in different types of food samples. Food Chem. 2009;112(3):727-32. http://dx.doi. org/10.1016/j.foodchem.2008.06.010.
29. Minoia C, Sabbioni E, Apostoli P, Pietra R, Pozzoli L, Gallorini M, et al. Trace element reference values in tissues from inhabitants of the European community I. A study of 46 elements in urine, blood and serum of Italian subjects. Sci Total Environ. 1990;95:89-105. http://dx.doi.org/10.1016/0048-9697(90)90055-Y. PMid:2402627.
30. Moreno MA, Marin C, Vinagre F, Ostapczuk P. Trace element levels in whole blood samples from residents of the city Badajoz, Spain. Sci Total Environ. 1999;229(3):209-15. http://dx.doi.org/10.1016/S0048-9697(99)00074-1. PMid:10418170.
31. Bárány E, Bergdahl IA, Bratteby LE, Lundh T, Samuelson G, Schutz A, et al. Relationships between trace element concentrations in human blood and serum. Toxicol Lett. 2002;134(1-3):177-84. http://dx.doi.org/10.1016/ S0378-4274(02)00187-X. PMid:12191876.
32. Santos VS, Teixeira GHA, Barbosa Jr F. Açaí (Euterpe oleracea Mart.): a tropical fruit with high levels of essential minerals-especially manganese-and its contribution as a source of natural mineral supplementation. J Toxicol Environ Health A. 2014;77(1–3):80-9. http://dx.doi.org/10.1080/1528739 4.2014.866923. PMid:24555649.
33. Lemire M, Mergler D, Huel G, Passos CJS, Fillion M, Philibert A, et al. Biomarkers of selenium status in the Amazoniam context: blood, urine and sequential hair segments. J Expo Sci Environ Epidemiol. 2009;19(2):213-22. http://dx.doi.org/10.1038/jes.2008.14. PMid:18446187.
34. Olmedilla B, Granado F, Southon S, Wright AJ, Blanco I, Gil-Martinez E, et al. Serum concentrations of carotenoids and vitamins A, E, and C in control subjects from five European countries. Br J Nutr. 2001;85(2):227-38. http://dx.doi.org/10.1079/BJN2000248. PMid:11242491.
35. National Health and Nutrition Examination Survey. National report on biochemical indicators of diet and nutrition in the U.S. population 1999-2002. Atlanta: NHANES; 1999-2002.
36. Alencar FH, Castro JS, Yuyama LKO, Marinho HA, Nagahama D. Diagnóstico da realidade nutricional no Estado do Amazonas, Brasil. I: Hipovitaminose A. Acta Amazon. 2002;32(4):613-23. http://dx.doi.org/10.1590/1809-43922002324613.
37. Pinheiro MM, Ciconelli RM, Chaves GV, Aquino L, Juzwiak CR, Genaro PS, et al. Antioxidant intake among Brazilian adults -The Brazilian Osteoporosis Study (BRAZOS): a cross-sectional study. Nutr J. 2011;10(1):39. http://dx.doi.org/10.1186/1475-2891-10-39. PMid:21513578.
38. Grotto D, Valentini J, Serpeloni JM, Monteiro PA, Latorraca EF, de Oliveira RS, et al. Evaluation of toxic effects of a diet containing fish contaminated with methylmercury in rats mimicking the exposure in the Amazon riverside population.. Environ Res. 2011b;111(8):1074-82. http://dx.doi. org/10.1016/j.envres.2011.09.013. PMid:22000760.
39. Afonso C, Lourenço HM, Pereira C, Martins MF, Carvalho ML, Castro M, et al. Total and organic mercury,selenium and α-tocopherol in some deep-water fish species. J Sci Food Agric. 2008;88(14):2543-50. http:// dx.doi.org/10.1002/jsfa.3379.
40. Sánchez C, López-Jurado M, Aranda P, Llopis J. Plasma levels of copper, manganese and selenium in an adult population in southern Spain: Influence of age, obesity and lifestyle factors. Sci Total Environ. 2010;408(5):1014-20. http://dx.doi.org/10.1016/j.scitotenv.2009.11.041. PMid:20018346.
41. Milne DB, Nielsen FH. Effects of a diet low in copper on copper-status indicators in postmenopausal women. Am J Clin Nutr. 1996;63(3):358-64. PMid:8602593.
43. Kocyigit A, Erel O, Gur S. Effects of tobacco smoking on plasma selenium, zinc, copper and iron concentrations and related antioxidative enzyme activities. Clin Biochem. 2001;34(8):629-33. http://dx.doi.org/10.1016/ S0009-9120(01)00271-5. PMid:11849622.
44. Fields M, Lewis CG. Alcohol consumption aggravates copper deficiency. Metabolism. 1990;39(6):610-3. http://dx.doi.org/10.1016/0026-0495(90)90027-A. PMid:2352478.
45. Borawska MH, Witkowska AM, Hukalowicz K, Markiewicz R. Influence of dietary habits on serum selenium concentration. Ann Nutr Metab. 2004;48(3):134-40. http://dx.doi.org/10.1159/000078375. PMid:15133317.
46. Sassine MP, Mergler D, Bowler R, Hudnell HK. Manganese accentuates adverse mental health effects associated with alcohol use disorders. Biol Psychiatry. 2002;51(11):909-21. http://dx.doi.org/10.1016/S0006-3223(01)01350-6. PMid:12022965.
47. King JC. Determinants of maternal zinc status during pregnancy. Am J Clin Nutr. 2000;71(5 Suppl):1334S-43S. PMid:10799411.
48. López-Artíguez M, Grilo A, Soria ML, Castro M, Repetto M. Levels of zinc, copper and lead in wines from the area south of Seville. Bull Environ Contam Toxicol. 1990;45(5):711-7. http://dx.doi.org/10.1007/BF01700990. PMid:2265270.
49. Sánchez C, López-Jurado M, Planells E, Llopis J, Aranda P. Assessment of iron and zinc intake and related biochemical parameters in an adult Mediterranean population from southern Spain: influence of lifestyle factors. J Nutr Biochem. 2009;20(2):125-31. http://dx.doi.org/10.1016/j. jnutbio.2007.12.008. PMid:18547795.
50. Nasolodin W, Gladkikh IP. Manganese provision in trained and untrained schoolchildren and students in different seasons. Gig Sanit. 2007;1(1):59-61. PMid:17343058.
51. Parthasarathy S, Santanam N, Ramachandran S, Meilhac O. Potential role of oxidized lipids and lipoproteins in antioxidant defense. Free Radic Res. 2000;33(3):197-215. http://dx.doi.org/10.1080/10715760000301381. PMid:10993475.