Original Article
Agreement assessment between hemoglobin
and hematocrit to detect anemia prevalence in
children less than 5 years old
Avaliação da concordância entre hemoglobina e
hematócrito para detectar prevalência de anemia em
crianças menores de 5 anos
Gisela Soares Brunken
1, Giovanny Vinícius Araújo de França
2,3,
Ronir Raggio Luiz
4, Sophia Cornbluth Szarfarc
51Departamento de Saúde Coletiva, Universidade Federal de Mato Grosso (UFMT) - Cuiabá (MT), Brazil. 2Centro de Pesquisas Epidemiológicas, Universidade Federal de Pelotas (UFPEL) - Pelotas (RS), Brazil. 3MRC Epidemiology Unit, Institute of Metabolic Science, Addenbrooke’s Hospital - Cambridge, UK.
4Instituto de Estudos em Saúde Coletiva, Universidade Federal do Rio de Janeiro (UFRJ) - Rio de Janeiro (RJ), Brazil. 5Faculdade de Saúde Pública, Universidade de São Paulo (USP) - São Paulo (SP), Brazil.
Study carried out at Federal University of Mato Grosso (UFMT) – Cuiabá (MT), Brazil.
Correspondence: Gisela Soares Brunken – Rua Buenos Aires, 726, apto 102, CEP: 78060-634 – Cuiabá (MT), Brazil – Email: [email protected] Financial support: none.
Conflict of interests: nothing to declare. Abstract
This study aimed to assess the extent of agreement between hemoglobin (Hb) and hematocrit (Ht), while also verifying whether anemia prevalence can be determined by hematocrit cut-off points. A hundred pairs of capillary Hb and Ht of children less than 5 years old were analyzed. The Hb and Ht concentrations were measured using HemoCue and microhematocrit centrifuge, respectively. The Bland and Altman’s method was used to assess the agreement between ‘observed Hb’ and ‘Hb estimated through Ht’ (Hb = Ht/3). The ROC curve was constructed based on the reference to anemia classification according to Hb. The subjects were classified according to the status of anemia obtained through the Ht, also evaluating the agreement regarding Hb. The area under the ROC curve identified that Ht <35% correctly classified 85% of subjects with Hb <11.0 g/dL. However, the cut-off point of <33% showed higher kappa (k = 0.49 against 0.41) and higher relative agreement (82% vs. 74%) compared to Ht <35%. Our findings indicate that capillary Hb and Ht could be used either together or separately to assess the prevalence of anemia. Considering the need to identify iron deficiency anemia with a single indicator in population studies, the use of Ht would be simpler and cost-saving. Keywords: hematocrit; hemoglobin; reproducibility of results; child preschool; anemia, iron-deficiency.
Resumo
O objetivo deste estudo foi avaliar o grau de concordância entre a hemoglobina (Hb) e o hematócrito (Ht), para verificar se a prevalência de anemia pode ser determinada pelo hematócrito. Cem pares de Hb e Ht capilar de crianças menores de 5 anos de idade foram analisados. A concentração de Ht e Hb foi medida utilizando centrífuga para microhematócrito e HemoCue, respectivamente. A análise de Bland e Altman foi utilizada para avaliar as diferenças entre os valores observados de Hb e de Hb estimada através de hematócrito (Hb = Ht / 3). A curva ROC foi calculada com referência à classificação de anemia ferropriva, a partir dos resultados de Hb. Os indivíduos foram classificados de acordo com o estado de anemia a partir do Ht, comparando com a avaliação obtida a partir da Hb. A área sob a curva ROC permite identificar que Ht <35% corretamente classificava 85% dos indivíduos com Hb <11,0 g/dL. No entanto, o ponto de corte Ht <33% apresentou maior kappa (k = 0,49 contra 0,41) e concordância relativa mais elevada (82% vs. 74%) em comparação com Ht <35%. A hemoglobina e o hematócrito capilar podem ser usados em conjunto ou separadamente para avaliar a prevalência de anemia. Considerando a necessidade de identificar a anemia ferropriva com um único indicador em estudos populacionais, a utilização do Ht seria mais simples e econômica.
▄
INTRODUCTIONIron deficiency anemia is the world’s most prevalent nutritional deiciency, afecting several countries worldwide, with serious consequences for human health, social development and economy1. Its etiology is diverse and can be attributed to
nutritional deiciencies of iron, folic acid, vitamin A, C or B12, as
well as numerous diseases, such as malaria, intestinal parasites, hemoglobinopathy. Iron deiciency has been identiied as the main contributing factor to anemia, so that the terms “anemia” and “iron deiciency” are oten treated as synonyms. As iron deiciency anemia is the most severe stage of the iron deiciency, it is estimated that there are about 2.5 times more individuals that are iron deicient than anemic2,3. Studies have shown that
anemia persists over last decades at high levels, during infancy and childhood4,5.
Diferent from anemia driven by vitamin B12 or folic acid deiciency, iron deiciency anemia is microcytic and hypochromic. here are several well-described laboratory measurements to access and monitor the nutritional status of iron, but only hemoglobin and hematocrit are routinely performed in ield trials6,7.
he hemoglobin concentration lower than 11 g/dL indicates anemia, regardless the etiology2. Venous blood measurement
is well standardized6,7, however practical issues limit its use in
epidemiological studies. herefore, Hb concentration is commonly measured in capillary blood, using an accurate point-of-care test such as the HemoCue (HemoCue AB, Angelholm, Sweden)8.
Collecting a drop of blood using a inger stick, rather than collecting venous blood using a syringe, is a signiicant advantage in the ield research. Moreover, it is fast, portable, shows directly the WHO anemia indicator and it is safer because it does not require aspiration or syringe. Unfortunately the cost of using HemoCue is high when compared to laboratory testsa and, once
the seal is removed, the tubes with 50 micro cuvettes have a shelf life of only three months. he Agabê deviceb is also available
since 2009, which is developed and produced in Brazil (M-Exa Biomedical Instrumentation). It allows dosing hemoglobin in a much more cost eicient manner. As the HemoCue device, it informs the hemoglobin concentration in capillary sample in real time, but requires dilution of the blood drop on the reagent, demanding cautious for treatment and evaluation of the sample in the ield.
he hematocrit (or packed cell volume) is the percentage of volume occupied by red blood cells compared to the total blood volume. It is obtained using a centrifuge microhaematocrit, a simple and cost-saving approachc, which is a portable and
At July 2014.
a HemoCue = R$ 4,850.00; Case with 200 microcuvettes = R$ 880.00 (R$ 4.40 / microcuvette).
b Agabê = R$ 120.00.
c Centrifug for microhematocrit, capacity for 24 capillary tubes, Centribio = R$ 2,900.00.
practical equipment for use in ield work. It requires a simple and short training period to operate, and a stable power source. It requires about 0.5 mL of blood, equivalent to a drop, extracted in a capillary tube, closed at one end and centrifuged6,7. As in
portable hemoglobinometers (HemoCue and Agabê), it does not require transportation of samples and the results are released in a few minutes. he same method is used by blood banks to identify donors feasibility. One limitation is the need of a high centrifugal force to prevent a signiicant amount of plasma being trapped between the red blood cells. his can be eliminated by the use of a stable power source7.
he hematocrit below 33% is an acceptable indicator for evaluation and identiication of anemic patients with hemoglobin in place2. here is a standard conversion between the two
measures (Hb = Ht/3) which is commonly used to deine cut-of points for estimating the prevalence of anemia9. Health services
has been using this indicator for anemia screening, since it is less expensive and more practical, but reliability studies are needed. In this study, we aimed to assess the agreement between hemoglobin and hematocrit capillary under ield conditions in children less than 5 years old, in order to identify a cut-of point with adequate psychometric characteristics for the outcome of hematocrit sensitive to identify individuals with microcytic anemia. It is important to investigate the advantage of using the hematocrit instead of hemoglobin. In fact, it is not to say that one method is better than another, but knowing that the two are consistent and, judging by the hematocrit, has its validity.
▄
MATERIALS AND METHODShis is a cross sectional study carried out in 2008 including 100 children less than 5 years old who attended three public day care centers in the city of Cuiabá, a city located in the Center-West region of Brazil, state of Mato Grosso, with an estimated population of 569.830 inhabitants. A previous study showed high prevalence (63%) of anemia among children aged less than 36 months in public day care centers of Cuiabá10.
Weight was measured on an electronic scale (capacity: 150 kg; precision: 50 g) and height using an anthropometric scale (precision: 0.5 cm). Nutritional status was classiied as: underweight – weight for age <–2 standard deviations (SD) of the WHO Child Growth Standards median11 –; stunting – height
for age <–2 SD – and overweight – weight-for-height >+2 SD. he associations between presence of anemia with sex, age and nutritional status were investigated using the qui-squared test. Samples of capillary hematocrit and hemoglobin were collected using the methodology recommended by the manual of the HemoCue equipment4. Participants were classiied according to
the status of anemia from hemoglobin concentrations, according to the cut-of point recommended by WHO2. Regarding the
the diagnosis and classiication of anemia, classifying as normal hemoglobin values lower than 11.0 g/dL and hematocrit lower than 33%. he prevalence of anemia was estimated according to nutritional status and age.
he Bland and Altman method12 was used to assess the
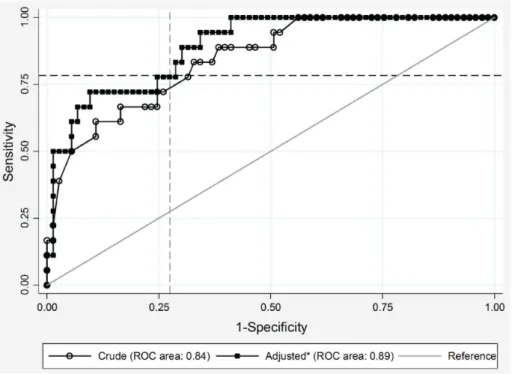
agreement between the two estimates of anemia status – ‘hemoglobin observed’ and ‘estimated hemoglobin’ (Hb = Ht/3), estimating the 95% limits of agreement from the diferences observed. he Receiver Operating Characteristic curve (ROC) was constructed in order to identify the hematocrit value that maximizes the sensitivity and speciicity in screening for anemia, with reference to the classiication obtained from the capillary hemoglobin, comparing the ‘crude’ and ‘adjusted for age and sex’ ROC area. Subjects were also classiied according to the status of anemia from hematocrit, using the cut-of point proposed by WHO2 and identiied from the ROC curve by calculating the
kappa coeicient to verify the degree of agreement in relation to the classiication by hemoglobin.
Analyses were performed using Stata, version 11.0. he study protocol was approved by the Ethics Committee in Research of Hospital Universitário Julio Muller, Universidade Federal do Mato Grosso.
▄
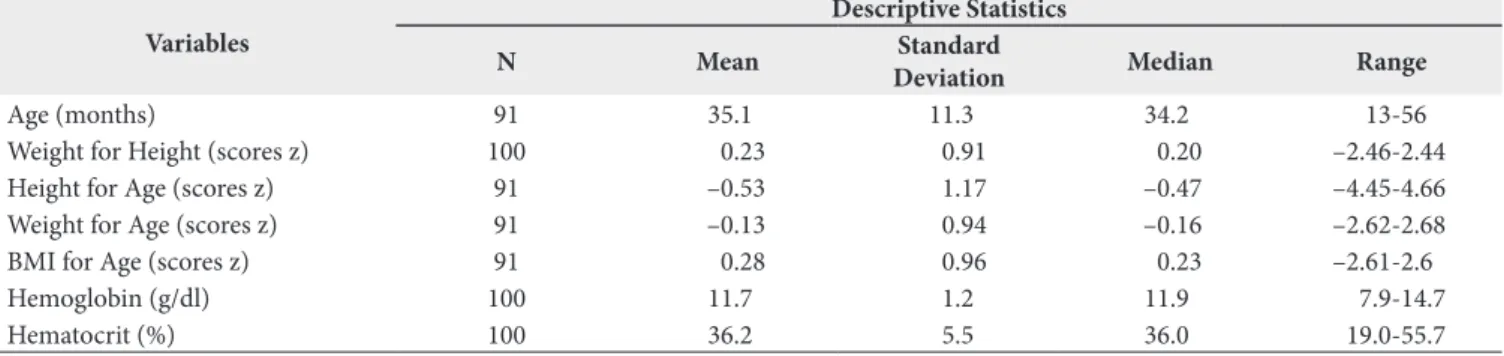
RESULTShe average age was 35 months (range 13-56) among the 100 children evaluated (53 girls), and the mean weight and height were similar to their median: 13.5 kg (median 13.6) and 91.6 cm (median 91.8). he mean concentrations of hemoglobin and hematocrit were 11.7 g/dL (median 11.9) and 36.2% (median 36.0), respectively (Table 1). he presence of anemia was signiicantly associated only with age (Table 2).
he Bland and Altman plot (Figure 1) presents the diferences between observed and estimated hemoglobin from hematocrit. he diferences were inversely associated with the mean of measured and estimated Hb (r = –0.445, p <0.001), and the 95% limits of agreement were –3.645 to 2.959 g/dL.
Table 1. Sample description of 100 children less than 5 years old assessed in public nurseries. Cuiabá – Mato Grosso, 2008
Variables
Descriptive Statistics
N Mean Standard
Deviation Median Range
Age (months) 91 35.1 11.3 34.2 13-56
Weight for Height (scores z) 100 0.23 0.91 0.20 –2.46-2.44
Height for Age (scores z) 91 –0.53 1.17 –0.47 –4.45-4.66
Weight for Age (scores z) 91 –0.13 0.94 –0.16 –2.62-2.68
BMI for Age (scores z) 91 0.28 0.96 0.23 –2.61-2.6
Hemoglobin (g/dl) 100 11.7 1.2 11.9 7.9-14.7
Hematocrit (%) 100 36.2 5.5 36.0 19.0-55.7
Table 2. Prevalence of anemia of 100 children less than 5 years old assessed in public nurseries, according to sex, age and nutritional status. Cuiabá – Mato Grosso, 2008
Variable Prevalence of anaemia* p-value**
N % CI 95%
Overall (n=100) 23 23.0 15.7-32.4
-Sex (n=100)
Male 13 27.7 10.3-32.0 0.297
Female 10 18.9 16.6-42.4
Age (n=91)
<24 months 8 47.1 24.7-70.6 0.002
≥24 months 10 13.5 7.3-23.6
Underweight (n=91)
No 16 18.4 11.5-28.1 0.121
Yes 2 50.0 9.2-90.8
Stunting (n=91)
No 16 19.1 11.9-29.1 0.543
Yes 2 28.6 6.2-70.7
Overweight (n=100)
No 21 21.9 14.6-31.4 0.190
Yes 2 50.0 9.2-90.8
*Hb<11g/dL
he area under the ROC curve was high (85%) and signiicant (p <0.001), so the hematocrit value below 35% seems to correctly identify 85% of hemoglobin below 11.0 g/dl (Figure 2). his cut-of point (35%) presents a sensitivity of 78.3% to identify children with Hb <11.0 (actually anemic) and 72.5% of non-anemic
(speciicity) (Table 3). here were no diferences among crude and adjusted curves for age and sex (p>0.05).
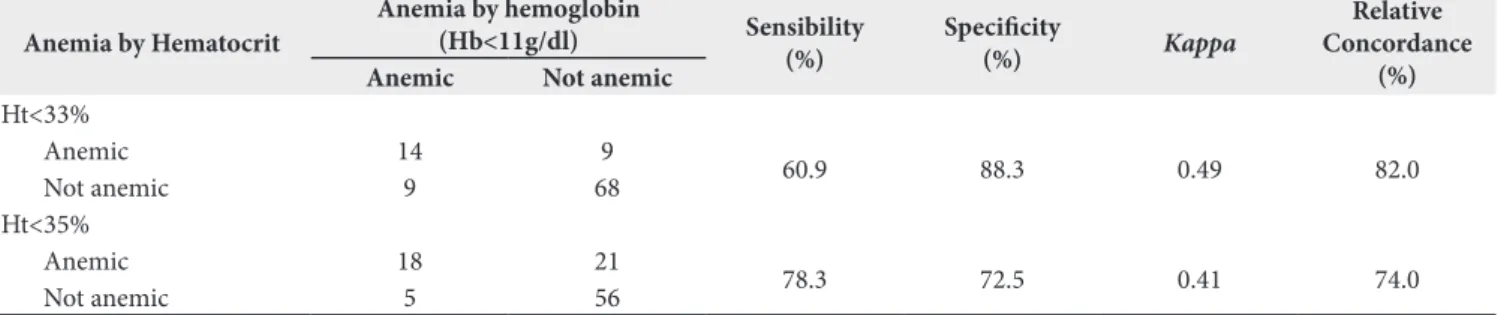
Table 3 compares the sensitivity and speciicity in predicting hematocrit anemia according to the two cut-of points: Ht <33%2
and Ht <35% (this study). he speciicity was higher (88.3%
Figure 1. Bland and Altman graph about the difference among hemoglobin measured and estimated from the hematocrit (Hb = Ht/3), by their average values in children less than 5 years old. Cuiabá – Mato Grosso, 2008. Diferences among crude and ajusted curves (X2 = 1.75; Prob>X2 = 0.1864)
versus 72.5%) for the cut-of point <33%, but the sensitivity was lower (60.9% versus 78.3). he cut-of point <33% showed a better but moderate kappa coeicient (k = 0.49 against 0.41)13. he relative agreement between the estimate of anemia
(Hb <11.0 g/dl) using a cut-of of hematocrit <33% was also better (82% vs. 74%) when compared to the cut-of of <35%.
▄
DISCUSSIONThe cut-off for hematocrit <33% had higher relative agreement and kappa coeicient in relation to the concentration of hemoglobin. It is important to remember that the relative agreement and kappa evaluate repeatability, but not necessarily validity. In addition, the kappa is strongly inluenced by prevalence, as well as by positive and negative predictive values14.
To assess validity, psychometric measurements – sensitivity and speciicity – are more appropriate, verifying the best checking point that maximizes both15. herefore, it is reasonable to use a
cut-of <35% due to the need for attracting more individuals at risk of deiciency. In addition, we found little variation on the relative agreement, less than 10%, as well as a moderate kappa between the two cut-of points13.
Considering the Bland and Altman graphic (Figure 1), the bias seems to occur between proportional values close to the mean hemoglobin: 10 and 14 g/dL. hat is, in a range close to the central values probably it will not occur medium estimation errors, in the case of using hematocrit to estimate the concentration of hemoglobin.
his study small sample size has limited power to predict the hemoglobin from hematocrit, but is suicient to investigate the correlation between these two capillary measures. Surely the ideal is always to use more than two capillary measures, for better assessment of the nutritional status, as measured by the hematocrit and hemoglobin hypochromic microcytosis. However in ield work, and also to track individuals and to have a rapid diagnosis, the health manager and the researcher oten have to choose only one measure or instrument. In this case, the hematocrit seems to be a good option even if used alone.
Other researchers have used the hematocrit to estimate the prevalence of anemia in malaria endemic areas, reporting that the hematocrit underestimates the prevalence of anemia assessed by hemoglobin16,17. Graitcer et al.18 studied more than
10,000 pairs of examinations in children under 2 years of age and concluded that hemoglobin usually detects higher rates of anemia than hematocrit, as they identiied more false negatives using the hematocrit <33%. he suggestion of this study to increase the cut-of of hematocrit <33% to <35% is one more argument to better assess its prevalence.
Quintó et al.19, studying paired values from almost
3,500 children under 5 years of age living in malaria-endemic areas in sub-Saharan Africa, observed that the Hb/Ht ratio was not exactly 1/3 and it varies during the irst years of life. hey also pointed out that the commonly assumed ‘equivalent’ cut-of points for anemia deinition need to be re-evaluated. Flores-Torres et al.20, studying 6,004 individuals, observed an
overestimation of hemoglobin levels estimated from hematocrit levels and, therefore, an underestimation of the prevalence of anemia. his is another argument for adopting a higher cut-of point (<35%) to estimate the presence of anemia from the hematocrit levels. Increasing the cut-of point from 33% to 35% would allow identifying more individuals at risk of iron deiciency.
he Brazilian Ministry of Health has implemented several programs to prevent and treat iron deiciency anemia. It is crucial to have fast and cost-saving approaches to estimate the prevalence of anemia, especially in Brazil where universal intervention are being used, such as supplementation and fortiication of foods with iron21.
▄
CONCLUSIONHemoglobin and hematocrit capillary can be used together or separately to track and assess the prevalence of anemia. In Brazil, where the prevalence of iron deiciency anemia in children reaches epidemic proportions, Ht could be easily assessed in diferent settings, providing estimates of the prevalence of anemia and helping designing and implementing strategies to prevent and treat anemia.
Table 3. Psychometric characteristics and agreement on the classification of anemia with hematocrit compared to that obtained by capillary hemoglobin in children less than 5 years old. Cuiabá – Mato Grosso, 2008
Anemia by Hematocrit
Anemia by hemoglobin
(Hb<11g/dl) Sensibility (%)
Speciicity
(%) Kappa
Relative Concordance
(%) Anemic Not anemic
Ht<33%
Anemic 14 9
60.9 88.3 0.49 82.0
Not anemic 9 68
Ht<35%
Anemic 18 21
78.3 72.5 0.41 74.0
Not anemic 5 56
▄
REFERENCES1. World Health Organization. Worldwide prevalence of anemia 1993-2005: WHO global database on anemia. Geneve; 2008.
2. World Health Organization. Iron deficiency anemia: assessment, prevention and control. Geneve: UNICEF/UNU; 2001.
3. Batista Fo M, Souza AI, Bresani CC. Anemia como problema de saúde pública: uma realidade atual. Cien Saude Colet. 2008;13(6):1917-22. http:// dx.doi.org/10.1590/S1413-81232008000600027. PMid:18833369.
4. Kassebaum NJ, Jasrasaria R, Naghavi M, Wulf SK, Johns N, Lozano R, et al. A systematic analysis of global anemia burden from 1990 to 2010. Blood. 2014;123(5):615-24. http://dx.doi.org/10.1182/blood-2013-06-508325. PMid:24297872.
5. Granado FS, Augusto RA, Muniz PT, Cardoso MA. Anaemia and iron deficiency between 2003 and 2007 in Amazonian children under 2 years of age: trends and associated factors. Public Health Nutr. 2013;16(10):1751-9. http://dx.doi.org/10.1017/S1368980012005617. PMid:23369207.
6. International Nutritional Anemia Consultative Group. Measurements of iron status. Washington: ILSI Press; 1985.
7. World Health Organization. Assessing the iron status of populations. Geneve; 2007.
8. von Schenck H, Falkensson M, Lundberg B. Evaluation of “HemoCue”, a new device for determining haemoglobin. Clin Chem. 1986;32(3):526-9. PMid:3948400.
9. Bain BJ, Bates I. Basic haematological techniques. In: Lewis SM, Bain BJ, Bates I. Practical hematology. 9th ed. Edinburgh: Churchill Livingstone; 2001. p. 19-46.
10. Brunken GS, Guimarães LV, Fisberg M. Anemia em crianças menores de 3 anos que freqüentam creches públicas em período integral. J. Pediatr. 2002; 78(1):50-6. http://dx.doi.org/10.2223/JPED.664.
11. World Health Organization. Nutritional Landscape Information System (NLIS) country profile indicators: interpretation guide. Geneve; 2010.
12. Bland JM, Altman DG. Statistical methods for assessing agreement between two methods of clinical measurements. Lancet. 1986;1(8476):307-10. http:// dx.doi.org/10.1016/S0140-6736(86)90837-8. PMid:2868172.
13. Altman DG. Practical statistics for medical research. London: Chapman & Hill; 1991.
14. Hoehler FK. Bias and prevalence effects on kappa viewed in terms of sensitivity and sensitivity and specificity. J Clin Epidemiol. 2000;53(5):499-503. http://dx.doi.org/10.1016/S0895-4356(99)00174-2. PMid:10812322.
15. Fletcher RH, Fletcher SW. Epidemiologia clínica: elementos essenciais. São Paulo: Art Med; 2006. 188 p.
16. Carneiro IA, Drakeley CJ, Owusu-Agyei S, Mmbando B, Chandramohan D. Haemoglobin and haematocrit: is the threefold conversion valid for assessing anaemia in malaria-endemic settings? Malar J. 2007;6(1):67-71. http://dx.doi.org/10.1186/1475-2875-6-67. PMid:17519019.
17. Rodríguez-Morales AJ, Sánchez E, Arria M, Vargas M, Piccolo C, Colina R, et al. Haemoglobin and haematocrit: the threefold conversion is also non valid for assessing anaemia in Plasmodium vivax malaria-endemic settings. Malar J. 2007;6(1):166-9. http://dx.doi.org/10.1186/1475-2875-6-166. PMid:18086306.
18. Graitcer PL, Goldsby JB, Nichaman MZ. Hemoglobins and hematocrits: are they equally sensitive in detecting anemias? Am J Clin Nutr. 1981;34(1):61-4. PMid:7446459.
19. Quintó L, Aponte JJ, Menéndez C, Sacarlal J, Aide P, Espasa M, et al. Relationship between haemoglobin and haematocrit in the definition of anaemia. Trop Med Int Health. 2006;11(8):1295-302. http://dx.doi. org/10.1111/j.1365-3156.2006.01679.x. PMid:16903892.
20. Flores-Torres J, Echeverría-Ortega M, Arria-Bohorquez M, Hidalgo G, Albano-Ramos C, Sanz R, et al. Diferencias entre la hemoglobina observada y estimada por hematocrito y su importancia en el diagnóstico de anemia en población costera Venezolana: análisis del segundo estudio nacional de crecimiento y desarrollo humano (SENACREDH). Rev Peru Med Exp Salud Publica. 2011;28(1):47-53. http://dx.doi.org/10.1590/S1726-46342011000100008. PMid:21537769.
21. Szarfarc SC. Políticas públicas para o controle da anemia ferropriva. Rev Bras Hematol Hemoter. 2010;32(Suppl 2):2-7. http://dx.doi.org/10.1590/ S1516-84842010005000065.